Difference between revisions of "Precipitation"
m |
|||
| Line 1: | Line 1: | ||
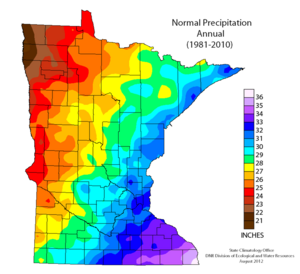
| − | [[File:Precipitation 1981 to 2010.png | + | [[File:Precipitation 1981 to 2010.png|thumb|300px|alt=map showing normal annual precipitation across Minnesota.|<font size=3>Normal annual precipitation across Minnesota for the period 1981 to 2010. Generally, precipitation increases from west to east. Source:[http://dnr.state.mn.us/waters/groundwater_section/climatology/index.html State Climatology Office, Minnesota Department of Natural Resources - Division of Ecological and Water Resources]</font size>]] |
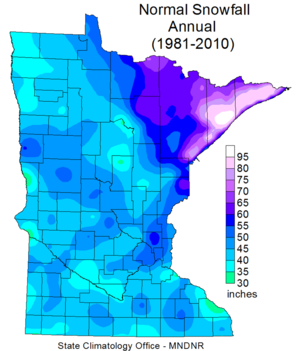
| − | [[File: | + | [[File:Annual snowfall 1981-2010.png|thumb|300px|alt=map showing normal annual snowfall in Minnesota|<font size=3>Normal annual snowfall in Minnesota. Snowfall is greatest in the northeastern part of the state. Source:[http://dnr.state.mn.us/waters/groundwater_section/climatology/index.html State Climatology Office, Minnesota Department of Natural Resources - Division of Ecological and Water Resources]</font size>]] |
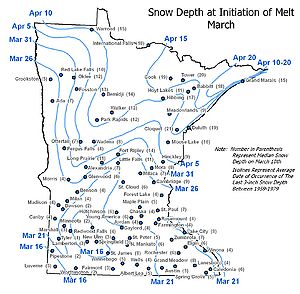
[[File:Snow depth at initiation of melt.jpg|left|thumb|300px|alt=map showing typical snow depth in Minnesota at the time of melt|<font size=3>Typical snow depth in Minnesota at the time of melt. This graphic is somewhat misleading because it does not show the amount of moisture running off as snowmelt when the snowpack melts.</font size>]] | [[File:Snow depth at initiation of melt.jpg|left|thumb|300px|alt=map showing typical snow depth in Minnesota at the time of melt|<font size=3>Typical snow depth in Minnesota at the time of melt. This graphic is somewhat misleading because it does not show the amount of moisture running off as snowmelt when the snowpack melts.</font size>]] | ||
| − | |||
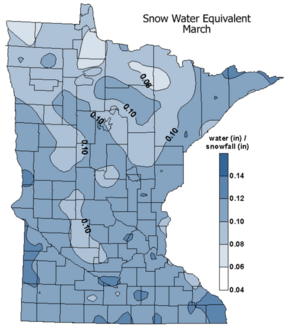
[[File:Snow water equivalent March.png|left|thumb|300px|alt=map showing average snow water equivalent in Minnesota at the time of melt|<font size=3>Average snow water equivalent in Minnesota at the time of melt. Water equivalent generally increases to the south.</font size>]] | [[File:Snow water equivalent March.png|left|thumb|300px|alt=map showing average snow water equivalent in Minnesota at the time of melt|<font size=3>Average snow water equivalent in Minnesota at the time of melt. Water equivalent generally increases to the south.</font size>]] | ||
Revision as of 14:03, 4 February 2016

Normal annual precipitation across Minnesota for the period 1981 to 2010. Generally, precipitation increases from west to east. Source:State Climatology Office, Minnesota Department of Natural Resources - Division of Ecological and Water Resources

Normal annual snowfall in Minnesota. Snowfall is greatest in the northeastern part of the state. Source:State Climatology Office, Minnesota Department of Natural Resources - Division of Ecological and Water Resources

