![]()
Difference between revisions of "Requirements, recommendations and information for using permeable pavement BMPs in the MIDS calculator"
m |
|||
| (15 intermediate revisions by the same user not shown) | |||
| Line 1: | Line 1: | ||
| − | + | [[File:Technical information page image.png|100px|left|alt=image]] | |
| − | |||
[[File:MIDS calculator symbol permeable pavement.jpg|thumb|300px|alt=MIDS calculator symbol for permeable pavement|<font size=3>MIDS calculator symbol for permeable pavement.</font size>]] | [[File:MIDS calculator symbol permeable pavement.jpg|thumb|300px|alt=MIDS calculator symbol for permeable pavement|<font size=3>MIDS calculator symbol for permeable pavement.</font size>]] | ||
[[File:Screen shot permeable pavement watershed tab.png|300px|thumb|alt=Screen shot of watershed tab for permeable pavement|<font size=3>MIDS calculator screen shot of watershed tab for permeable pavement.</font size>]] | [[File:Screen shot permeable pavement watershed tab.png|300px|thumb|alt=Screen shot of watershed tab for permeable pavement|<font size=3>MIDS calculator screen shot of watershed tab for permeable pavement.</font size>]] | ||
| Line 6: | Line 5: | ||
For [[Permeable pavement|permeable pavement]], stormwater runoff captured by the BMP and stored below the underdrain (if underdrain is present) is infiltrated into the underlying soil between rain events. All pollutants in the infiltrated stormwater are credited as being reduced. Pollutants in stormwater captured by the BMP but entering the underdrain are treated as they pass through the filter media and out the underdrain. | For [[Permeable pavement|permeable pavement]], stormwater runoff captured by the BMP and stored below the underdrain (if underdrain is present) is infiltrated into the underlying soil between rain events. All pollutants in the infiltrated stormwater are credited as being reduced. Pollutants in stormwater captured by the BMP but entering the underdrain are treated as they pass through the filter media and out the underdrain. | ||
| + | |||
| + | ==Changes to Version 4 of the MIDS Calculator== | ||
| + | {{alert|Changes have been made to Version 4 of the MIDS Calculator|alert-info}} | ||
| + | The particulate phosphorus credit has been reduced from 82 to 74 percent to match the TSS reduction. Particulate pollutant removal cannot exceed sediment removal. | ||
==MIDS calculator user inputs for permeable pavement== | ==MIDS calculator user inputs for permeable pavement== | ||
| Line 17: | Line 20: | ||
**Bottom surface area (A<sub>B</sub>): This is the surface area at the bottom of the engineered media. It represents the area where the engineered media changes to native soils. The user inputs this value in square feet. | **Bottom surface area (A<sub>B</sub>): This is the surface area at the bottom of the engineered media. It represents the area where the engineered media changes to native soils. The user inputs this value in square feet. | ||
**Depth below underdrain (D<sub>U</sub>): This is the depth below the underdrain to the native soils. If no underdrain is present, this is the thickness of the engineered media. | **Depth below underdrain (D<sub>U</sub>): This is the depth below the underdrain to the native soils. If no underdrain is present, this is the thickness of the engineered media. | ||
| − | **Media porosity: This is the ratio of pore space in the engineered media to the total volume of the engineered media. Units are volume/volume (e.g., cubic centimeters per cubic centimeter). If various types of media are used in the BMP, this value should be an average of the media installed between the underdrain and the native soils. Click [[Soil water storage properties|here]] to see values for porosity based on soil type. | + | **Media porosity (n): This is the ratio of pore space in the engineered media to the total volume of the engineered media. Units are volume/volume (e.g., cubic centimeters per cubic centimeter). If various types of media are used in the BMP, this value should be an average of the media installed between the underdrain and the native soils. Click [[Soil water storage properties|here]] to see values for porosity based on soil type. |
**Will subsoil require compaction?: This is a YES/NO question. Select YES if compaction of the soil subgrade is needed to support vehicular loads. This selection does not affect the calculation of volume or pollutant reduction credits, but will likely reduce the infiltration rates of the underlying soils and the associated volume and pollutant credits. The USER should consider selecting a lower infiltration rate if the subsoil is compacted. | **Will subsoil require compaction?: This is a YES/NO question. Select YES if compaction of the soil subgrade is needed to support vehicular loads. This selection does not affect the calculation of volume or pollutant reduction credits, but will likely reduce the infiltration rates of the underlying soils and the associated volume and pollutant credits. The USER should consider selecting a lower infiltration rate if the subsoil is compacted. | ||
| − | **Underlying soil - Hydrologic Soil Group: The user selects the most restrictive soil (lowest hydraulic conductivity) within | + | **Underlying soil - Hydrologic Soil Group: The user selects the most restrictive soil (lowest hydraulic conductivity) within 5 feet of the soil/media interface in the permeable pavement. There are 14 soil options that fall into 4 different Hydrologic Soil Groups (Hydrologic Soil Group (HSG) A, B, C, or D) for the user. Once a soil type is selected, the corresponding [[Design infiltration rates|infiltration rate]] will populate in the ''Infiltration rate of underlying soils'' field. The user may also select ''User Defined''. This selection will activate the ''User Defined Infiltration Rate'' cell allowing the user to enter a different value from the values in the predefined selection list. The maximum allowable infiltration rate is 1.63 inches per hour. |
**Required drawdown time (hrs): This is the time in which the stormwater captured by the BMP must drain into the underlying soil/media. The user selects from predefined values of 48 or 24 hours. The [http://www.pca.state.mn.us/index.php/water/water-types-and-programs/stormwater/construction-stormwater/index.html MPCA Construction Stormwater General Permit] requires drawdown within 48 hours, but 24 hours is Highly Recommended when discharges are to a trout stream. The calculator uses the underlying soil infiltration rate and the ''Depth below underdrain'' to check if the BMP is meeting the drawdown time requirement. The user will encounter an error and be required to enter a new ''Depth below underdrain'' if the water stored in the BMP cannot drawdown in the required time. | **Required drawdown time (hrs): This is the time in which the stormwater captured by the BMP must drain into the underlying soil/media. The user selects from predefined values of 48 or 24 hours. The [http://www.pca.state.mn.us/index.php/water/water-types-and-programs/stormwater/construction-stormwater/index.html MPCA Construction Stormwater General Permit] requires drawdown within 48 hours, but 24 hours is Highly Recommended when discharges are to a trout stream. The calculator uses the underlying soil infiltration rate and the ''Depth below underdrain'' to check if the BMP is meeting the drawdown time requirement. The user will encounter an error and be required to enter a new ''Depth below underdrain'' if the water stored in the BMP cannot drawdown in the required time. | ||
*'''BMP Summary Tab''': The BMP Summary tab summarizes the volume and pollutant reductions provided by the specific BMP. It details the performance goal volume reductions and annual average volume, dissolved P, particulate P, and TSS load reductions. Included in the summary are the total volume and pollutant loads received by the BMP from its direct watershed, from upstream BMPs and a combined value of the two. Also included in the summary are the volume and pollutant load reductions provided by the BMP, in addition to the volume and pollutant loads that exit the BMP through the outflow. This outflow load and volume is what is routed to the downstream BMP if one is defined in the Watershed tab. Finally, percent reductions are provided for the percent of the performance goal achieved, percent annual runoff volume retained, total percent annual particulate phosphorus reduction, total percent annual dissolved phosphorus reduction, total percent annual TP reduction, and total percent annual TSS reduction. | *'''BMP Summary Tab''': The BMP Summary tab summarizes the volume and pollutant reductions provided by the specific BMP. It details the performance goal volume reductions and annual average volume, dissolved P, particulate P, and TSS load reductions. Included in the summary are the total volume and pollutant loads received by the BMP from its direct watershed, from upstream BMPs and a combined value of the two. Also included in the summary are the volume and pollutant load reductions provided by the BMP, in addition to the volume and pollutant loads that exit the BMP through the outflow. This outflow load and volume is what is routed to the downstream BMP if one is defined in the Watershed tab. Finally, percent reductions are provided for the percent of the performance goal achieved, percent annual runoff volume retained, total percent annual particulate phosphorus reduction, total percent annual dissolved phosphorus reduction, total percent annual TP reduction, and total percent annual TSS reduction. | ||
| Line 32: | Line 35: | ||
Where | Where | ||
| − | : | + | :D<sub>U</sub> is the depth below the underdrain (ft); and |
| − | : | + | :I<sub>R</sub> is the infiltration rate of the native soils (inches/hr). |
*Infiltration rates of the underlying soils are restricted to being below 1.63 inches per hour. | *Infiltration rates of the underlying soils are restricted to being below 1.63 inches per hour. | ||
*The ''Bottom surface area'' cannot be greater than the ''Surface area at underdrain''. | *The ''Bottom surface area'' cannot be greater than the ''Surface area at underdrain''. | ||
| Line 39: | Line 42: | ||
==Methodology== | ==Methodology== | ||
===Required Treatment Volume=== | ===Required Treatment Volume=== | ||
| − | ''Required treatment volume'', or the volume of stormwater runoff delivered to the BMP, equals the performance goal (1.1 inches or user-specified performance goal) times the impervious area draining to the BMP, plus any water routed to the BMP from an upstream BMP. This stormwater is delivered to the BMP instantaneously | + | ''Required treatment volume'', or the volume of stormwater runoff delivered to the BMP, equals the performance goal (1.1 inches or user-specified performance goal) times the impervious area draining to the BMP, plus any water routed to the BMP from an upstream BMP. This stormwater is delivered to the BMP instantaneously. |
===Volume Reduction=== | ===Volume Reduction=== | ||
| Line 59: | Line 62: | ||
Pollutant load reductions are calculated on an annual basis. Therefore, the first step in calculating annual pollutant load reductions is converting the ''Volume reduction capacity of BMP'', which is an instantaneous volume reduction, to an annual volume reduction percentage. This is accomplished through the use of [[Performance curves for MIDS calculator|performance curves]] developed from multiple modeling scenarios. The performance curves use the ''Volume reduction capacity of BMP'', the infiltration rate of the underlying soils, the contributing watershed percent impervious area, and the size of the contributing watershed to calculate a percent annual volume reduction. While oversizing a BMP above the ''Required treatment volume'' will not provide additional credit towards the performance goal volume, it may provide additional pollutant reduction. | Pollutant load reductions are calculated on an annual basis. Therefore, the first step in calculating annual pollutant load reductions is converting the ''Volume reduction capacity of BMP'', which is an instantaneous volume reduction, to an annual volume reduction percentage. This is accomplished through the use of [[Performance curves for MIDS calculator|performance curves]] developed from multiple modeling scenarios. The performance curves use the ''Volume reduction capacity of BMP'', the infiltration rate of the underlying soils, the contributing watershed percent impervious area, and the size of the contributing watershed to calculate a percent annual volume reduction. While oversizing a BMP above the ''Required treatment volume'' will not provide additional credit towards the performance goal volume, it may provide additional pollutant reduction. | ||
| − | A 100 percent removal is credited for all pollutants associated with the reduced volume of stormwater since these pollutants are either attenuated within the media or pass into the underlying soil with infiltrating water. Stormwater that is not infiltrated is assumed to flow through the filter media and out the underdrain. A 74 percent TSS, | + | A 100 percent removal is credited for all pollutants associated with the reduced volume of stormwater since these pollutants are either attenuated within the media or pass into the underlying soil with infiltrating water. Stormwater that is not infiltrated is assumed to flow through the filter media and out the underdrain. A 74 percent TSS, 74 percent particulate phosphorus, and 0 percent dissolved phosphorus removal is applied to the filtered stormwater. A schematic of the removal rates can be seen in the sidebar. |
NOTE: The user can modify event mean concentrations (EMCs) on the Site Information tab in the calculator. Default concentrations are 54.5 milligrams per liter for total suspended solids (TSS) and 0.3 milligrams per liter for total phosphorus (particulate plus dissolved). The calculator will notify the user if the default is changed. Changing the default EMC will result in changes to the total pounds of pollutant reduced. | NOTE: The user can modify event mean concentrations (EMCs) on the Site Information tab in the calculator. Default concentrations are 54.5 milligrams per liter for total suspended solids (TSS) and 0.3 milligrams per liter for total phosphorus (particulate plus dissolved). The calculator will notify the user if the default is changed. Changing the default EMC will result in changes to the total pounds of pollutant reduced. | ||
| Line 72: | Line 75: | ||
*The permeable pavement is properly [[Operation and maintenance of permeable pavement|maintained]]. The performance of the permeable pavement should be regularly assessed. | *The permeable pavement is properly [[Operation and maintenance of permeable pavement|maintained]]. The performance of the permeable pavement should be regularly assessed. | ||
| − | ==Example application in the MIDS calculator | + | ==Example application in the MIDS calculator== |
[[File:schematic for permeable pavement example.jpg|left|thumb|300px|alt=schematic for permeable pavement example|<font size=3>Schematic illustrating the site conditions for the permeable pavement example. In this example, there are 0.7 acres of impervious parking lot draining to a 0.7 acre permeable pavement area. A 0.4 acre turf area surrounds the site. The permeable pavement is included in the site impervious area. See Step 1.</font size>]] | [[File:schematic for permeable pavement example.jpg|left|thumb|300px|alt=schematic for permeable pavement example|<font size=3>Schematic illustrating the site conditions for the permeable pavement example. In this example, there are 0.7 acres of impervious parking lot draining to a 0.7 acre permeable pavement area. A 0.4 acre turf area surrounds the site. The permeable pavement is included in the site impervious area. See Step 1.</font size>]] | ||
[[file:site information tab for permeable pavement example.png|300px|thumb|<font size=3>Screen shot of the Site Information tab for the permeable pavement example. See Step 2.</font size>]] | [[file:site information tab for permeable pavement example.png|300px|thumb|<font size=3>Screen shot of the Site Information tab for the permeable pavement example. See Step 2.</font size>]] | ||
[[File:schematic tab for permeable pavement example.png|300px|thumb|alt=screen shot of schematic tab for permeable pavement example|<font size=3>Screen shot of the Schematic tab for the permeable pavement example. See Step 3.</font size>]] | [[File:schematic tab for permeable pavement example.png|300px|thumb|alt=screen shot of schematic tab for permeable pavement example|<font size=3>Screen shot of the Schematic tab for the permeable pavement example. See Step 3.</font size>]] | ||
| + | |||
| + | This example was completed using Version 2 of the calculator. | ||
Half of an existing 1.4 acre parking lot is going to be converted to permeable pavement. The entire parking lot (1.4 acres) plus 0.4 acres of pervious area (Turf Area) surrounding the parking lot will drain into the permeable pavement. The soils across the area have a unified soils classification of SM (HSG type B soil). An underdrain will be installed under the permeable pavement 0.5 feet above the native soils. Following the [http://www.pca.state.mn.us/index.php/water/water-types-and-programs/stormwater/construction-stormwater/index.html MPCA Construction Stormwater General Permit] requirement, the water below the underdrain needs to drawdown in a 48 hour time period. The media below the underdrain has a porosity of 0.4 cubic feet per cubic foot. The following steps detail how this system would be set up in the MIDS calculator. | Half of an existing 1.4 acre parking lot is going to be converted to permeable pavement. The entire parking lot (1.4 acres) plus 0.4 acres of pervious area (Turf Area) surrounding the parking lot will drain into the permeable pavement. The soils across the area have a unified soils classification of SM (HSG type B soil). An underdrain will be installed under the permeable pavement 0.5 feet above the native soils. Following the [http://www.pca.state.mn.us/index.php/water/water-types-and-programs/stormwater/construction-stormwater/index.html MPCA Construction Stormwater General Permit] requirement, the water below the underdrain needs to drawdown in a 48 hour time period. The media below the underdrain has a porosity of 0.4 cubic feet per cubic foot. The following steps detail how this system would be set up in the MIDS calculator. | ||
| Line 117: | Line 122: | ||
==Requirements== | ==Requirements== | ||
{{alert|The following are requirements of the [http://www.pca.state.mn.us/index.php/water/water-types-and-programs/stormwater/construction-stormwater/index.html Minnesota Construction Stormwater General Permit]|alert-danger}} | {{alert|The following are requirements of the [http://www.pca.state.mn.us/index.php/water/water-types-and-programs/stormwater/construction-stormwater/index.html Minnesota Construction Stormwater General Permit]|alert-danger}} | ||
| − | *3 foot separation from the bottom of an infiltration system to the seasonal high water table | + | *3 foot separation from the bottom of an infiltration system to the [[Glossary#S|seasonal high water table]] |
| − | *Use the most restrictive infiltration rate within | + | *Use the most restrictive infiltration rate within 5 feet of the bottom of the BMP |
*For measured infiltration rates, apply a safety factor of 2 | *For measured infiltration rates, apply a safety factor of 2 | ||
*Pretreatment for infiltration systems | *Pretreatment for infiltration systems | ||
| Line 136: | Line 141: | ||
==Links to MIDS pages== | ==Links to MIDS pages== | ||
| + | *[[Overview of Minimal Impact Design Standards (MIDS)]] | ||
*[[Performance goals for new development, re-development and linear projects]] | *[[Performance goals for new development, re-development and linear projects]] | ||
| − | *[[Flexible treatment options]] | + | *[[Design Sequence Flowchart-Flexible treatment options]] |
| − | *[[ | + | *[[Community Assistance Package]] |
*[[MIDS calculator]] | *[[MIDS calculator]] | ||
| + | *[[Performance curves for MIDS calculator]] | ||
| + | *[[Training and workshop materials and modules]] | ||
| + | *[[Technical documents]] | ||
| + | |||
| + | <noinclude> | ||
| + | [[Category:Level 3 - Models and modeling/Specific models/MIDS Calculator]] | ||
| + | [[Category:Level 3 - Best management practices/Structural practices/Permeable pavement]] | ||
| + | </noinclude> | ||
Latest revision as of 18:54, 23 November 2022


For permeable pavement, stormwater runoff captured by the BMP and stored below the underdrain (if underdrain is present) is infiltrated into the underlying soil between rain events. All pollutants in the infiltrated stormwater are credited as being reduced. Pollutants in stormwater captured by the BMP but entering the underdrain are treated as they pass through the filter media and out the underdrain.
Contents
Changes to Version 4 of the MIDS Calculator
The particulate phosphorus credit has been reduced from 82 to 74 percent to match the TSS reduction. Particulate pollutant removal cannot exceed sediment removal.
MIDS calculator user inputs for permeable pavement
For permeable pavement systems, the user must input the following parameters to calculate the volume and pollutant load reductions associated with the BMP.
- Watershed tab
- BMP Name: this cell is auto-filled but can be changed by the user.
- Routing/downstream BMP: if this BMP is part of a treatment train and water is being routed from this BMP to another BMP, the user selects the name of the BMP from the dropdown box to which water is being routed. All water must be routed to a single downstream BMP. The User must include the BMP receiving the routed water in the Schematic or the BMP will not appear in the dropdown box.
- BMP Watershed Area: BMP watershed areas are the areas draining directly to the BMP. Values can be added for four soil types (Hydrologic Soil Groups (HSG) A, B, C, D) and for three Land Cover types (Forest/Open Space, Managed Turf and impervious area). The Impervious Cover includes the surface area of the permeable pavement and impervious area in the watershed that drains directly to the permeable pavement BMP. Units are in acres.
- BMP Parameters tab
- Surface area at underdrain (AU): This is the surface area of the BMP at the invert of the underdrain. If an underdrain is not present, it is the surface area of the permeable pavement. The user inputs this value in square feet. The calculator will display the surface area in acres for comparison with the watershed impervious cover acres entered for the BMP.
- Bottom surface area (AB): This is the surface area at the bottom of the engineered media. It represents the area where the engineered media changes to native soils. The user inputs this value in square feet.
- Depth below underdrain (DU): This is the depth below the underdrain to the native soils. If no underdrain is present, this is the thickness of the engineered media.
- Media porosity (n): This is the ratio of pore space in the engineered media to the total volume of the engineered media. Units are volume/volume (e.g., cubic centimeters per cubic centimeter). If various types of media are used in the BMP, this value should be an average of the media installed between the underdrain and the native soils. Click here to see values for porosity based on soil type.
- Will subsoil require compaction?: This is a YES/NO question. Select YES if compaction of the soil subgrade is needed to support vehicular loads. This selection does not affect the calculation of volume or pollutant reduction credits, but will likely reduce the infiltration rates of the underlying soils and the associated volume and pollutant credits. The USER should consider selecting a lower infiltration rate if the subsoil is compacted.
- Underlying soil - Hydrologic Soil Group: The user selects the most restrictive soil (lowest hydraulic conductivity) within 5 feet of the soil/media interface in the permeable pavement. There are 14 soil options that fall into 4 different Hydrologic Soil Groups (Hydrologic Soil Group (HSG) A, B, C, or D) for the user. Once a soil type is selected, the corresponding infiltration rate will populate in the Infiltration rate of underlying soils field. The user may also select User Defined. This selection will activate the User Defined Infiltration Rate cell allowing the user to enter a different value from the values in the predefined selection list. The maximum allowable infiltration rate is 1.63 inches per hour.
- Required drawdown time (hrs): This is the time in which the stormwater captured by the BMP must drain into the underlying soil/media. The user selects from predefined values of 48 or 24 hours. The MPCA Construction Stormwater General Permit requires drawdown within 48 hours, but 24 hours is Highly Recommended when discharges are to a trout stream. The calculator uses the underlying soil infiltration rate and the Depth below underdrain to check if the BMP is meeting the drawdown time requirement. The user will encounter an error and be required to enter a new Depth below underdrain if the water stored in the BMP cannot drawdown in the required time.
- BMP Summary Tab: The BMP Summary tab summarizes the volume and pollutant reductions provided by the specific BMP. It details the performance goal volume reductions and annual average volume, dissolved P, particulate P, and TSS load reductions. Included in the summary are the total volume and pollutant loads received by the BMP from its direct watershed, from upstream BMPs and a combined value of the two. Also included in the summary are the volume and pollutant load reductions provided by the BMP, in addition to the volume and pollutant loads that exit the BMP through the outflow. This outflow load and volume is what is routed to the downstream BMP if one is defined in the Watershed tab. Finally, percent reductions are provided for the percent of the performance goal achieved, percent annual runoff volume retained, total percent annual particulate phosphorus reduction, total percent annual dissolved phosphorus reduction, total percent annual TP reduction, and total percent annual TSS reduction.
Model input requirements and recommendations
The following are requirements or recommendations for inputs into the MIDS calculator. If the following are not met, an error message will inform the user to change the input to meet the requirement.
- The Surface area at the underdrain of the permeable pavement cannot be greater than the total impervious area routed to the permeable pavement.
- The total contributing impervious area cannot be more than 5 times the surface area of the permeable pavement. Since the permeable pavement itself is treated as an impervious surface in the calculator, the maximum run-on area to a permeable pavement system from traditional impervious surfaces must be equal to or less than four times the area of the permeable pavement. For example, a parking lot with 10,000 square foot of permeable pavement can also have a 40,000 square foot or less run-on area from a traditional parking lot. In this example, the maximum impervious area input to the calculator is 50,000 square feet.
- The water underneath the underdrain must meet the drawdown time requirement specified. The drawdown time requirement is checked by comparing the user defined drawdown time with the calculated drawdown time (DDTcalc), given by
\(DDT_{calc} = D_U / (I_R / 12)\)
Where
- DU is the depth below the underdrain (ft); and
- IR is the infiltration rate of the native soils (inches/hr).
- Infiltration rates of the underlying soils are restricted to being below 1.63 inches per hour.
- The Bottom surface area cannot be greater than the Surface area at underdrain.
Methodology
Required Treatment Volume
Required treatment volume, or the volume of stormwater runoff delivered to the BMP, equals the performance goal (1.1 inches or user-specified performance goal) times the impervious area draining to the BMP, plus any water routed to the BMP from an upstream BMP. This stormwater is delivered to the BMP instantaneously.
Volume Reduction
The volume reduction achieved by a BMP compares the capacity of the BMP to the required treatment volume. The Volume reduction capacity of BMP is calculated using BMP inputs provided by the user. For this BMP the volume reduction credit is equal to the amount of water that can be instantaneously captured by the BMP in the media below the underdrain. The capture volume (V) is therefore given by
\(V= (A_U + A_B)) / 2 * n * D_U \)
Where:
- AU is the surface area at the underdrain in ft2
- AB is the surface area at the bottom of the basin in ft2
- n is the media porosity of the soils
- DU is the depth of the media below the underdrain in ft
The Volume of retention provided by BMP is the amount of volume credit the BMP provides toward the performance goal. This value is equal to the lesser of the Volume reduction capacity of BMP calculated using the above method or the Required treatment volume. This check makes sure that the BMP is not getting more credit than necessary to meet the performance goal. For example, if the BMP is oversized the user will only receive credit for the Required treatment volume routed to the BMP, which corresponds with meeting the performance goal for the site .
Pollutant Reduction

Pollutant load reductions are calculated on an annual basis. Therefore, the first step in calculating annual pollutant load reductions is converting the Volume reduction capacity of BMP, which is an instantaneous volume reduction, to an annual volume reduction percentage. This is accomplished through the use of performance curves developed from multiple modeling scenarios. The performance curves use the Volume reduction capacity of BMP, the infiltration rate of the underlying soils, the contributing watershed percent impervious area, and the size of the contributing watershed to calculate a percent annual volume reduction. While oversizing a BMP above the Required treatment volume will not provide additional credit towards the performance goal volume, it may provide additional pollutant reduction.
A 100 percent removal is credited for all pollutants associated with the reduced volume of stormwater since these pollutants are either attenuated within the media or pass into the underlying soil with infiltrating water. Stormwater that is not infiltrated is assumed to flow through the filter media and out the underdrain. A 74 percent TSS, 74 percent particulate phosphorus, and 0 percent dissolved phosphorus removal is applied to the filtered stormwater. A schematic of the removal rates can be seen in the sidebar.
NOTE: The user can modify event mean concentrations (EMCs) on the Site Information tab in the calculator. Default concentrations are 54.5 milligrams per liter for total suspended solids (TSS) and 0.3 milligrams per liter for total phosphorus (particulate plus dissolved). The calculator will notify the user if the default is changed. Changing the default EMC will result in changes to the total pounds of pollutant reduced.
Routing
A permeable pavement BMP can be routed to any other BMP, except for a green roof and a swale side slope or any BMP that would cause stormwater to be rerouted back to the infiltration basin already in the stormwater runoff treatment sequence. All BMPs can be routed to the permeable pavement, except for a swale side slope.
Assumptions
The following general assumptions apply in calculating the credit for a permeable pavement system. If these assumptions are not followed, the volume and pollutant reduction credits cannot be applied.
- The permeable pavement is properly designed.
- The permeable pavement was properly constructed, consistent with the design criteria.
- The permeable pavement is properly maintained. The performance of the permeable pavement should be regularly assessed.
Example application in the MIDS calculator


This example was completed using Version 2 of the calculator.
Half of an existing 1.4 acre parking lot is going to be converted to permeable pavement. The entire parking lot (1.4 acres) plus 0.4 acres of pervious area (Turf Area) surrounding the parking lot will drain into the permeable pavement. The soils across the area have a unified soils classification of SM (HSG type B soil). An underdrain will be installed under the permeable pavement 0.5 feet above the native soils. Following the MPCA Construction Stormwater General Permit requirement, the water below the underdrain needs to drawdown in a 48 hour time period. The media below the underdrain has a porosity of 0.4 cubic feet per cubic foot. The following steps detail how this system would be set up in the MIDS calculator.
Step 1: Determine the watershed characteristics of your entire site. For this example we have a 1.8 acre site with 1.4 acres of impervious area and 0.4 acres of pervious turf area in type B soils. The impervious area includes the area of parking lot that has permeable pavement.
Step 2: Fill in the site specific information into the Site Information tab. This includes entering a Zip Code (55414 for this example) and the watershed information from Step 1. Zip code and impervious area must be filled in or an error message will be generated. Other fields on this screen are optional.
Step 3: Go to the Schematic tab and drag and drop the Permeable Pavement icon into the Schematic Window
Step 4: Open the BMP properties for the permeable pavement by right clicking on the “Permeable pavement” icon and selecting Edit BMP properties, or by double clicking on the Permeable pavement icon. Click on the Watershed tab.
Step 5: If help is needed, click on the Minnesota Stormwater Manual Wiki link or the Help button to review input parameter specifications and calculation specific to the Permeable pavement BMP.
Step 6: Determine the watershed characteristics for the permeable pavement. For this example the entire site is draining to the permeable pavement. The watershed parameters therefore include a 1.8 acre site with 1.4 acres of impervious area and 0.4 acres of pervious turf area in B soils. There is no routing for this BMP. Fill in the BMP specific watershed information (1.4 acres on impervious cover and 0.4 acres of Managed turf in B soils).

Step 7: Enter in the BMP design parameters into the BMP parameters tab. Permeable pavement requires the following entries:
- Surface area at underdrain. This is the area of the BMP, which is therefore the area of the permeable pavement. This area is 0.7 acre or 30492 square feet.
- Bottom surface area, which is the area at the interface between the bottom of the permeable pavement system and the top of the underlying native soils. This area is 30492 square feet.
- The depth below the underdrain is 0.5 feet.
- The media porosity is 0.4 cubic feet per cubic foot.
- Will the soil require compaction – No.
- Underlying soil – Hydrologic Soil Group, which is 6 SM (HSG B, 0.45 in/hr).
- Required drawdown time, which is 48 hours.
Step 8: Click on BMP Summary tab to view results for this BMP.
Step 9: Click on the OK button to exit the BMP properties screen.
Step 10: Click on Results tab to see overall results for the site.
- MIDS calculator screen shots for inputs for permeable pavement. Click on an image for enlarged view.
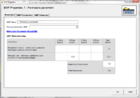
Screen shot of watershed tab for permeable pavement example. See Step 6.
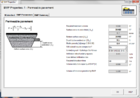
Screen shot of BMP Parameters tab for permeable pavement example. See Step 7.
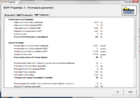
Screen shot of BMP Summary tab for permeable pavement example. See Step 8.
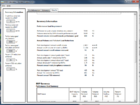
Screen shot of Results tab for permeable pavement example. See Step 10.


Requirements
- 3 foot separation from the bottom of an infiltration system to the seasonal high water table
- Use the most restrictive infiltration rate within 5 feet of the bottom of the BMP
- For measured infiltration rates, apply a safety factor of 2
- Pretreatment for infiltration systems
Recommendations
- Drawdown time of 24 hours when the discharge is to trout streams
- Field tested infiltration rates rather than table values
Information
- Guidance on determining infiltration rates
- Information on site constraints (shallow soil, karst, etc.)
- Guidance on pretreatment
- Construction specifications for permeable pavement BMPs
- Information on operation and maintenance of permeable pavement BMPs.
Links to MIDS pages
- Overview of Minimal Impact Design Standards (MIDS)
- Performance goals for new development, re-development and linear projects
- Design Sequence Flowchart-Flexible treatment options
- Community Assistance Package
- MIDS calculator
- Performance curves for MIDS calculator
- Training and workshop materials and modules
- Technical documents
This page was last edited on 23 November 2022, at 18:54.