Difference between revisions of "Examples for completing the TMDL reporting form"
| (236 intermediate revisions by 4 users not shown) | |||
| Line 1: | Line 1: | ||
| − | + | {{alert|This page is for guidance related to the TMDL Annual Reporting Form for Phase I MS4 permittees. |alert-danger}} | |
| − | |||
| − | + | This page provides step-by-step examples on how to fill out the four tabs in the Commissioner-approved Total Maximum Daily Load (TMDL) Form from the perspective of five fictional permittees. These are the ''BMP-Activites completed'' tab, the ''Cumulative reductions'' tab, the ''Category 3 BMPs- Activities'' tab, and the ''Adaptive management strategy'' tab. (Note: the terms "tab" and "worksheet" are used interchangeably.) | |
| − | |||
| − | |||
| − | |||
| − | + | Permittees are not required to report on every Best Management Practice (BMP) or activity they have implemented, but instead just on those BMPs or activities that are being applied to applicable TMDL Wasteload Allocations (WLAs). Each BMP contained in the dropdown box of [http://stormwater.pca.state.mn.us/index.php/Phase_I_MS4_Guidance_for_completing_the_TMDL_Annual_report_form#Column_E_.E2.80.93_BMP.2FActivity column E] of the ''BMP-Activities completed'' tab will be covered in the examples. Please become familiar with the [[Phase I MS4 Guidance for completing the TMDL Annual report form]] or the quickguides (see [http://stormwater.pca.state.mn.us/index.php/Quick_Guide:_BMP-Activities_completed_tab] and [http://stormwater.pca.state.mn.us/index.php/Quick_Guide:_Cumulative_reductions_tab]) before continuing on with the examples. | |
| + | |||
| + | In order to complete the TMDL form, it is important that the permittee have a means to | ||
| + | *identify and list BMPs applicable to TMDL WLAs; | ||
| + | *define the watersheds of applicable TMDLs; | ||
| + | *determine which BMPs can be applied within each TMDL watershed; and | ||
| + | *[http://stormwater.pca.state.mn.us/index.php/Phase_I_MS4_Guidance_for_completing_the_TMDL_Annual_report_form#Category_1_-_Summary_of_quantitative_reductions quantify structural BMPs]. | ||
| + | |||
| + | [https://www.pca.state.mn.us/business-with-us/total-maximum-daily-load-tmdl-projects TMDL reports] provide maps and acreages for TMDL study areas. Shapefiles of TMDL study areas can be found at [https://stormwater.pca.state.mn.us/index.php?title=Additional_resources_for_completing_the_TMDL_form#Link_to_TMDL_GIS_Shapefiles link]. Part II.3.a of the Phase I MS4 permits requires permittees to develop maps showing locations of structural BMPs, so this information should already exist. By overlaying the TMDL study areas on the map containing structural BMPs, permittees can determine which BMPs can be applied to specific TMDLs. For BMPs and activities that are not mapped, permittees will have to determine if the BMP or activity treats discharge in a particular TMDL study area and can be applied to that TMDL. | ||
| + | |||
| + | The subsequent sections demonstrate how to take BMP information and translate it to the TMDL form. | ||
==Scenario 1: Metro Watershed WRAPS== | ==Scenario 1: Metro Watershed WRAPS== | ||
| − | [[file:ReportingEx1.png| | + | [[file:ReportingEx1.png|thumb|left|alt=screen shot of ReportingEx1|<font size=3>Map 1, showing the location of structural BMPs that require estimated reductions in pollutant loading ([http://stormwater.pca.state.mn.us/index.php/Phase_I_MS4_Guidance_for_completing_the_TMDL_Annual_report_form#Category_1_-_Summary_of_quantitative_reductions Category 1 BMPs])</font size>]] |
| + | |||
| + | [[file:ReportingEx2.png|thumb|alt=screen shot of ReportingEx1|<font size=3>Map 2, showing the location of non-structural BMPs that do not require estimated reductions in pollutant loading ([http://stormwater.pca.state.mn.us/index.php/Phase_I_MS4_Guidance_for_completing_the_TMDL_Annual_report_form#Category_2._Number_of_BMPs_implemented Category 2 BMPs])</font size>]] | ||
| − | This example set uses | + | This example set uses Maps 1 and 2, which appear on the left and right hand side of the page. Each map covers the same area and the same TMDLs. Map 1 depicts BMPs that require estimated cumulative reductions ([http://stormwater.pca.state.mn.us/index.php/Phase_I_MS4_Guidance_for_completing_the_TMDL_Annual_report_form#Category_1_-_Summary_of_quantitative_reductions Category 1 BMPs]) and Map 2 depicts BMPs that do not ([http://stormwater.pca.state.mn.us/index.php/Phase_I_MS4_Guidance_for_completing_the_TMDL_Annual_report_form#Category_2._Number_of_BMPs_implemented Category 2 BMPs]). See [[Phase I MS4 Guidance for completing the TMDL Annual report form#Cumulative reductions worksheet|cumulative reductions]] section for more information. Additional Category 2 BMPs that cannot be mapped as points, such as education and street sweeping, are not shown on the maps but are included in examples to show where such BMPs are reported in the form. |
| − | The example covers a | + | The example covers a theoretical Twin Cities Metro Area TMDL called the ''Metro Watershed WRAPS'', with four MS4 permittees (City A, City B, City C, and MS4 College) and four impaired waters. The following TMDLs have been completed to address the impairments: |
*Lake 1: Phosphorus | *Lake 1: Phosphorus | ||
*Lake 2: Phosphorus | *Lake 2: Phosphorus | ||
| Line 21: | Line 29: | ||
*Metro Watershed WRAPS: E. coli (Stream 1) | *Metro Watershed WRAPS: E. coli (Stream 1) | ||
| − | {{alert|Note: For the | + | {{alert|Note: For the examples, we assume the baseline year for each of the five TMDLs is 2010.|alert-info}} |
| − | + | <!-- | |
{{alert|In the Annual Report Form, TMDL WLAs are expressed differently depending on the type of receiving water. | {{alert|In the Annual Report Form, TMDL WLAs are expressed differently depending on the type of receiving water. | ||
*Lake TMDLs: Will be labeled by Waterbody + Pollutant. The title of the TMDL Project will therefore not be captured. | *Lake TMDLs: Will be labeled by Waterbody + Pollutant. The title of the TMDL Project will therefore not be captured. | ||
*Stream TMDLs: For ease of reporting, the Permittee is allowed to report on groupings of WLAs within the same report. Stream TMDLs will therefore be labeled by TMDL Project Name + Pollutant. For example, if the Permittee has TSS WLAs on four stream reaches in a single project, these will be grouped into one TMDL to report on. If the Permittee has been assigned WLAs for bacteria (whether they are expressed as fecal coliform or E. Coli) on the same four stream reaches in the same project, the Permittee would have two TMDLs to report on. Note that a Permittee may request to have the form customized to allow for individual reach reporting, however, the grouping convention will be the default.|alert-info}} | *Stream TMDLs: For ease of reporting, the Permittee is allowed to report on groupings of WLAs within the same report. Stream TMDLs will therefore be labeled by TMDL Project Name + Pollutant. For example, if the Permittee has TSS WLAs on four stream reaches in a single project, these will be grouped into one TMDL to report on. If the Permittee has been assigned WLAs for bacteria (whether they are expressed as fecal coliform or E. Coli) on the same four stream reaches in the same project, the Permittee would have two TMDLs to report on. Note that a Permittee may request to have the form customized to allow for individual reach reporting, however, the grouping convention will be the default.|alert-info}} | ||
| + | --> | ||
| + | ===BMP-Activities completed worksheet=== | ||
| + | In this section of the TMDL form, permittees provide information on all completed BMP/activities that result in a reduction in pollutant loading that applies to an approved TMDL WLA. | ||
| − | |||
| − | |||
| − | |||
====City A==== | ====City A==== | ||
| − | City A has been assigned | + | [[File:Table1.png|thumb|left|alt=table showing BMPs City A implemented|<font size =3>A table is one way City A might organize information on BMP/activities they have implemented toward reducing pollutant loads for TMDLs.<br> |
| + | <font size=1>a</font size> <font size=2>INF1 and MD2 were constructed as a joint project between City A and City B</font size><br> | ||
| + | <font size=1>b</font size> <font size=2>These BMPs do not appear on the maps because they are not associated with a discrete location</font size><br> | ||
| + | <font size=1>c</font size> <font size=2>SR1 is owned by MS4 College, but City A contributes to maintenance (note that shared responsibility of maintenance can constitute a partnership between MS4s but continued maintenance of BMPs is a core permit requirement and cannot be used to demonstrate progress on a yearly basis)</font size> | ||
| + | </font size>]] | ||
| + | |||
| + | In this example we included information for a second year of reporting (2015) and a theoretical compliance schedule submitted by City A at the time of application. | ||
| + | |||
| + | City A has been assigned WLAs for three TMDLs included in the Metro Watershed WRAPS project. | ||
*Lake 1: Phosphorus | *Lake 1: Phosphorus | ||
*Lake 2: Phosphorus | *Lake 2: Phosphorus | ||
*Lake 3: Phosphorus | *Lake 3: Phosphorus | ||
| − | As noted in the previous section, the baseline year for each TMDL is 2010. Since the baseline, City A has implemented 14 | + | As noted in the previous section, the baseline year for each TMDL is 2010. Since the baseline, City A has implemented 14 BMPs and activities that can be credited as progress toward achieving one or more applicable WLA. The table to the left illustrates to which TMDL and Category each BMP can be credited. See Map 1 for location of Category 1 BMPs and Map 2 for location of Category 2 BMPs (location information for Category 2 BMPs is not required for TMDL reporting but is included for purposes of the example). There are four BMPs (employee education, establish ordinance, public education, and street sweeping) listed under Category 2 that are not located on maps because they cannot be associated with a single point within the watershed (i.e. they are applied over broad areas). One Category 3 BMP, a feasibility study for a rain garden retrofit, is listed in the table but will not be included in the ''BMP-Activities completed'' tab. Category 3 BMPs constitute progress, which meets the permit requirement for a given year, but cannot be associated with a reduction in pollutant loading. These activities will remain in the [[Examples for completing the TMDL reporting form#Category 3 BMPs-Activities worksheet|Category 3 BMPs-Activities worksheet]] for the duration of the permit term. |
| − | + | [[file:Figure1.png|thumb|alt=schematic showing how information for one BMP, in this case INF1, would be input to the TMDL form by City A|<font size=3>Schematic showing how information for one BMP, in this case INF1, would be input to the TMDL form by City A. Click on image for full sized version of the image.</font size>]] | |
| − | + | The schematic to the right illustrates how data are entered for one BMP, INF1 (see Map 1 for location of INF1). The first entry is the Reporting Year, which is selected from a dropdown list in Column D. For this example, the permittee selects 2014. Cells A through C are autofilled once the reporting year is selected. The permittee then enters data in Columns E through M (Column F is optional). Because INF1 is a structural BMP, the geographic coordinates (x and y location coordinates) must be entered as well as the type of coordinate system used. Columns N and O are optional. Once the information for INF1 is entered, the permittee selects '''all the TMDLs''' to which the BMP is applied. This starts in Column Q. Once completed, the permittee moves on to the next row where the next BMP and associated information are entered. City A would continue this process until all 14 BMPs have been translated to the ''BMP-Activites completed'' worksheet. | |
| − | + | When completed, City A's ''BMP-Activites completed'' worksheet for 2014 may look similar to the following screenshot. | |
| − | <font size=1 | + | [[file:CityAannualReport.png|1000px|thumb|alt=screenshot of completed BMP-activities tab|<font size=3>Screen shot of City A's ''BMP-activities completed'' worksheet for the 2014 Annual Report. The worksheet includes 6 Category 1 BMPs (depicted on Map 1), 4 Category 2 BMPs (depicted on Map 2), and 4 Category BMPs not depicted on a map. Note the 4 Category 2 BMPs not depicted on a map are applied across the entire city and can therefore be applied toward each of the three TMDLs.</font size>]] |
| − | + | For purposes of this example, assume the screenshot below is the compliance schedule submitted by City A at the time of application. Two of the three BMPs with a 2014 implementation date appear in the ''BMP-Activities completed'' worksheet to the right for the first reporting year. The third BMP, the "Raingarden retrofit assessment", will remain in the ''Category 3 BMPs-Activities'' worksheet for the duration of the permit term. See the [[Phase I MS4 Guidance for completing the TMDL Annual report form#Category 3. Non-implemented Activities (Reported in Category 3 BMPs - Activities tab)|Category 3]] section of the guidance for the definition of a Category 3 activity. | |
| − | ''' | + | [[file:CityAcomplianceSchedule.png|1000px|thumb|alt=screen shot of City A compliance schedule|<font size=3>Screen shot of City A's compliance schedule submitted at the time of permit application. All BMPs listed in this spreadsheet must be included in the ''Category 3 BMPs-Activities'' worksheet until the reporting year in which it was fully implemented. At that time, the BMP will be translated to the ''BMP-activities completed'' worksheet. Note that BMPs fully implemented in the first annual reporting year (2014) and that achieve a reduction in pollutant loading (Category 1 and Category 2 BMPs), do not appear in the ''Category 3 BMPs-Activities'' worksheet.</font size>]] |
| − | |||
| − | [[ | + | For this example, assume the screenshot below illustrates what City A's ''BMP-Activities completed'' worksheet looks like in 2015. The highlighted record is the only BMP added to the worksheet because it was the only BMP fully implemented by City A in 2015. This BMP was included in the permittee's compliance schedule as "Implement raingarden retrofit". Note this BMP was scheduled for implementation in 2015 and is a retrofit of an existing BMP (INF1). The BMP was reported in the ''Category 3 BMPs-Activities'' worksheet for the 2014 Annual Report but was completed in 2015, and therefore translated to the ''BMP-Activities completed'' worksheet in the 2015 Annual Report. See the [[Examples for completing the TMDL reporting form#Category 3 BMPs-Activities worksheet|Category 3 BMPs-Activities worksheet]] section of this document for screen shot examples. |
| − | + | No record should be altered from a previous reporting year. Thus, the entry for INF4 will not be modified. The "BMP improvement enhancement retrofitting" category from the dropdown list in Column E, accompanied by an explanation in Column O, will be sufficient since this is not a new BMP but instead an enhancement of an existing BMP. If a unique situation presents itself, contact MPCA Stormwater staff for further guidance. | |
| − | [[file:BMP | + | [[file:CityAannualReport2015.png|1000px|thumb|alt=screenshot of BMP-activities completed tab for the year 2015|<font size=3>Screen shot of City A's ''BMP-activities completed'' worksheet for the 2015 Annual Report. Note that only one BMP was added. This BMP was an enhancement of an existing BMP (INF1). The original entry for INF1 is not modified; instead, the retrofit is included as a new BMP for the 2015 reporting year.</font size>]] |
====City B==== | ====City B==== | ||
| − | City B has been assigned | + | [[file:Table2.png|300px|thumb|alt=schematic of table with BMps for City B|<font size=3>Summary of BMP/activities City B has implemented toward reducing pollutant loads for TMDLs. Note that all four BMP/activities belong to Category 2. FIL1, which is a structural BMP, cannot be claimed as a Category 1 BMP because it is within the jurisdiction of another regulated MS4 (MS4 College). BMPs marked with the superscript <sup>a</sup> do not appear on the maps because they are not associated with a discrete location.</font size>]] |
| + | |||
| + | City B has been assigned WLAs for two TMDLs in the Metro Watershed WRAPS project: | ||
*Lake 1: Phosphorus | *Lake 1: Phosphorus | ||
*Lake 2: Phosphorus | *Lake 2: Phosphorus | ||
| − | Since the baseline of the | + | Since the baseline of the TMDLs (2010), City B has implemented four BMP/Activities that can be credited as progress toward achieving an applicable WLA. As depicted on Map 1, no structural BMPs are constructed within City B's jurisdiction. City B has collaborated with other MS4 permittees on the following projects: |
| − | * | + | *provided funding to MS4 College on FIL1 for the Lake 1: Phosphorus TMDL; and |
| − | * | + | *shares responsibility with City A for maintenance of MD2. |
| − | City B may also record their supplemental street sweeping program because they do sweeping within the Lake 1 and Lake 2 watersheds. | + | City B may also record their supplemental street sweeping program because they do sweeping within the Lake 1 and Lake 2 watersheds. They may also take credit for eliminating an illicit discharge. Note that all these BMPs/activities must have been implemented since 2010, the baseline year. For example, street sweeping may have been implemented prior to 2010, but enhancements to the existing street sweeping program would qualify as a Category 2 BMP. |
| − | + | All BMPs implemented by City B are recorded as a Category 2 reduction unless the permittee can reasonably demonstrate an appropriate method for quantifying it in Category 1. | |
| − | + | The permittee enters information for each of the four BMPs/activities as described above for City A. The screenshot below is an example of how the ''BMP-Activities completed'' worksheet may look when complete. | |
| − | + | [[file:CityBannualReport.png|1000px|thumb|alt=screenshot of completed worksheet for City B|<font size=3>Screen shot of City B's ''BMP-activities completed'' worksheet for the 2014 Annual Report. Note in rows 4 and 6, columns L and M, that partnerships with the MS4 College and City A are indicated.]] | |
| − | + | ====City C==== | |
| + | [[file:Table3.png|300px|thumb|alt=schematic of table showing BMPs implemented by City C|<font size=3>Summary of BMP/activities City C has implemented toward reducing pollutant loads for TMDLs.</font size>]] | ||
| − | + | <small>City C has been assigned WLAs for all five TMDLs included in the Metro Watershed WRAPS project: | |
| − | City C has been assigned | ||
*Lake 1: Phosphorus | *Lake 1: Phosphorus | ||
*Lake 2: Phosphorus | *Lake 2: Phosphorus | ||
| Line 84: | Line 101: | ||
*Metro Watershed WRAPS: E. coli (Stream 1) | *Metro Watershed WRAPS: E. coli (Stream 1) | ||
| − | Since the baseline of the | + | Since the baseline of the TMDLs (2010), City C has implemented 11 BMPs that can be credited as progress toward achieving an applicable WLA. These are summarized in the table below. Note that several BMPs are applied to more than one TMDL (e.g. the swale, S2, is applied to the Lake 3 TMDL and the two stream impairments). As with City A and City B, City C implements some BMPs that cover their entire jurisdictional area (e.g. employee education) and these BMPs can be applied to all five WLAs. |
| − | + | ||
| − | [[file: | + | In this example, Maps 1 and 2 do not show the watershed boundaries for the impaired stream. The City will have to determine those boundaries prior to determining if BMPs can be applied to the stream impairments. The City must also determine if a particular BMP will actually reduce pollutant loads. For example, swales are typically ineffective at removing bacteria but the swale included in the worksheet may have been designed such that bacteria will be removed. However, if that is not the case, the BMP should not be applied to the bacteria TMDL. |
| + | |||
| + | The screenshot below is an example of how the ''BMP-Activities completed'' worksheet may look when complete. | ||
| + | |||
| + | [[file:CityCannualReport.png|thumb|1000px|alt=screen shot of BMP-activities tab for City C|<font size=3>Screen shot of City C's ''BMP-activities completed'' worksheet for the 2014 Annual Report. Note that several BMPs and activities apply to multiple TMDL WLAs.</font size>]] | ||
====MS4 College==== | ====MS4 College==== | ||
| − | MS4 College has been assigned WLA for one | + | [[file:Table4.png|300px|thumb|alt=summary of BMPs implemented by MS4 College|<font size=3>Summary of BMP/activities MS4 College has implemented toward reducing pollutant loads for TMDLs. SR1 is owned by MS4 College, but City A contributes to maintenance. City A therefore also claims this as a Category 2 credit. Similarly, City B contributed funding to INF1 and thus claimed a Category 2 credit on their form.</font size>]] |
| + | |||
| + | MS4 College has been assigned a WLA for one TMDL included in the Metro Watershed WRAPS project: | ||
*Lake 1: Phosphorus | *Lake 1: Phosphorus | ||
| − | Since the baseline of the TMDL, MS4 College has implemented | + | Since the baseline of the TMDL (2010), MS4 College has implemented 5 BMPs that can be credited as progress toward achieving an applicable WLA. The table below illustrates to which category each BMP/activity is applicable. Note that MS4 College is located entirely within the jurisdiction of City A. This provides a unique partnership opportunity for the two MS4 permittees. As a result, the two have an agreement in place for City A to perform street sweeping on campus. Each permittee can therefore claim a Category 2 credit. MS4 College, however, indicates on its form that City A is the owner/operator of this BMP. |
| − | + | BMP FIL1 is owned and operated by MS4 College. City B claimed a category 2 credit for this BMP because it contributed funding for the BMP, but only MS4 College can claim this as a Category 1 BMP because it occurs within their jurisdiction. | |
| − | + | The screenshot below is an example of how the ''BMP-Activities completed'' worksheet may look when complete. | |
| + | |||
| + | [[file:MS4annualReport.png|1000px|thumb|alt=screen shot of BMP-activities tab for MS4 College|<font size=3>Screen shot of MS4 College's ''BMP-activities completed'' worksheet for the 2014 Annual Report.</font size>]] | ||
===Cumulative reductions worksheet=== | ===Cumulative reductions worksheet=== | ||
| − | This is the portion of the TMDL report form that the permittee will report | + | This is the portion of the TMDL report form that the permittee will report the cumulative reduction achieved for each TMDL WLA. See the [http://stormwater.pca.state.mn.us/index.php/Phase_I_MS4_Guidance_for_completing_the_TMDL_Annual_report_form#Cumulative_reductions_worksheet cumulative reductions] section of the guidance for information on each of the reporting categories. |
| + | |||
| + | {{alert|Though not required to be provided with each annual report, MS4 permittees are strongly advised to keep detailed records on production of Category 1 reductions (methodology, input values, etc.). |alert-info}} | ||
====City A==== | ====City A==== | ||
| − | [[file: | + | The lower portion of the screenshot below illustrates how City A's ''Cumulative reductions'' worksheet should look for 2014 Annual Report. City A chose to estimate load reductions using the MPCA estimator. Details for how this tool was used can be found in the [[Guidance and examples for using the MPCA Estimator|guidance and examples for using the MPCA Simple Estimator]]. |
| + | |||
| + | [[file:CityAannualReport3.png|1000px|thumb|alt=screen shot of MPCA estimator with cumulative reductions worksheet|<font size=3>Screen shot of MPCA estimator calculations and ''Cumulative reductions'' worksheet for City A's 2014 Annual Report.</font size>]] | ||
| + | |||
| + | The following screenshot is an example of City A's 2015 ''Cumulative reductions'' worksheet submission. It is very similar to what was submitted for 2014 because only one BMP was fully implemented, that being the retrofit of INF1. This record was labeled as "Implement raingarden retrofit" in the 2014 ''Category 3 BMPs-Activities'' worksheet (row 4) and has been translated to the ''BMP-Activities completed'' worksheet in the 2015 Annual Report to show that the BMP has been fully implemented. The update is also reflected in the ''Category 3 BMP-Activities'' worksheet. See the [[Examples for completing the TMDL reporting form#Category 3 BMPs-Activities worksheet|Category 3 BMPs-Activities worksheet]] section of this document for screen shot examples. | ||
| + | |||
| + | Because the implemented retrofit improved the pollutant reduction capability of an existing structural BMP, INF1, it can be quantified in Category 1. Prior to the retrofit, INF1 treated 2 acres of land classified as ''Residential-medium density'' (see MPCA estimator screen shot). Assuming the INF1 retrofit doubled the ''Residential-medium density'' land area treated (2 acres treated by INF1 in 2014; 4 treated by INF1 in 2015 after completed retrofit), the cumulative reduction reported in 2015 for the Lake 2: Phosphorus TMDL would increase from 2.004 pounds to 4.008 pounds. | ||
| + | |||
| + | [[file:CityAannualReport2015(2).png|1000px|thumb|alt=screen shot of 2015 cumulative reductions worksheet|<font size=3>Screen shot of City A's ''Cumulative reductions'' worksheet for the 2015 Annual Report.</font size>]] | ||
====City B==== | ====City B==== | ||
| + | City B had implemented no structural BMPs within its jurisdiction from the baseline to the first year of reporting. All reductions are therefore reported as Category 2 and would appear as follows in the screenshot below. | ||
| + | |||
| + | [[file:CityBannualReport2.png|1000px|thumb|alt=screen shot of 2014 cumulative reductions worksheet|<font size=3>Screen shot of City B's ''Cumulative reductions'' worksheet for the 2014 Annual Report.</font size>]] | ||
| + | |||
| + | |||
====City C==== | ====City C==== | ||
| + | City C had implemented a variety of BMPs from the baseline of the TMDL to the first year of reporting. Similar to City A, reductions have been reported in both Category 1 and 2. Category 1 reductions were calculated using the MPCA estimator and examples of its use can be found in the [[Guidance and examples for using the MPCA Estimator|guidance and examples for using the MPCA Simple Estimator]]. | ||
| + | |||
| + | [[file:CityCannualReport2.png|1000px|thumb|alt=screen shot of 2014 cumulative reductions worksheet|<font size=3>Screen shot of City C's ''Cumulative reductions'' worksheet for the 2014 Annual Report.</font size>]] | ||
| + | |||
| + | |||
====MS4 College==== | ====MS4 College==== | ||
| + | MS4 College had implemented a variety of BMPs from the baseline of the TMDL to the first year of reporting. Reductions have therefore been reported in both Category 1 and 2. Category 1 reductions were calculated using the MPCA estimator and examples of its use can be found in the [[Guidance and examples for using the MPCA Estimator|guidance and examples for using the MPCA Simple Estimator]]. | ||
| + | |||
| + | [[file:MS4annualReport2.png|1000px|thumb|alt=screen shot of 2014 cumulative reductions worksheet|<font size=3>Screen shot of MS4 College's ''Cumulative reductions'' worksheet for the 2014 Annual Report.</font size>]] | ||
| + | |||
| + | ===Category 3 BMPs-Activities worksheet=== | ||
| + | This is the portion of the TMDL form that must contain planned BMPs that have not yet been implemented but were submitted as a part of the compliance schedule in the MS4 Permit TMDL Attachment spreadsheet at the time of application. This worksheet will also store records that constitute progress but do not achieve a reduction (e.g. planning, feasibility studies, acquisition of funding, etc.). The subsequent section will only cover an example for City A. | ||
| + | |||
| + | ====City A==== | ||
| + | The screen shot below illustrates the ''Category 3 BMPs-Activites'' worksheet for 2014. This contains all but two of the BMPs ("Permeable pavement with no underdrain" and "Increased street sweeping") from the compliance schedule screen shot in the ''BMP-Actvities completed'' section for City A. Those BMPs have been reported in the ''BMP-Activities completed'' worksheet because they were fully implemented in 2014. You will notice that one activity ("Feasibility study - Raingarden retrofit assessment") fully implemented in 2014 remains in the ''Category 3 BMPs-Activites'' worksheet. This is because it does not receive credit for a reduction in pollutant loading but does demonstrate that the permittee is making progress. | ||
| + | |||
| + | The following screen shot illustrates the ''Category 3 BMPs-Activites'' worksheet for the 2015 Annual Report. This submission will contain all the BMPs from the 2014 Annual Report except for the highlighted record ("Implement raingarden retrofit"). This has now been translated to the ''BMP-Activities completed'' worksheet because it was fully implemented in 2015 (see the screen shot of City A's BMP-activities completed worksheet for the 2015 Annual Report). This process will continue each year of the permit term as BMPs/activities are completed. | ||
| + | |||
| + | [[file:CityAcategory3-2014.png|1000px|thumb|alt = Category 3|Screen shot of City A's ''Category 3 BMPs-Activites'' worksheet for the 2014 Annual Report.]] | ||
| + | |||
| + | [[file:CityAcategory3-2015.png|1000px|thumb|alt = Category 3|Screen shot of City A's ''Category 3 BMPs-Activites'' worksheet for the 2015 Annual Report.]] | ||
===Adaptive management worksheet=== | ===Adaptive management worksheet=== | ||
| + | Refer to the [[Phase I MS4 Guidance for completing the TMDL Annual report form#Adaptive Management Strategy tab|Adaptive Management Strategy]] section of the guidance for an example on how to fill out this portion of TMDL form. | ||
==Scenario 2: Big River TMDL== | ==Scenario 2: Big River TMDL== | ||
| − | [[file:ReportingEx3.png|300px|thumb|alt=screen shot of ReportingEx3|<font size=3>Map 3 - Structural BMPs</font size>]][[file:ReportingEx4.png|300px|thumb|alt=screen shot of ReportingEx4|<font size=3>Map 4 - AUIDs</font size>]] | + | [[file:ReportingEx3.png|300px|thumb|left|alt=screen shot of ReportingEx3|<font size=3>Map 3 - Structural BMPs</font size>]][[file:ReportingEx4.png|300px|thumb|alt=screen shot of ReportingEx4|<font size=3>Map 4 - AUIDs</font size>]] |
| − | + | The following example covers a theoretical outstate area TMDL, the Big River TMDL, with one MS4 Permittee (City D). Maps 3 and 4 will be used to aid the discussion. Each map covers the same area, all of which is within the jurisdictional boundary of City D. Map 3 depicts structural BMPs and Map 4 depicts the six AUIDs (Assessment Unit ID, or different stream reaches) TMDLs have been completed on. | |
| − | The example | + | As you may know, stream TMDLs use a Load Duration Curve (LDC) approach. The result is WLAs assigned to MS4s across five flow regimes (High, moist, mid-range, dry, low), which in this example, would equate to 30 total TSS WLAs and 30 total E. coli WLAs. Permittees are not required however, to report on each individual flow regime. For ease of reporting, the Permittee is allowed to report on groupings of WLAs within the same report. Stream TMDLs will therefore be represented according to TMDL Project Name + Pollutant by default. In this example, City D has been assigned TSS and E. coli WLAs for each of the six stream reaches (AUIDs) in the Big River TMDL project (6 TSS TMDLs and 6 E.coli TMDLs). These will be grouped into two TMDL WLAs to report on: |
*Big River TMDL: TSS | *Big River TMDL: TSS | ||
*Big River TMDL: E. coli | *Big River TMDL: E. coli | ||
| − | {{alert|Note: For the sake of the example, we will assume the baseline year for each of the | + | {{alert|Note: For the sake of the example, we will assume the baseline year for each of the TMDLs is 2005.|alert-info}} |
| − | |||
| − | |||
| − | |||
===BMP-Activities completed worksheet=== | ===BMP-Activities completed worksheet=== | ||
| + | This is the portion of the TMDL report form that the permittee will provide information on all BMPs being applied to a TMDL WLA/s. | ||
| + | |||
====City D==== | ====City D==== | ||
| + | [[file:Table5.png|thumb|300px|alt=summary of BMPs and activities implemented by City D|<font size=3>Summary of BMP/activities City D has implemented toward reducing pollutant loads for TMDLs..</font size>]] | ||
| + | |||
| + | As mentioned previously, City D has been assigned WLA for TSS and E. coli TMDLs on all six of the impaired stream reaches included in the Big River TMDL. As a result of the grouping approach, the reporting requirement is as follows: | ||
| + | *Big River TMDL: TSS | ||
| + | *Big River TMDL: E. coli | ||
| + | |||
| + | Since the baseline of the TMDL (2005), City D has implemented 11 BMPs that can be credited as progress toward achieving an applicable WLA. The table below illustrates which TMDL each BMP can be credited to and in what category. All BMPs are implemented within the Big River TMDL study area. Per the grouping approach, all BMPs are applied to all stream reaches so long as the BMP addresses the pollutant of concern. The following screen shot is an example of how the ''BMP-Activities completed'' worksheet may look when complete. | ||
| + | |||
| + | [[file:CityDannualReport.png|1000px|thumb|alt=screen shot of bmp-activities tab for City D|<font size=3>Screen shot of City D's ''BMPs-activities completed'' worksheet for the 2014 Annual Report.</font size>]] | ||
| + | |||
===Cumulative reductions worksheet=== | ===Cumulative reductions worksheet=== | ||
| + | This is the portion of the TMDL report form that the permittee will report the cumulative reduction achieved for each TMDL WLA. See the [[Phase I MS4 Guidance for completing the TMDL Annual report form#Cumulative reductions tab|cumulative reductions]] section of the guidance for information on each of the reporting categories. | ||
| + | |||
| + | {{alert|Though not required to be provided with each annual report, MS4 permittees are strongly advised to keep detailed records on production of Category 1 reductions (methodology, input values, etc.). |alert-info}} | ||
| + | |||
====City D==== | ====City D==== | ||
| + | [[file:CityDannualReport3.png|500px|thumb|alt=screen shot of tss and e. coli reduction calculations with associated cumulative reductions worksheet.|<font size=3>Screen shot of TSS and E. coli reduction calculations with associated ''Cumulative reductions'' worksheet for City D's 2014 Annual Report.</font size>]] | ||
| + | |||
| + | City D used the MIDS calculator to estimate TSS pollutant reductions associated with implemented BMPs. The following model inputs and assumptions were used in the MIDS calculator. | ||
| + | *3000 acre watershed, consisting of 1000 acres of forest/open space, 1000 acres of managed turf, and 1000 acres of impervious surface | ||
| + | *Annual rainfall of 31.9 inches | ||
| + | *Average TSS concentration of 54.5 mg/L | ||
| + | *B (SM) soils (design infiltration rate of 0.45 inches per hour) | ||
| + | *The two infiltration BMPs (INF5 and INF6) were combined into a single BMP designed to exactly treat the MIDS performance goal of 1.1 inches of new or redeveloped impervious surfaces | ||
| + | *The two filters (FIL4 and FIL5) were combined into a single BMP that treated 20 acres of impervious surface | ||
| + | *The constructed pond was Design Level 2 and treated 20 acres of impervious surface | ||
| + | *The grass channel was treated as a wet swale treating 10 acres of impervious surface | ||
| + | *The level spreader was modeled as a main channel swale that treated 10 acres of impervious surface and exactly met the MIDS performance goal of 1.1 inches off new and redeveloped impervious surfaces | ||
| + | |||
| + | Total TSS reduction by the BMPs was 28331 pounds or 7% of the total load. | ||
| + | |||
| + | The MIDS calculator does not address E. coli. The following assumptions were made for bacteria removal by BMPs. | ||
| + | *For INF5, INF6, and the level spreader, bacteria removal was 100 percent for infiltrated water and 0 percent for non-infiltrated water | ||
| + | *For sand filters and the constructed pond, removal was 70 percent | ||
| + | *Removal for the grass channel was 0 percent | ||
| + | |||
| + | To estimate bacteria removal, the following steps were followed. | ||
| + | *Calculate total annual volume = 2823.15 acre-feet | ||
| + | *Calculate total annual bacteria load = 1.39E+12 | ||
| + | *Calculate total annual bacteria input to each BMP = Volume from direct watershed * bacteria concentration | ||
| + | *Calculate total annual bacteria reduction using the assumptions above | ||
| + | The annual reduction in bacteria loading associated with these BMPs is 5.47 percent. | ||
| + | |||
| + | The following tables summarize the calculations for each BMP, all BMPs combined, and resulting annual reduction expressed as a percent. | ||
| + | |||
===Adaptive management worksheet=== | ===Adaptive management worksheet=== | ||
| + | Refer to the [[Phase I MS4 Guidance for completing the TMDL Annual report form#Adaptive Management Strategy tab|Adaptive Management Strategy]] section of the guidance for an example on how to fill out this portion of TMDL form. | ||
| + | </small> | ||
| + | |||
| + | [[Category:Level 3 - Regulatory/Municipal (MS4)/TMDLs]] | ||
| + | [[Category:Level 2 - Regulatory/Municipal (MS4)]] | ||
| + | [[Category:Level 3 - Regulatory/Municipal (MS4)/Guidance, outreach materials, miscellaneous information]] | ||
Latest revision as of 15:54, 5 January 2023
This page provides step-by-step examples on how to fill out the four tabs in the Commissioner-approved Total Maximum Daily Load (TMDL) Form from the perspective of five fictional permittees. These are the BMP-Activites completed tab, the Cumulative reductions tab, the Category 3 BMPs- Activities tab, and the Adaptive management strategy tab. (Note: the terms "tab" and "worksheet" are used interchangeably.)
Permittees are not required to report on every Best Management Practice (BMP) or activity they have implemented, but instead just on those BMPs or activities that are being applied to applicable TMDL Wasteload Allocations (WLAs). Each BMP contained in the dropdown box of column E of the BMP-Activities completed tab will be covered in the examples. Please become familiar with the Phase I MS4 Guidance for completing the TMDL Annual report form or the quickguides (see [1] and [2]) before continuing on with the examples.
In order to complete the TMDL form, it is important that the permittee have a means to
- identify and list BMPs applicable to TMDL WLAs;
- define the watersheds of applicable TMDLs;
- determine which BMPs can be applied within each TMDL watershed; and
- quantify structural BMPs.
TMDL reports provide maps and acreages for TMDL study areas. Shapefiles of TMDL study areas can be found at link. Part II.3.a of the Phase I MS4 permits requires permittees to develop maps showing locations of structural BMPs, so this information should already exist. By overlaying the TMDL study areas on the map containing structural BMPs, permittees can determine which BMPs can be applied to specific TMDLs. For BMPs and activities that are not mapped, permittees will have to determine if the BMP or activity treats discharge in a particular TMDL study area and can be applied to that TMDL.
The subsequent sections demonstrate how to take BMP information and translate it to the TMDL form.
Scenario 1: Metro Watershed WRAPS
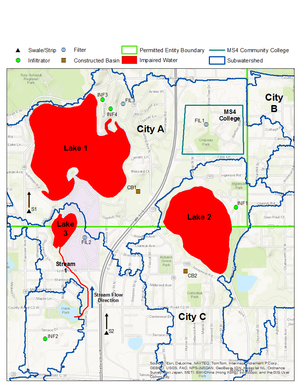
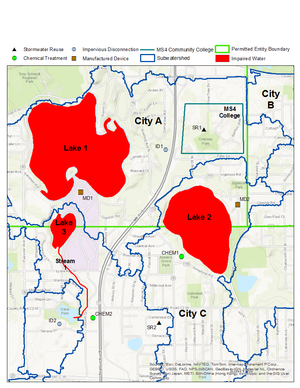
This example set uses Maps 1 and 2, which appear on the left and right hand side of the page. Each map covers the same area and the same TMDLs. Map 1 depicts BMPs that require estimated cumulative reductions (Category 1 BMPs) and Map 2 depicts BMPs that do not (Category 2 BMPs). See cumulative reductions section for more information. Additional Category 2 BMPs that cannot be mapped as points, such as education and street sweeping, are not shown on the maps but are included in examples to show where such BMPs are reported in the form.
The example covers a theoretical Twin Cities Metro Area TMDL called the Metro Watershed WRAPS, with four MS4 permittees (City A, City B, City C, and MS4 College) and four impaired waters. The following TMDLs have been completed to address the impairments:
- Lake 1: Phosphorus
- Lake 2: Phosphorus
- Lake 3: Phosphorus
- Metro Watershed WRAPS: TSS (Stream 1)
- Metro Watershed WRAPS: E. coli (Stream 1)
BMP-Activities completed worksheet
In this section of the TMDL form, permittees provide information on all completed BMP/activities that result in a reduction in pollutant loading that applies to an approved TMDL WLA.
City A
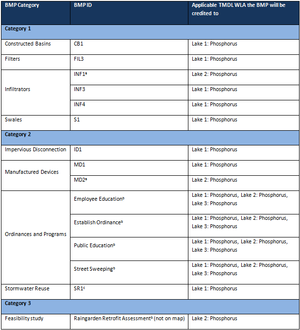
a INF1 and MD2 were constructed as a joint project between City A and City B
b These BMPs do not appear on the maps because they are not associated with a discrete location
c SR1 is owned by MS4 College, but City A contributes to maintenance (note that shared responsibility of maintenance can constitute a partnership between MS4s but continued maintenance of BMPs is a core permit requirement and cannot be used to demonstrate progress on a yearly basis)
In this example we included information for a second year of reporting (2015) and a theoretical compliance schedule submitted by City A at the time of application.
City A has been assigned WLAs for three TMDLs included in the Metro Watershed WRAPS project.
- Lake 1: Phosphorus
- Lake 2: Phosphorus
- Lake 3: Phosphorus
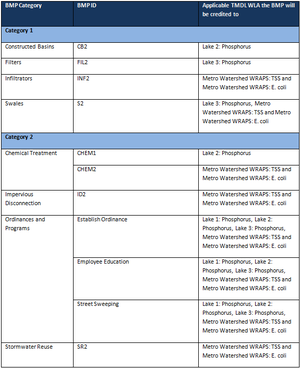
As noted in the previous section, the baseline year for each TMDL is 2010. Since the baseline, City A has implemented 14 BMPs and activities that can be credited as progress toward achieving one or more applicable WLA. The table to the left illustrates to which TMDL and Category each BMP can be credited. See Map 1 for location of Category 1 BMPs and Map 2 for location of Category 2 BMPs (location information for Category 2 BMPs is not required for TMDL reporting but is included for purposes of the example). There are four BMPs (employee education, establish ordinance, public education, and street sweeping) listed under Category 2 that are not located on maps because they cannot be associated with a single point within the watershed (i.e. they are applied over broad areas). One Category 3 BMP, a feasibility study for a rain garden retrofit, is listed in the table but will not be included in the BMP-Activities completed tab. Category 3 BMPs constitute progress, which meets the permit requirement for a given year, but cannot be associated with a reduction in pollutant loading. These activities will remain in the Category 3 BMPs-Activities worksheet for the duration of the permit term.
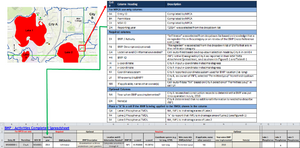
The schematic to the right illustrates how data are entered for one BMP, INF1 (see Map 1 for location of INF1). The first entry is the Reporting Year, which is selected from a dropdown list in Column D. For this example, the permittee selects 2014. Cells A through C are autofilled once the reporting year is selected. The permittee then enters data in Columns E through M (Column F is optional). Because INF1 is a structural BMP, the geographic coordinates (x and y location coordinates) must be entered as well as the type of coordinate system used. Columns N and O are optional. Once the information for INF1 is entered, the permittee selects all the TMDLs to which the BMP is applied. This starts in Column Q. Once completed, the permittee moves on to the next row where the next BMP and associated information are entered. City A would continue this process until all 14 BMPs have been translated to the BMP-Activites completed worksheet.
When completed, City A's BMP-Activites completed worksheet for 2014 may look similar to the following screenshot.

For purposes of this example, assume the screenshot below is the compliance schedule submitted by City A at the time of application. Two of the three BMPs with a 2014 implementation date appear in the BMP-Activities completed worksheet to the right for the first reporting year. The third BMP, the "Raingarden retrofit assessment", will remain in the Category 3 BMPs-Activities worksheet for the duration of the permit term. See the Category 3 section of the guidance for the definition of a Category 3 activity.
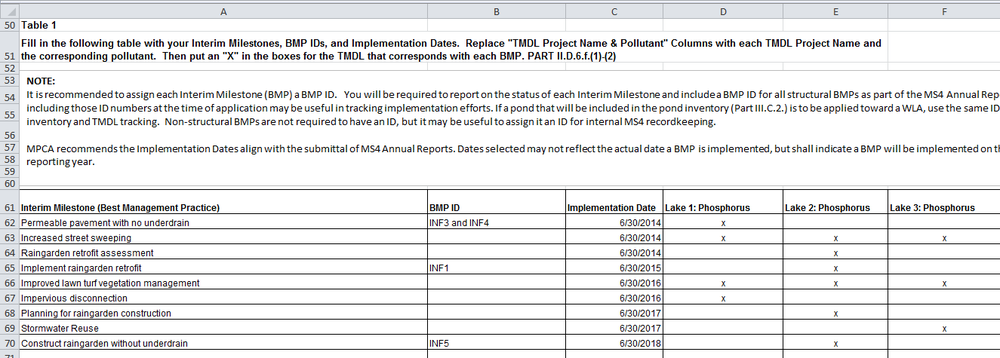
For this example, assume the screenshot below illustrates what City A's BMP-Activities completed worksheet looks like in 2015. The highlighted record is the only BMP added to the worksheet because it was the only BMP fully implemented by City A in 2015. This BMP was included in the permittee's compliance schedule as "Implement raingarden retrofit". Note this BMP was scheduled for implementation in 2015 and is a retrofit of an existing BMP (INF1). The BMP was reported in the Category 3 BMPs-Activities worksheet for the 2014 Annual Report but was completed in 2015, and therefore translated to the BMP-Activities completed worksheet in the 2015 Annual Report. See the Category 3 BMPs-Activities worksheet section of this document for screen shot examples.
No record should be altered from a previous reporting year. Thus, the entry for INF4 will not be modified. The "BMP improvement enhancement retrofitting" category from the dropdown list in Column E, accompanied by an explanation in Column O, will be sufficient since this is not a new BMP but instead an enhancement of an existing BMP. If a unique situation presents itself, contact MPCA Stormwater staff for further guidance.
City B
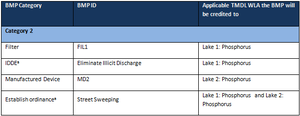
City B has been assigned WLAs for two TMDLs in the Metro Watershed WRAPS project:
- Lake 1: Phosphorus
- Lake 2: Phosphorus
Since the baseline of the TMDLs (2010), City B has implemented four BMP/Activities that can be credited as progress toward achieving an applicable WLA. As depicted on Map 1, no structural BMPs are constructed within City B's jurisdiction. City B has collaborated with other MS4 permittees on the following projects:
- provided funding to MS4 College on FIL1 for the Lake 1: Phosphorus TMDL; and
- shares responsibility with City A for maintenance of MD2.
City B may also record their supplemental street sweeping program because they do sweeping within the Lake 1 and Lake 2 watersheds. They may also take credit for eliminating an illicit discharge. Note that all these BMPs/activities must have been implemented since 2010, the baseline year. For example, street sweeping may have been implemented prior to 2010, but enhancements to the existing street sweeping program would qualify as a Category 2 BMP.
All BMPs implemented by City B are recorded as a Category 2 reduction unless the permittee can reasonably demonstrate an appropriate method for quantifying it in Category 1.
The permittee enters information for each of the four BMPs/activities as described above for City A. The screenshot below is an example of how the BMP-Activities completed worksheet may look when complete.
City C
City C has been assigned WLAs for all five TMDLs included in the Metro Watershed WRAPS project:
- Lake 1: Phosphorus
- Lake 2: Phosphorus
- Lake 3: Phosphorus
- Metro Watershed WRAPS: TSS (Stream 1)
- Metro Watershed WRAPS: E. coli (Stream 1)
Since the baseline of the TMDLs (2010), City C has implemented 11 BMPs that can be credited as progress toward achieving an applicable WLA. These are summarized in the table below. Note that several BMPs are applied to more than one TMDL (e.g. the swale, S2, is applied to the Lake 3 TMDL and the two stream impairments). As with City A and City B, City C implements some BMPs that cover their entire jurisdictional area (e.g. employee education) and these BMPs can be applied to all five WLAs.
In this example, Maps 1 and 2 do not show the watershed boundaries for the impaired stream. The City will have to determine those boundaries prior to determining if BMPs can be applied to the stream impairments. The City must also determine if a particular BMP will actually reduce pollutant loads. For example, swales are typically ineffective at removing bacteria but the swale included in the worksheet may have been designed such that bacteria will be removed. However, if that is not the case, the BMP should not be applied to the bacteria TMDL.
The screenshot below is an example of how the BMP-Activities completed worksheet may look when complete.
MS4 College
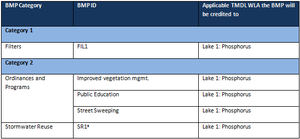
MS4 College has been assigned a WLA for one TMDL included in the Metro Watershed WRAPS project:
- Lake 1: Phosphorus
Since the baseline of the TMDL (2010), MS4 College has implemented 5 BMPs that can be credited as progress toward achieving an applicable WLA. The table below illustrates to which category each BMP/activity is applicable. Note that MS4 College is located entirely within the jurisdiction of City A. This provides a unique partnership opportunity for the two MS4 permittees. As a result, the two have an agreement in place for City A to perform street sweeping on campus. Each permittee can therefore claim a Category 2 credit. MS4 College, however, indicates on its form that City A is the owner/operator of this BMP.
BMP FIL1 is owned and operated by MS4 College. City B claimed a category 2 credit for this BMP because it contributed funding for the BMP, but only MS4 College can claim this as a Category 1 BMP because it occurs within their jurisdiction.
The screenshot below is an example of how the BMP-Activities completed worksheet may look when complete.
Cumulative reductions worksheet
This is the portion of the TMDL report form that the permittee will report the cumulative reduction achieved for each TMDL WLA. See the cumulative reductions section of the guidance for information on each of the reporting categories.
City A
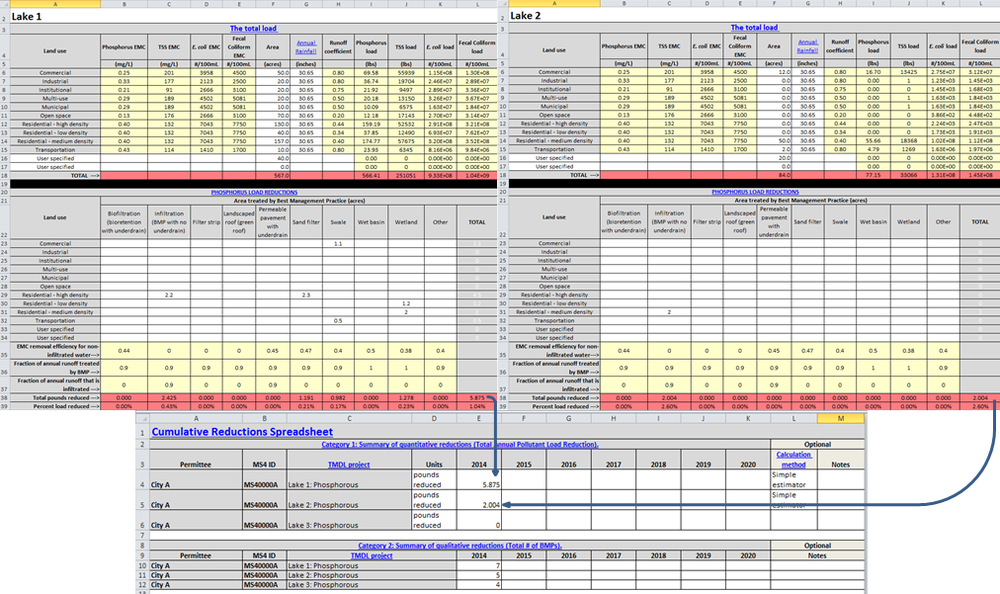
The lower portion of the screenshot below illustrates how City A's Cumulative reductions worksheet should look for 2014 Annual Report. City A chose to estimate load reductions using the MPCA estimator. Details for how this tool was used can be found in the guidance and examples for using the MPCA Simple Estimator.
The following screenshot is an example of City A's 2015 Cumulative reductions worksheet submission. It is very similar to what was submitted for 2014 because only one BMP was fully implemented, that being the retrofit of INF1. This record was labeled as "Implement raingarden retrofit" in the 2014 Category 3 BMPs-Activities worksheet (row 4) and has been translated to the BMP-Activities completed worksheet in the 2015 Annual Report to show that the BMP has been fully implemented. The update is also reflected in the Category 3 BMP-Activities worksheet. See the Category 3 BMPs-Activities worksheet section of this document for screen shot examples.
Because the implemented retrofit improved the pollutant reduction capability of an existing structural BMP, INF1, it can be quantified in Category 1. Prior to the retrofit, INF1 treated 2 acres of land classified as Residential-medium density (see MPCA estimator screen shot). Assuming the INF1 retrofit doubled the Residential-medium density land area treated (2 acres treated by INF1 in 2014; 4 treated by INF1 in 2015 after completed retrofit), the cumulative reduction reported in 2015 for the Lake 2: Phosphorus TMDL would increase from 2.004 pounds to 4.008 pounds.
City B
City B had implemented no structural BMPs within its jurisdiction from the baseline to the first year of reporting. All reductions are therefore reported as Category 2 and would appear as follows in the screenshot below.
City C
City C had implemented a variety of BMPs from the baseline of the TMDL to the first year of reporting. Similar to City A, reductions have been reported in both Category 1 and 2. Category 1 reductions were calculated using the MPCA estimator and examples of its use can be found in the guidance and examples for using the MPCA Simple Estimator.
MS4 College
MS4 College had implemented a variety of BMPs from the baseline of the TMDL to the first year of reporting. Reductions have therefore been reported in both Category 1 and 2. Category 1 reductions were calculated using the MPCA estimator and examples of its use can be found in the guidance and examples for using the MPCA Simple Estimator.
Category 3 BMPs-Activities worksheet
This is the portion of the TMDL form that must contain planned BMPs that have not yet been implemented but were submitted as a part of the compliance schedule in the MS4 Permit TMDL Attachment spreadsheet at the time of application. This worksheet will also store records that constitute progress but do not achieve a reduction (e.g. planning, feasibility studies, acquisition of funding, etc.). The subsequent section will only cover an example for City A.
City A
The screen shot below illustrates the Category 3 BMPs-Activites worksheet for 2014. This contains all but two of the BMPs ("Permeable pavement with no underdrain" and "Increased street sweeping") from the compliance schedule screen shot in the BMP-Actvities completed section for City A. Those BMPs have been reported in the BMP-Activities completed worksheet because they were fully implemented in 2014. You will notice that one activity ("Feasibility study - Raingarden retrofit assessment") fully implemented in 2014 remains in the Category 3 BMPs-Activites worksheet. This is because it does not receive credit for a reduction in pollutant loading but does demonstrate that the permittee is making progress.
The following screen shot illustrates the Category 3 BMPs-Activites worksheet for the 2015 Annual Report. This submission will contain all the BMPs from the 2014 Annual Report except for the highlighted record ("Implement raingarden retrofit"). This has now been translated to the BMP-Activities completed worksheet because it was fully implemented in 2015 (see the screen shot of City A's BMP-activities completed worksheet for the 2015 Annual Report). This process will continue each year of the permit term as BMPs/activities are completed.
Adaptive management worksheet
Refer to the Adaptive Management Strategy section of the guidance for an example on how to fill out this portion of TMDL form.
Scenario 2: Big River TMDL
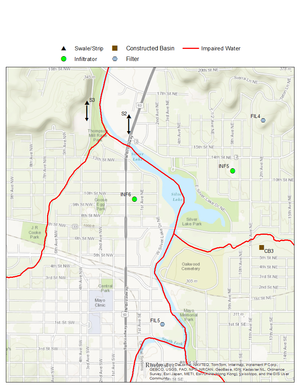
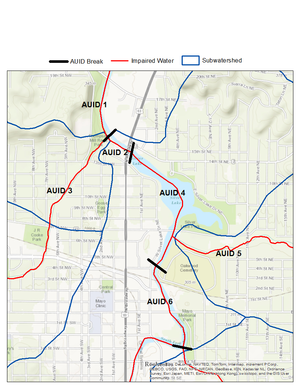
The following example covers a theoretical outstate area TMDL, the Big River TMDL, with one MS4 Permittee (City D). Maps 3 and 4 will be used to aid the discussion. Each map covers the same area, all of which is within the jurisdictional boundary of City D. Map 3 depicts structural BMPs and Map 4 depicts the six AUIDs (Assessment Unit ID, or different stream reaches) TMDLs have been completed on.
As you may know, stream TMDLs use a Load Duration Curve (LDC) approach. The result is WLAs assigned to MS4s across five flow regimes (High, moist, mid-range, dry, low), which in this example, would equate to 30 total TSS WLAs and 30 total E. coli WLAs. Permittees are not required however, to report on each individual flow regime. For ease of reporting, the Permittee is allowed to report on groupings of WLAs within the same report. Stream TMDLs will therefore be represented according to TMDL Project Name + Pollutant by default. In this example, City D has been assigned TSS and E. coli WLAs for each of the six stream reaches (AUIDs) in the Big River TMDL project (6 TSS TMDLs and 6 E.coli TMDLs). These will be grouped into two TMDL WLAs to report on:
- Big River TMDL: TSS
- Big River TMDL: E. coli
BMP-Activities completed worksheet
This is the portion of the TMDL report form that the permittee will provide information on all BMPs being applied to a TMDL WLA/s.
City D
As mentioned previously, City D has been assigned WLA for TSS and E. coli TMDLs on all six of the impaired stream reaches included in the Big River TMDL. As a result of the grouping approach, the reporting requirement is as follows:
- Big River TMDL: TSS
- Big River TMDL: E. coli
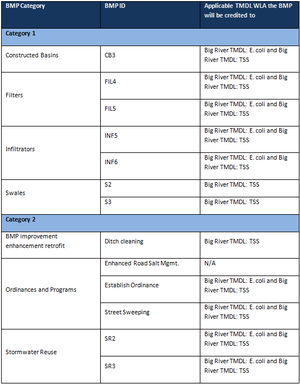
Since the baseline of the TMDL (2005), City D has implemented 11 BMPs that can be credited as progress toward achieving an applicable WLA. The table below illustrates which TMDL each BMP can be credited to and in what category. All BMPs are implemented within the Big River TMDL study area. Per the grouping approach, all BMPs are applied to all stream reaches so long as the BMP addresses the pollutant of concern. The following screen shot is an example of how the BMP-Activities completed worksheet may look when complete.
Cumulative reductions worksheet
This is the portion of the TMDL report form that the permittee will report the cumulative reduction achieved for each TMDL WLA. See the cumulative reductions section of the guidance for information on each of the reporting categories.
City D
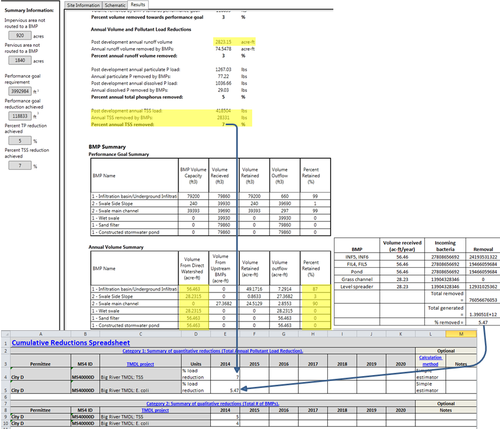
City D used the MIDS calculator to estimate TSS pollutant reductions associated with implemented BMPs. The following model inputs and assumptions were used in the MIDS calculator.
- 3000 acre watershed, consisting of 1000 acres of forest/open space, 1000 acres of managed turf, and 1000 acres of impervious surface
- Annual rainfall of 31.9 inches
- Average TSS concentration of 54.5 mg/L
- B (SM) soils (design infiltration rate of 0.45 inches per hour)
- The two infiltration BMPs (INF5 and INF6) were combined into a single BMP designed to exactly treat the MIDS performance goal of 1.1 inches of new or redeveloped impervious surfaces
- The two filters (FIL4 and FIL5) were combined into a single BMP that treated 20 acres of impervious surface
- The constructed pond was Design Level 2 and treated 20 acres of impervious surface
- The grass channel was treated as a wet swale treating 10 acres of impervious surface
- The level spreader was modeled as a main channel swale that treated 10 acres of impervious surface and exactly met the MIDS performance goal of 1.1 inches off new and redeveloped impervious surfaces
Total TSS reduction by the BMPs was 28331 pounds or 7% of the total load.
The MIDS calculator does not address E. coli. The following assumptions were made for bacteria removal by BMPs.
- For INF5, INF6, and the level spreader, bacteria removal was 100 percent for infiltrated water and 0 percent for non-infiltrated water
- For sand filters and the constructed pond, removal was 70 percent
- Removal for the grass channel was 0 percent
To estimate bacteria removal, the following steps were followed.
- Calculate total annual volume = 2823.15 acre-feet
- Calculate total annual bacteria load = 1.39E+12
- Calculate total annual bacteria input to each BMP = Volume from direct watershed * bacteria concentration
- Calculate total annual bacteria reduction using the assumptions above
The annual reduction in bacteria loading associated with these BMPs is 5.47 percent.
The following tables summarize the calculations for each BMP, all BMPs combined, and resulting annual reduction expressed as a percent.
Adaptive management worksheet
Refer to the Adaptive Management Strategy section of the guidance for an example on how to fill out this portion of TMDL form.
This page was last edited on 5 January 2023, at 15:54.
