Difference between revisions of "Exercises from MIDS calculator workshops"
m |
m (→Problem 2-5) |
||
| (26 intermediate revisions by the same user not shown) | |||
| Line 1: | Line 1: | ||
| + | This page summarizes exercises used for MIDS calculator training workshops. | ||
| + | |||
==December, 2017 workshops== | ==December, 2017 workshops== | ||
Two workshops were held (December 5 and 7) and attended by a total of 22 people. Attendees were asked to choose from a list of problems and solve the problem in the MIDS calculator. Below are examples of approaches that could be used for each problem. These are just example solutions and you are encouraged to try different solutions. | Two workshops were held (December 5 and 7) and attended by a total of 22 people. Attendees were asked to choose from a list of problems and solve the problem in the MIDS calculator. Below are examples of approaches that could be used for each problem. These are just example solutions and you are encouraged to try different solutions. | ||
| − | Click on the Excel files to open and then save them on your computer. Open the MIDS calculator and open the file of interest. Included below is a discussion of BMPs and routing for each problem. If you are reviewing calculator files, [here is a link] to some common things to look for. | + | Click on the Excel files to open and then save them on your computer. Open the MIDS calculator and open the file of interest. Included below is a discussion of BMPs and routing for each problem. If you are reviewing calculator files, [https://stormwater.pca.state.mn.us/index.php?title=Things_to_look_for_when_reviewing_MIDS_calculator_files_and_submissions here is a link] to some common things to look for. |
| + | |||
| + | Exercises 1-4 and 2-6 are not discussed below. Workshop participants were asked to evaluate existing MIDS calculator files for these problems. These files can be accessed at the following links. | ||
| + | *[[File:Calculator training example 1.xls]] | ||
| + | *[[File:Calculator training example 2.xls]] | ||
===Problem 1-1=== | ===Problem 1-1=== | ||
| Line 11: | Line 17: | ||
The BMPs utilized and their sequencing in a stormwater treatment train is shown in the figure to the right and summarized below. | The BMPs utilized and their sequencing in a stormwater treatment train is shown in the figure to the right and summarized below. | ||
| − | *Assuming | + | *Assuming an average foundation size of about 900 square feet, 5 houses employed green roofs, each with 3 inch media depths |
*2 acres of the development are in permeable pavement. This could include driveways and walkways | *2 acres of the development are in permeable pavement. This could include driveways and walkways | ||
| − | *1 acre of conventional roofs | + | *1 acre of conventional roofs are routed to 5 acres of lawns. Excess water is routed to bioinfiltration (rain gardens). |
*15 rain gardens, each 1000 square feet in area and 1.5 feet deep. Excess water is routed to a pond that will be used for irrigation. | *15 rain gardens, each 1000 square feet in area and 1.5 feet deep. Excess water is routed to a pond that will be used for irrigation. | ||
*The pond is part of a harvest and use system to water the 5 acre ballfield from May to September. A small amount of water is used for toilet flushing in the rec center at the ballfield. The harvest system is routed to a relatively small infiltration basin. | *The pond is part of a harvest and use system to water the 5 acre ballfield from May to September. A small amount of water is used for toilet flushing in the rec center at the ballfield. The harvest system is routed to a relatively small infiltration basin. | ||
| Line 32: | Line 38: | ||
*An underground infiltration system that runs the length of the project. | *An underground infiltration system that runs the length of the project. | ||
| − | Some other BMPs that could have been incorporated | + | Some other BMPs that could have been incorporated include planter boxes using the disconnection BMP and green roofs. Infiltration basins would be more effective than bioinfiltration but provides fewer aesthetic benefits. |
===Problem 1-3=== | ===Problem 1-3=== | ||
| Line 57: | Line 63: | ||
'''Problem:''' A 40 acre development site on B soils (0.30 in/hr). A significant portion of the site is underlain by bedrock within 3 feet of the land surface (see Figure 1). The site includes 30 acres of residential land use (30% impervious), 5 acres of commercial land use (60% impervious), and 5 acres of green space. | '''Problem:''' A 40 acre development site on B soils (0.30 in/hr). A significant portion of the site is underlain by bedrock within 3 feet of the land surface (see Figure 1). The site includes 30 acres of residential land use (30% impervious), 5 acres of commercial land use (60% impervious), and 5 acres of green space. | ||
| − | The proximity of bedrock to the land surface will dictate how the site is developed. The commercial area and green space will likely exist on the area with bedrock less than 3 feet from the land surface. The Construction Stormwater Permit prohibits infiltration in areas where groundwater is less than 3 feet from the land surface. The land use breakdown for the portion of the site with bedrock less than 3 feet of the land surface is as follows: | + | The proximity of bedrock to the land surface will dictate how the site is developed. The commercial area and green space will likely exist on the area with bedrock less than 3 feet from the land surface. The [https://stormwater.pca.state.mn.us/index.php/Construction_stormwater_permit Construction Stormwater Permit] prohibits infiltration in areas where groundwater is less than 3 feet from the land surface. The land use breakdown for the portion of the site with bedrock less than 3 feet of the land surface is as follows: |
*5 acres of green space, all pervious | *5 acres of green space, all pervious | ||
*5 acres of commercial consisting of 3 acres of impervious and 2 acres of pervious | *5 acres of commercial consisting of 3 acres of impervious and 2 acres of pervious | ||
| Line 64: | Line 70: | ||
The area with bedrock greater than 6 feet consists of 6 acres of residential, with 1.8 acres of this impervious and 4.2 acres pervious. The area with bedrock from 3 to 6 feet below the land surface includes 14 acres of residential consisting of 4.2 acres of impervious and 9.8 acres of pervious. The entire site has 12 acres of impervious surface and 28 acres of pervious surface. | The area with bedrock greater than 6 feet consists of 6 acres of residential, with 1.8 acres of this impervious and 4.2 acres pervious. The area with bedrock from 3 to 6 feet below the land surface includes 14 acres of residential consisting of 4.2 acres of impervious and 9.8 acres of pervious. The entire site has 12 acres of impervious surface and 28 acres of pervious surface. | ||
| − | To conceptualize this site, consider the following BMP | + | To conceptualize this site, consider the following BMP options for the three land areas. |
*Bedrock < 3 feet: Irrigation, disconnection, and swales without check dams are options for this portion of the site. | *Bedrock < 3 feet: Irrigation, disconnection, and swales without check dams are options for this portion of the site. | ||
*Bedrock 3 to 6 feet: In addition to the above BMPs, we could utilize infiltration BMPs when bedrock is 3 feet or more from the base of the infiltration practice. Permeable pavement and swales with check dams are options. | *Bedrock 3 to 6 feet: In addition to the above BMPs, we could utilize infiltration BMPs when bedrock is 3 feet or more from the base of the infiltration practice. Permeable pavement and swales with check dams are options. | ||
| Line 85: | Line 91: | ||
[[File:Problem 2-2.png|300px|thumb|alt=schematic for MIDS calculator|<font size=3>Schematic for Exercise 2-2.</font size>]] | [[File:Problem 2-2.png|300px|thumb|alt=schematic for MIDS calculator|<font size=3>Schematic for Exercise 2-2.</font size>]] | ||
| − | '''Problem:''' | + | '''Problem:''' A 40 acre development site. Half the site (20 acres) is on C soils (0.20 in/hr) and half is on D soils (0.06 in/hr). The site includes 30 acres of residential land use (30% impervious), 5 acres of commercial land use (60% impervious), and 5 acres of green space. |
Assume half of this site is on D soils and the other half is on C soils. Using the MIDS [[Design Sequence Flowchart-Flexible treatment options]], Flexible Treatment Option 1 should be set as the performance goal. | Assume half of this site is on D soils and the other half is on C soils. Using the MIDS [[Design Sequence Flowchart-Flexible treatment options]], Flexible Treatment Option 1 should be set as the performance goal. | ||
| Line 98: | Line 104: | ||
*Bioretention BMPs can be used on C soils to achieve some infiltration. | *Bioretention BMPs can be used on C soils to achieve some infiltration. | ||
*Route the swales to constructed ponds, which are used for irrigation as part of a harvest and re-use system. | *Route the swales to constructed ponds, which are used for irrigation as part of a harvest and re-use system. | ||
| − | *Since we do not achieve the performance goal on the D portion of the site but do achieve the goal on the C soils, we route remaining water from the | + | *Since we do not achieve the performance goal on the D portion of the site but do achieve the goal on the C soils, we route remaining water from the D soil portion of the site to the harvest and re-use system on C soils. |
We achieve the 0.55 inch volume goal and 95 percent total phosphorus removal. | We achieve the 0.55 inch volume goal and 95 percent total phosphorus removal. | ||
| + | |||
| + | ===Problem 2-3=== | ||
| + | [[File:Exercise 2-3.xls]] | ||
| + | [[File:Problem 2-3.png|300px|thumb|alt=MIDS calculator schematic|<font size=3>Schematic for Exercise 2-3.</font size>]] | ||
| + | |||
| + | '''Problem:''' A 5-mile public transportation corridor serving light rail and low speed traffic. The corridor is on C soils (0.2 in/hr) and is 0.1 mile in width. The corridor is 100 percent impervious except for pervious areas associated with BMPs. | ||
| + | |||
| + | This is the same problem as Exercise 1-2 except it is on C soils. Underground infiltration, used for Exercise 1-2, is not a practical BMP for this situation. Because the media depth is restricted to 0.8 feet if we want to meet the 48 hour drawdown requirement, we have to enlarge the area of the tree trench. We can also increase the porosity of the tree trench to the maximum recommended value of 0.35. The increase in porosity from 0.25 (Exercise 1-2) to 0.35 gives a 40 percent increase in water retention. Other suitable BMPs include using planter boxes, green roofs, a limited amount of permeable pavement, biofiltration, and indoor use of harvested water. These BMPs are summarized below. | ||
| + | |||
| + | *Tree trench with a raised underdrain of 0.8 feet and covering about 17 percent of the area achieves about 95 percent of the performance goal. | ||
| + | *Green roofs covering about 5 acres of the area achieve about 20000 cubic feet of retention | ||
| + | *Permeable pavement has limited utility in C soils but can provide some volume control (about 8000 cubic feet) in addition to aesthetic value | ||
| + | *Planter boxes achieve very little volume reduction (about 5000 cubic feet) but can provide aesthetic value. The planter boxes can be simulated using the Other bmp, the disconnection bmp, or the harvest/re-use bmp. The disconnection bmp was used for this example. | ||
| + | *Biofiltration with a raised underdrain provides a small amount of volume control (about 15000 cubic feet) but provides aesthetic value. | ||
| + | *The harvest-re-use bmp provides volume control for water that is captured and used for on-site toilet flushing. The volume reduction is small (6000 cubic feet). | ||
| + | |||
| + | Having 17 percent of the site in a tree trench system would be challenging, but since the area is primarily a transportation corridor, there would likely not be space restrictions. | ||
| + | |||
| + | ===Problem 2-4=== | ||
| + | [[File:Exercise 2-4.xls]] | ||
| + | [[File:Problem 2-4.png|300px|thumb|alt=MIDS calculator schematic|<font size=3>Schematic for Exercise 2-4.</font size>]] | ||
| + | |||
| + | '''Problem:''' A 12-acre (3 block) private development in downtown. Site is on C soils (0.2 in/hr). Buildings are being demolished and replaced by a new corporate complex that will include several new buildings and a 1-acre plaza. Roads constitute 5% of the total area. The area is 100% impervious, except for the plaza, which could be up to 25% pervious. | ||
| + | |||
| + | The volume performance goal can be achieved at this site but requires aggressive bmp management. If most of the roof system was routed to extensive green roofs, about 53 percent of the performance goal could be achieved. If the entire road system was underlain by tree trenches, another 30 percent of the performance goal could be achieved. The remaining volume control can be achieved through use of biofiltration in the plaza area, indoor use of harvested runoff (for toilet flushing), use of planter boxes, and incorporation of intensive green roofs. The following bmp system was established. | ||
| + | |||
| + | *10 acres of roof routed to green roofs. A minimum of 50 percent of this 10 acres must be green roof, with up to 50 percent being conventional roof. The media depth was 4 inches, the maximum allowed by the calculator. | ||
| + | *The entire 5 percent of the area in roads was underlain by a tree trench system. The system has a raised underdrain (0.8 feet) and small trees were used. Small trees allow more trees to be used, require less soil volume, and provide a more practical scenario for an ultra-urban setting such as this. [https://stormwater.pca.state.mn.us/index.php?title=Minnesota_plant_lists#Tree_information Link here] to find information on appropriate trees for this setting. | ||
| + | *Much of the plaza area utilizes a biofiltration system with a raised underdrain (0.8) feet. Walkways with benches could be incorporated into this system. | ||
| + | *Indoor toilet flushing utilizes a harvest system. The calculator was used to size the cistern (5000 cubic foot storage). | ||
| + | *Porosities were maximized for the tree trench and biofiltration systems | ||
| + | |||
| + | The performance goal is achieved with this system. If we made 1 acre of the green roof an intensive green roof with 8 inches of media, we could capture an additional 4000 cubic feet of water. Other options for capturing runoff include using planter boxes and expanding use of harvested water. Volumes retained with these would likely be very small. | ||
| + | |||
| + | ===Problem 2-5=== | ||
| + | '''Problem:''' You represent a regulated MS4 city that has a wasteload allocation for a TMDL. You must reduce phosphorus loading from your MS4 by 25%. Your city is 16 square miles in area. The following information may be useful. | ||
| + | *10 square miles of residential, 30% impervious, phosphorus EMC = 0.35 mg/L | ||
| + | *2 square miles of commercial, 70% impervious, phosphorus EMC = 0.25 mg/L | ||
| + | *1 square mile industrial, 80% impervious, phosphorus EMC = 0.20 mg/L | ||
| + | *1 square mile green space and open space, phosphorus EMC = 0.12 mg/L | ||
| + | *2 square miles row crop agriculture, annual phosphorus export = 0.5 lb/acre | ||
| + | *Soils are predominantly loams and sandy clay loams | ||
| + | |||
| + | Use the calculator to determine total phosphorus (TP) loads for each land use setting. Assume ½ the pervious area in each land use is B soil (0.3 in/hr) and ½ is C soil (0.2 in/hr). Below are annual TP loads for each land use. TP consists of 55 percent particulate P (PP) and 45 percent dissolved P (DP). | ||
| + | *Residential – 2240 acres on B soils, 2240 acres on C soils, and 1920 acres of impervious, with a TP load of 4512 pounds and an annual export of 451 lb/mi<sup>2</sup> | ||
| + | *Commercial – 192 acres on B soils, 192 acres on C soils, and 896 acres of impervious, with a TP load of 1521 pounds and an annual export of 760 lb/mi<sup>2</sup> | ||
| + | *Industrial – 64 acres on B soils, 64 acres on C soils, and 512 acres of impervious, with a TP load of 670 pounds and an annual export of 670 lb/mi<sup>2</sup> | ||
| + | *Green and open space – 320 acres on B soils and 320 acres on C soils, with a TP load of 175 pounds and an annual export of 175 lb/mi<sup>2</sup> | ||
| + | *Agriculture – TP load of 640 pounds and an annual export of 640 lb/mi<sup>2</sup> | ||
| + | |||
| + | {| class="wikitable" style="float:right; margin-left: 10px; width:500px;" | ||
| + | |- | ||
| + | ! Land use !! BMP !! TP reduced (lbs) | ||
| + | |- | ||
| + | | colspan="3" | '''Residential''' | ||
| + | |- | ||
| + | | Bioinfiltration || 86 || 75 bmps | ||
| + | |- | ||
| + | | Biofiltration || 81 || 50 bmps | ||
| + | |- | ||
| + | | Disconnection || 3.5 || 2.3 acres | ||
| + | |- | ||
| + | | Permeable pavement || 217 || 100 ac; 50% impervious | ||
| + | |- | ||
| + | | Constructed pond || 584 || 500 ac impervious | ||
| + | |- | ||
| + | | Street sweeping || 100 || Sweep 4X per year | ||
| + | |- | ||
| + | | colspan="3" | '''Agriculture''' | ||
| + | |- | ||
| + | | Convert to residential || 572 || residential with bmps described above | ||
| + | |- | ||
| + | | Street sweeping || 20 || Sweep 4X per year | ||
| + | |- | ||
| + | | Colspan="3" | '''Commercial''' | ||
| + | |- | ||
| + | | Constructed pond || 378 || Half impervious routed to bmp | ||
| + | |- | ||
| + | | Irrigation (harvest/re-use) || 79 || pond water irrigate half of pervious acres | ||
| + | |- | ||
| + | | Street sweeping || 38 || Sweep monthly | ||
| + | |- | ||
| + | | colspan="3" | '''Industrial''' | ||
| + | |- | ||
| + | | Tree trench || 33 || 50 acres routed to 5 acre trench | ||
| + | |- | ||
| + | | Street sweeping || 19 || Sweep monthly | ||
| + | |- | ||
| + | | colspan="3" | '''Total pounds reduced = 2210''' | ||
| + | |} | ||
| + | |||
| + | Note the annual export on a per area basis is greatest for commercial and industrial land uses. Also note that annual export is lower for residential than for agriculture. The TP load for the entire area is 7518 pounds per year. The required reduction is 1880 pounds per year. | ||
| + | |||
| + | A 25 percent reduction for a large area where bmps have not been implemented is relatively easy to achieve with the calculator. The local government unit will have to decide which practices to implement based on cost, pollutant removal, logistics, and funding opportunities. The scenario below is an example of how to achieve the required reduction. The results are summarized in the table to the right. | ||
| + | *Residential area: this is the largest land area and has the highest phosphorus concentrations in runoff. | ||
| + | **75 bioinfiltration bmps (rain gardens) were employed on B soils and 50 biofiltration systems (raised underdrain) were employed on C soils. Each bioretention basin was assumed to be approximately 1000 square feet in area with maximum depths allowed by the calculator for the given soils. | ||
| + | **A rooftop disconnection program resulted in disconnection of 2.3 acres (roughly 100 houses) of roofs, with water routed to lawns and gardens. | ||
| + | **500 acres of permeable pavement treated water from an area of 1000 acres. | ||
| + | **500 acres of impervious surface were routed to constructed ponds utilizing Level 2 design | ||
| + | *Agriculture: Convert the row crop agriculture to residential land use with the same bmp scenario and bmp density as described above. | ||
| + | *Commercial | ||
| + | **Route half the commercial impervious acres to constructed ponds with Level 2 design | ||
| + | **Use water captured by the ponds to irrigate half the commercial pervious acres | ||
| + | *Industrial: route 50 acres of impervious to a 5 acre tree trench system that utilizes a raised underdrain | ||
| + | |||
| + | Street sweeping is employed in all land uses. Sweeping occurs 4 times per year in residential areas and monthly in other land uses. It is assumed there are about 200 curb miles in the city and an approximate TP removal of 1 pound per curb mile with monthly street sweeping (Baker et al.) | ||
| + | |||
| + | Additional bmps might include iron-enhanced treatments, bioswales, and rain barrels for residences. | ||
| + | |||
| + | Caution must be exercised when using the calculator for large areas. Documenting sizing information is essential so reviewers can ensure that bmps are properly sized. Lumping areas with different event mean concentrations is not recommended since bmp performance will not be accurately modeled. | ||
| + | |||
| + | This suite of BMPs results in a 29.4 percent reduction in phosphorus loading, exceeding the 25 percent reduction requirement. | ||
| + | |||
| + | [[Category:Level 3 - Models and modeling/Specific models/MIDS Calculator]] | ||
Latest revision as of 18:28, 11 January 2023
This page summarizes exercises used for MIDS calculator training workshops.
Contents
December, 2017 workshops
Two workshops were held (December 5 and 7) and attended by a total of 22 people. Attendees were asked to choose from a list of problems and solve the problem in the MIDS calculator. Below are examples of approaches that could be used for each problem. These are just example solutions and you are encouraged to try different solutions.
Click on the Excel files to open and then save them on your computer. Open the MIDS calculator and open the file of interest. Included below is a discussion of BMPs and routing for each problem. If you are reviewing calculator files, here is a link to some common things to look for.
Exercises 1-4 and 2-6 are not discussed below. Workshop participants were asked to evaluate existing MIDS calculator files for these problems. These files can be accessed at the following links.
Problem 1-1
Problem: A 60-acre residential development on B soils (0.45 in/hr). The development includes 50 homes, each on 1-acre lots, and 10 acres of green space. The green space includes 5 acres of wooded trails and a 5-acre recreation area (e.g. ballfields). Total impervious is 25%. Meet the MIDS performance goal of 1.1 inches.
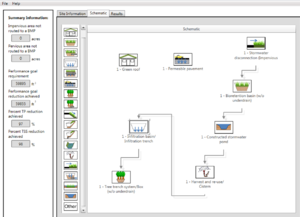
The BMPs utilized and their sequencing in a stormwater treatment train is shown in the figure to the right and summarized below.
- Assuming an average foundation size of about 900 square feet, 5 houses employed green roofs, each with 3 inch media depths
- 2 acres of the development are in permeable pavement. This could include driveways and walkways
- 1 acre of conventional roofs are routed to 5 acres of lawns. Excess water is routed to bioinfiltration (rain gardens).
- 15 rain gardens, each 1000 square feet in area and 1.5 feet deep. Excess water is routed to a pond that will be used for irrigation.
- The pond is part of a harvest and use system to water the 5 acre ballfield from May to September. A small amount of water is used for toilet flushing in the rec center at the ballfield. The harvest system is routed to a relatively small infiltration basin.
- The infiltration basin is routed to a tree system along the trail system.
The example utilizes several practices for illustrative purposes and does meet the 1.1 inch performance goal. Note the very high removal for phosphorus and TSS, partly because of the use of a stormwater pond that does not reduce volume but does reduce pollutant loading.
Problem 1-2
Problem: A 5-mile public transportation corridor serving light rail and low speed traffic. The corridor is on A soils (0.8 in/hr) and is 0.1 mile in width. The corridor is 100 percent impervious except for pervious areas associated with BMPs.
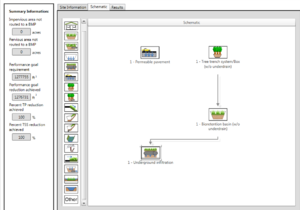
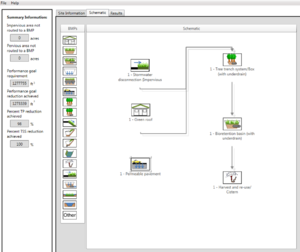
This site consists of 320 acres of impervious surface. The BMPs utilized and their sequencing in a stormwater treatment train is shown in the figure to the right and summarized below. Linear underground BMPs are logical BMPs for this setting.
- 2 acres of permeable pavement incorporated into a tree trench system
- The remaining 318 acres is routed into a tree trench system that runs the length of the transportation corridor. Sizes were determined based on a rooting volume of 1500 cubic feet per tree.
- 15 bioinfiltration BMPs, each 1000 square feet in area by 1.5 feet deep.
- An underground infiltration system that runs the length of the project.
Some other BMPs that could have been incorporated include planter boxes using the disconnection BMP and green roofs. Infiltration basins would be more effective than bioinfiltration but provides fewer aesthetic benefits.
Problem 1-3
Problem: A 12-acre (3 block) private development in downtown. Site is on B soils (0.45 in/hr). Buildings are being demolished and replaced by a new corporate complex that will include several new buildings and a 1-acre plaza. Roads constitute 5% of the total area. The area is 100% impervious, except for the plaza, which could be up to 25% pervious.
This site consists of 11.75 acres of impervious surface in an ultra-urban setting. There are 0.25 acres of pervious surface. BMP selection is limited at this site because the B soils do not make underground infiltration a cost-effective BMP. The following scenario was used to meet the performance goal.
- 3 acres of green roof. An additional 1.5 acre of conventional roof is routed to the green roofs. Note that an intensive green roof could have a media thickness greater than 4 inches and would provide better volume control, but media thickness in the calculator is limited to 4 inches.
- 1.5 acre of permeable pavement
- 5.75 acres of impervious surface are routed to a tree trench system. Some of this impervious surface could consist of permeable pavement but is included in the tree trench routing to avoid double counting. The tree trench system can only exist under roads and sidewalks (i.e. not under buildings), so we are limited in the surface area of the system.
- A 3500 square foot bioinfiltration BMP is incorporated into the plaza
- One acre of green roof consists of an intensive green roof with a media thickness of about 7 inches. Since we are limited to a 4 inch media depth in the green roof BMP, we can simulate an intensive green roof in one of two ways. First would be to add a second green roof consisting of 1 acre of impervious. This is problematic, however, because the water balance would be incorrect. Instead we can use the Other BMP. Since water retention for a green roof is linear as thickness increases, we simulate retention using a second green roof that is 1 acre in size and has a media depth of 3 inches (this 3 inches plus the 4 inches for the first green roof gives a simulated depth of 7 inches). We then take the volume retained toward the performance goal and enter it into the Other BMP, leaving the remaining fields in this BMP empty. We then delete the second green roof to avoid double counting. Note that we route the green roof to the Other BMP.
Although we attain the performance goal, our phosphorus retention on an annual basis is only 61 percent. This is because green roofs do not provide phosphorus attenuation.
Problem 2-1
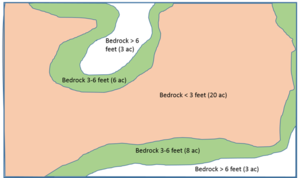
Problem: A 40 acre development site on B soils (0.30 in/hr). A significant portion of the site is underlain by bedrock within 3 feet of the land surface (see Figure 1). The site includes 30 acres of residential land use (30% impervious), 5 acres of commercial land use (60% impervious), and 5 acres of green space.
The proximity of bedrock to the land surface will dictate how the site is developed. The commercial area and green space will likely exist on the area with bedrock less than 3 feet from the land surface. The Construction Stormwater Permit prohibits infiltration in areas where groundwater is less than 3 feet from the land surface. The land use breakdown for the portion of the site with bedrock less than 3 feet of the land surface is as follows:
- 5 acres of green space, all pervious
- 5 acres of commercial consisting of 3 acres of impervious and 2 acres of pervious
- 10 acres of residential consisting of 3 acres of impervious and 7 acres of pervious
The area with bedrock greater than 6 feet consists of 6 acres of residential, with 1.8 acres of this impervious and 4.2 acres pervious. The area with bedrock from 3 to 6 feet below the land surface includes 14 acres of residential consisting of 4.2 acres of impervious and 9.8 acres of pervious. The entire site has 12 acres of impervious surface and 28 acres of pervious surface.
To conceptualize this site, consider the following BMP options for the three land areas.
- Bedrock < 3 feet: Irrigation, disconnection, and swales without check dams are options for this portion of the site.
- Bedrock 3 to 6 feet: In addition to the above BMPs, we could utilize infiltration BMPs when bedrock is 3 feet or more from the base of the infiltration practice. Permeable pavement and swales with check dams are options.
- Bedrock > 6 feet: Infiltration BMPs are acceptable. In addition to the BMPs described above, infiltration basins can be used. Infiltration basins are preferable compared to bioretention because of the 1.5 foot depth restriction on bioinfiltration compared to 1.8 feet for an infiltration basin. If bioinfiltration is utilized, more surface area will be needed compared to infiltration basins.
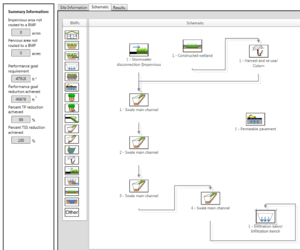
The diagram at the right illustrates the BMPs used for this exercise. Below is a short summary of some features.
- Disconnection and swales are used over the entire site
- The final swale has check dams because it can be constructed on soils without restrictions
- Infiltration basin is used instead of bioinfiltration
- A constructed wetland is used instead of a constructed pond, due to the depth restriction
- The disconnection BMP routes 4 acres of impervious surface to 8 acres of pervious turf. This would require routing runoff from driveways and sidewalks in addition to roof runoff.
- The harvest and re-use BMP is used for the 5 acre green space only. Irrigation is based on potential evapotranspiration.
- Multiple swales are used rather than lumping the swales into a single swale. Lumping swales incorrectly models swale performance since infiltration increases disproportionately with swale length.
- Permeable pavement might be utilized in certain key locations where runoff from adjacent impervious surfaces can be routed to the permeable pavement. The actual permeable pavement is limited to about 0.2 acre because it can only be utilized over a small portion of the site.
The MIDS performance goal of 1.1 inches off impervious surfaces is met at this site.
Problem 2-2
Problem: A 40 acre development site. Half the site (20 acres) is on C soils (0.20 in/hr) and half is on D soils (0.06 in/hr). The site includes 30 acres of residential land use (30% impervious), 5 acres of commercial land use (60% impervious), and 5 acres of green space.
Assume half of this site is on D soils and the other half is on C soils. Using the MIDS Design Sequence Flowchart-Flexible treatment options, Flexible Treatment Option 1 should be set as the performance goal.
- Achieve at least 0.55 inch volume reduction goal, and
- Remove 75 percent of the annual total phosphorus load.
In the MIDS calculator, change the performance goal to 0.55 inches, resulting in a performance goal of 23958 cubic feet.
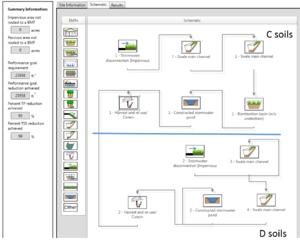
For simplicity we divided the site into two similar areas, one for C soils and one for D soils. We employed the same suite of BMPs for each soil. These are illustrated to the right and consisted of the following.
- Disconnection of 2 acres of impervious surface and routing to 4 acres of turf. This would simulate rooftop, driveway, and sidewalk runoff to pervious area.
- Swales to route the water to a constructed pond. Multiple swales are used because lumping swales into a single swale gives erroneous results. We can put check dams on the swales on the C soils to achieve some infiltration.
- Bioretention BMPs can be used on C soils to achieve some infiltration.
- Route the swales to constructed ponds, which are used for irrigation as part of a harvest and re-use system.
- Since we do not achieve the performance goal on the D portion of the site but do achieve the goal on the C soils, we route remaining water from the D soil portion of the site to the harvest and re-use system on C soils.
We achieve the 0.55 inch volume goal and 95 percent total phosphorus removal.
Problem 2-3
Problem: A 5-mile public transportation corridor serving light rail and low speed traffic. The corridor is on C soils (0.2 in/hr) and is 0.1 mile in width. The corridor is 100 percent impervious except for pervious areas associated with BMPs.
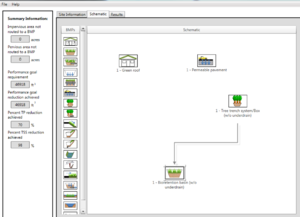
This is the same problem as Exercise 1-2 except it is on C soils. Underground infiltration, used for Exercise 1-2, is not a practical BMP for this situation. Because the media depth is restricted to 0.8 feet if we want to meet the 48 hour drawdown requirement, we have to enlarge the area of the tree trench. We can also increase the porosity of the tree trench to the maximum recommended value of 0.35. The increase in porosity from 0.25 (Exercise 1-2) to 0.35 gives a 40 percent increase in water retention. Other suitable BMPs include using planter boxes, green roofs, a limited amount of permeable pavement, biofiltration, and indoor use of harvested water. These BMPs are summarized below.
- Tree trench with a raised underdrain of 0.8 feet and covering about 17 percent of the area achieves about 95 percent of the performance goal.
- Green roofs covering about 5 acres of the area achieve about 20000 cubic feet of retention
- Permeable pavement has limited utility in C soils but can provide some volume control (about 8000 cubic feet) in addition to aesthetic value
- Planter boxes achieve very little volume reduction (about 5000 cubic feet) but can provide aesthetic value. The planter boxes can be simulated using the Other bmp, the disconnection bmp, or the harvest/re-use bmp. The disconnection bmp was used for this example.
- Biofiltration with a raised underdrain provides a small amount of volume control (about 15000 cubic feet) but provides aesthetic value.
- The harvest-re-use bmp provides volume control for water that is captured and used for on-site toilet flushing. The volume reduction is small (6000 cubic feet).
Having 17 percent of the site in a tree trench system would be challenging, but since the area is primarily a transportation corridor, there would likely not be space restrictions.
Problem 2-4
Problem: A 12-acre (3 block) private development in downtown. Site is on C soils (0.2 in/hr). Buildings are being demolished and replaced by a new corporate complex that will include several new buildings and a 1-acre plaza. Roads constitute 5% of the total area. The area is 100% impervious, except for the plaza, which could be up to 25% pervious.
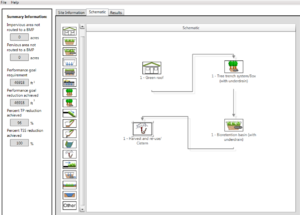
The volume performance goal can be achieved at this site but requires aggressive bmp management. If most of the roof system was routed to extensive green roofs, about 53 percent of the performance goal could be achieved. If the entire road system was underlain by tree trenches, another 30 percent of the performance goal could be achieved. The remaining volume control can be achieved through use of biofiltration in the plaza area, indoor use of harvested runoff (for toilet flushing), use of planter boxes, and incorporation of intensive green roofs. The following bmp system was established.
- 10 acres of roof routed to green roofs. A minimum of 50 percent of this 10 acres must be green roof, with up to 50 percent being conventional roof. The media depth was 4 inches, the maximum allowed by the calculator.
- The entire 5 percent of the area in roads was underlain by a tree trench system. The system has a raised underdrain (0.8 feet) and small trees were used. Small trees allow more trees to be used, require less soil volume, and provide a more practical scenario for an ultra-urban setting such as this. Link here to find information on appropriate trees for this setting.
- Much of the plaza area utilizes a biofiltration system with a raised underdrain (0.8) feet. Walkways with benches could be incorporated into this system.
- Indoor toilet flushing utilizes a harvest system. The calculator was used to size the cistern (5000 cubic foot storage).
- Porosities were maximized for the tree trench and biofiltration systems
The performance goal is achieved with this system. If we made 1 acre of the green roof an intensive green roof with 8 inches of media, we could capture an additional 4000 cubic feet of water. Other options for capturing runoff include using planter boxes and expanding use of harvested water. Volumes retained with these would likely be very small.
Problem 2-5
Problem: You represent a regulated MS4 city that has a wasteload allocation for a TMDL. You must reduce phosphorus loading from your MS4 by 25%. Your city is 16 square miles in area. The following information may be useful.
- 10 square miles of residential, 30% impervious, phosphorus EMC = 0.35 mg/L
- 2 square miles of commercial, 70% impervious, phosphorus EMC = 0.25 mg/L
- 1 square mile industrial, 80% impervious, phosphorus EMC = 0.20 mg/L
- 1 square mile green space and open space, phosphorus EMC = 0.12 mg/L
- 2 square miles row crop agriculture, annual phosphorus export = 0.5 lb/acre
- Soils are predominantly loams and sandy clay loams
Use the calculator to determine total phosphorus (TP) loads for each land use setting. Assume ½ the pervious area in each land use is B soil (0.3 in/hr) and ½ is C soil (0.2 in/hr). Below are annual TP loads for each land use. TP consists of 55 percent particulate P (PP) and 45 percent dissolved P (DP).
- Residential – 2240 acres on B soils, 2240 acres on C soils, and 1920 acres of impervious, with a TP load of 4512 pounds and an annual export of 451 lb/mi2
- Commercial – 192 acres on B soils, 192 acres on C soils, and 896 acres of impervious, with a TP load of 1521 pounds and an annual export of 760 lb/mi2
- Industrial – 64 acres on B soils, 64 acres on C soils, and 512 acres of impervious, with a TP load of 670 pounds and an annual export of 670 lb/mi2
- Green and open space – 320 acres on B soils and 320 acres on C soils, with a TP load of 175 pounds and an annual export of 175 lb/mi2
- Agriculture – TP load of 640 pounds and an annual export of 640 lb/mi2
| Land use | BMP | TP reduced (lbs) |
|---|---|---|
| Residential | ||
| Bioinfiltration | 86 | 75 bmps |
| Biofiltration | 81 | 50 bmps |
| Disconnection | 3.5 | 2.3 acres |
| Permeable pavement | 217 | 100 ac; 50% impervious |
| Constructed pond | 584 | 500 ac impervious |
| Street sweeping | 100 | Sweep 4X per year |
| Agriculture | ||
| Convert to residential | 572 | residential with bmps described above |
| Street sweeping | 20 | Sweep 4X per year |
| Commercial | ||
| Constructed pond | 378 | Half impervious routed to bmp |
| Irrigation (harvest/re-use) | 79 | pond water irrigate half of pervious acres |
| Street sweeping | 38 | Sweep monthly |
| Industrial | ||
| Tree trench | 33 | 50 acres routed to 5 acre trench |
| Street sweeping | 19 | Sweep monthly |
| Total pounds reduced = 2210 | ||
Note the annual export on a per area basis is greatest for commercial and industrial land uses. Also note that annual export is lower for residential than for agriculture. The TP load for the entire area is 7518 pounds per year. The required reduction is 1880 pounds per year.
A 25 percent reduction for a large area where bmps have not been implemented is relatively easy to achieve with the calculator. The local government unit will have to decide which practices to implement based on cost, pollutant removal, logistics, and funding opportunities. The scenario below is an example of how to achieve the required reduction. The results are summarized in the table to the right.
- Residential area: this is the largest land area and has the highest phosphorus concentrations in runoff.
- 75 bioinfiltration bmps (rain gardens) were employed on B soils and 50 biofiltration systems (raised underdrain) were employed on C soils. Each bioretention basin was assumed to be approximately 1000 square feet in area with maximum depths allowed by the calculator for the given soils.
- A rooftop disconnection program resulted in disconnection of 2.3 acres (roughly 100 houses) of roofs, with water routed to lawns and gardens.
- 500 acres of permeable pavement treated water from an area of 1000 acres.
- 500 acres of impervious surface were routed to constructed ponds utilizing Level 2 design
- Agriculture: Convert the row crop agriculture to residential land use with the same bmp scenario and bmp density as described above.
- Commercial
- Route half the commercial impervious acres to constructed ponds with Level 2 design
- Use water captured by the ponds to irrigate half the commercial pervious acres
- Industrial: route 50 acres of impervious to a 5 acre tree trench system that utilizes a raised underdrain
Street sweeping is employed in all land uses. Sweeping occurs 4 times per year in residential areas and monthly in other land uses. It is assumed there are about 200 curb miles in the city and an approximate TP removal of 1 pound per curb mile with monthly street sweeping (Baker et al.)
Additional bmps might include iron-enhanced treatments, bioswales, and rain barrels for residences.
Caution must be exercised when using the calculator for large areas. Documenting sizing information is essential so reviewers can ensure that bmps are properly sized. Lumping areas with different event mean concentrations is not recommended since bmp performance will not be accurately modeled.
This suite of BMPs results in a 29.4 percent reduction in phosphorus loading, exceeding the 25 percent reduction requirement.
This page was last edited on 11 January 2023, at 18:28.
