Difference between revisions of "Interpreting wasteload allocations based on flow/load duration curves"
m |
|||
| (26 intermediate revisions by the same user not shown) | |||
| Line 1: | Line 1: | ||
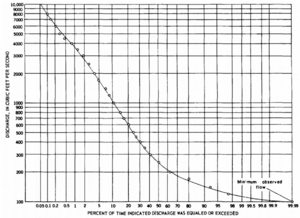
[[File:Flow duration curve.png|300px|thumb|alt=image of flow duration curve|<font size=3>Example of a flow duration curve ([https://pubs.usgs.gov/wsp/1542a/report.pdf Searcy, 1959]</font size>]] | [[File:Flow duration curve.png|300px|thumb|alt=image of flow duration curve|<font size=3>Example of a flow duration curve ([https://pubs.usgs.gov/wsp/1542a/report.pdf Searcy, 1959]</font size>]] | ||
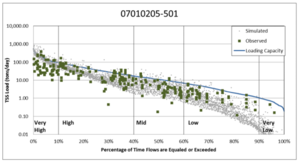
| − | [[File:Load duration curve.png|300px|thumb|alt=image load duration curve|<font size=3>TSS load duration curve for Buffalo Creek in Minnesota. From [https://www.pca.state.mn.us/sites/default/files/wq-iw8-52e.pdf South Fork Crow River Watershed Total Maximum Daily Load Report | + | [[File:Load duration curve.png|300px|thumb|alt=image load duration curve|<font size=3>TSS load duration curve for Buffalo Creek in Minnesota. From [https://www.pca.state.mn.us/sites/default/files/wq-iw8-52e.pdf South Fork Crow River Watershed Total Maximum Daily Load Report]</font size>]] |
| − | + | {{alert|When considering Total suspended solids (TSS) or turbidity TMDLs based on load duration curves, the MPCA recommends using the mid value when determining wasteload allocations for MS4 permits. However, if your required pollutant reduction is zero (0) at the mid value we recommend contacting the Minnesota Pollution Control Agency for guidance. A required reduction of zero (0) at the mid value does not necessarily equate to no required actions if there are required reductions at other flow ranges,|alert-info}} | |
| − | + | Flow duration curves use historical records to relate flow values in a stream or river to the percent of time those values have been met or exceeded. The curves show flow from high to low along the Y-axis and the percent of time when that flow is exceeded on the X-axis. Flow duration curves are often divided into different flow regimes. For example, a curve could be divided into 3 regimes based on percent likelihood of exceedance. The three regimes could each account for 33.3 percent of the curve and be labeled as low, medium, and high flow regimes. Low flows are exceeded a majority of the time, while high flows are exceeded infrequently. | |
| − | + | Load duration curves are similar to flow duration curves but instead relate pollutant loads in a stream or river to the percent of time a specific flow has been met or exceeded. Load duration curves are generated by multiplying the water quality standard by the flow. Load duration curves represent the acceptable pollutant loading across a range of flows. Monitored values are plotted on the load duration curve to identify when exceedances of the water quality criterion occur. Values plotting above the load duration line represent exceedances of a water quality criterion. | |
| − | Interpreting <span title="the portion of a receiving water's assimilative capacity that is allocated to one of its existing or future point sources of pollution"> '''wasteload allocations'''</span> (WLAs) from load duration curves can be challenging for | + | For <span title="the amount of a pollutant from both point and nonpoint sources that a waterbody can receive and still meet water quality standards"> [https://stormwater.pca.state.mn.us/index.php?title=Total_Maximum_Daily_Loads_(TMDLs) '''total maximum daily loads''']</span> (TMDLs), load duration curves are primarily used for total suspended solids (TSS) and fecal bacteria (total fecal coliforms or ''E. coli''). Typically, five flow or load regimes are used (very low, low, mid, high, and very high). The specific flows that these correspond with can vary. For example, in the adjacent image, very low and very high correspond with the lowest and highest 10 percent of flows, respectively, mid flows correspond with flows in the 40-60 percent range, and high and low flows correspond with 10-40 and 60-90 percent of the flows, respectively. |
| + | |||
| + | Interpreting <span title="the portion of a receiving water's assimilative capacity that is allocated to one of its existing or future point sources of pollution"> '''wasteload allocations'''</span> (WLAs) from load duration curves can be challenging for an <span title="A municipal separate storm sewer system (MS4) is a means of transportation, individually or in a system, (e.g. roads with drainage systems, municipal streets, catch basins, curbs, gutters, ditches, man-made channels, storm drains, etc.) that are: owned or operated by a public entity (e.g. cities, townships, counties, military bases, hospitals, prison complexes, highway departments, universities, etc.) with jurisdiction over disposal of sewage, industrial wastes, stormwater, or other wastes. This includes special districts under State law (sewer, flood control, or drainage districts, etc.), an authorized Indian tribal organization, or a designated and approved management agency under section 208 of the Clean Water Act; designed or used for collecting or transporting stormwater; not a combined sewer; and not part of a publicly owned treatment works."> '''MS4'''</span> (Municipal Separate Storm Sewer System) permittee. These challenges include the following. | ||
*Permittees typically manage their area as a single system and do not implement <span title="one of many different structural or non–structural methods used to treat runoff"> '''best management practices'''</span> (BMPs) based on flow in a receiving water. | *Permittees typically manage their area as a single system and do not implement <span title="one of many different structural or non–structural methods used to treat runoff"> '''best management practices'''</span> (BMPs) based on flow in a receiving water. | ||
| − | + | *The effects of stormwater practices that retain water on the landscape, such as <span title="Infiltration Best Management Practices (BMPs) treat urban stormwater runoff as it flows through a filtering medium and into underlying soil, where it may eventually percolate into groundwater. The filtering media is typically coarse-textured and may contain organic material, as in the case of bioinfiltration BMPs."> [https://stormwater.pca.state.mn.us/index.php?title=Stormwater_infiltration_Best_Management_Practices '''infiltration''']</span>, are not accounted for in MS4 wasteload allocations for the high and very high flow regimes. | |
| − | *The | + | *Streamflow does not always correlate with precipitation. For example, the highest flows in streams and rivers, on an average annual basis, occur in early to mid-spring, while rainfall is greatest and rainfall intensities highest in late spring and early summer. In addition, peak stormwater runoff in early- to mid-spring typically occurs over a period of several days to weeks as snow melts. Stormwater BMPs are designed to manage this type of runoff, resulting in maximum BMP effectiveness during high stream flows. Conversely, intense rains in late spring and summer often overwhelm stormwater BMPs. Typically streamflows decrease during this time period, meaning stormwater BMPs are often less effective in middle flow regimes ([https://agupubs.onlinelibrary.wiley.com/doi/pdf/10.1029/1998WR900070 Baldwin and Lall], 1999; [https://www.hindawi.com/journals/amete/2018/3765098/ Zheng et al.], 2018) |
| − | * | + | *[https://www.mdpi.com/2073-4441/9/9/695/pdf Slater and Villarni] (2017) showed that antecedent moisture content is an important factor affecting streamflow. This is a relatively unimportant factor in managing stormwater runoff since BMPs are typically designed to capture an instantaneous volume of water regardless of antecedent moisture content, although BMPs would be expected to perform above design expectations under drier initial conditions. |
==Recommendation for interpreting load duration curves for MS4 permittees== | ==Recommendation for interpreting load duration curves for MS4 permittees== | ||
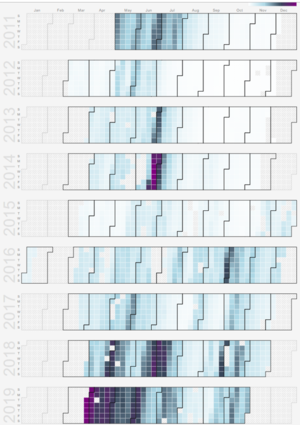
| − | For most TMDLs, the Minnesota Pollution Control Agency (MPCA) recommends using the mid value | + | [[File:Jordan River flows.png|300px|thumb|alt=MN River flows|<font size=3>Monthly Minnesota River discharge at Jordan, 2011-2019. ([https://snoflo.org/report/flow/minnesota/minnesota-river-near-jordan/almanac/ Source])</font size>]] |
| − | #In- and near-stream erosion processes | + | |
| − | #Stormwater | + | For most total suspended solids (TSS) TMDLs based on load duration curves, the Minnesota Pollution Control Agency (MPCA) recommends using the mid value WLA when assessing compliance with or progress toward meeting a WLA, as specified in the MS4 General Permit. |
| − | #Most stormwater BMPs are designed to treat small and moderate storms. | + | |
| + | Justification for this is based on the following. | ||
| + | #'''TSS WLAs are underallocated for MS4 stormwater'''. In- and near-stream erosion processes typically dominate pollutant loading at high and very high flows. Stormwater practices that retain water on the landscape (e.g infiltration) or slow the release of runoff (e.g. constructed ponds and wetlands, many filtration practices) reduce erosion associated with in- and near-stream processes. These effects are not accounted for in load determinations (e.g. models) when setting TMDLs. Consequently, these practices are not properly credited for MS4s at high and very high flows. | ||
| + | #'''Stormwater practices are already most effective at times when high and very high flow occurs'''. The adjacent image shows that stream hydrographs typically show a lag of several hours to more than a day before achieving peak flow. In the absence of very large rainfall events, sustaining peak flows at high and very high levels requires extended periods of rainfall or snowmelt. For these extended periods of rainfall and snowmelt, BMPs designed to treat an instantaneous volume will typically be overdesigned and thus under-credited since they will release water gradually (e.g. through infiltration), resulting in increased capture of runoff. | ||
| + | #'''Stormwater BMP effectiveness decreases at times when stream flows are decreasing'''. The most intense storms typically occur in late spring and summer, when stream flows are decreasing and are more typically at mid-flow levels. Most stormwater BMPs are designed to treat small and moderate storms. | ||
| + | |||
| + | Some exceptions to the above recommendation include the following. | ||
| + | *There are specific pollutant sources in the watershed that contribute at high and very high flows and that can be managed by the permittee. | ||
| + | *The permittee does not or cannot implement practices that retain runoff or slow the release of runoff. | ||
| + | *Exceedances of water quality criteria occur only at low and/or very low flows. In this case, the permittee should apply the WLA for these flow regimes. | ||
| + | *The permittee has conducted appropriate modeling to account for load reductions at high or very high flow conditions. | ||
| + | |||
| + | The above recommendation does not apply for bacteria TMDLs, since bacteria concentrations in stormwater runoff and receiving waters are typically greatest under wet weather conditions. Stormwater management for bacteria should therefore focus on wet weather conditions, which typically are correlated with higher flow conditions in receiving waters. | ||
| + | |||
| + | {{alert|Do not apply the recommendation discussed above to TMDLs for bacteria|alert-warning}} | ||
==Suggested reading== | ==Suggested reading== | ||
| Line 24: | Line 40: | ||
*[https://pubs.usgs.gov/wsp/1542a/report.pdf Flow-Duration Curves, James K. Searcy, Manual of Hydrology: Part 2. Low-Flow Techniques] (GEOLOGICAL SURVEY WATER-SUPPLY PAPER 1542-A) | *[https://pubs.usgs.gov/wsp/1542a/report.pdf Flow-Duration Curves, James K. Searcy, Manual of Hydrology: Part 2. Low-Flow Techniques] (GEOLOGICAL SURVEY WATER-SUPPLY PAPER 1542-A) | ||
*[https://www.sciencedirect.com/topics/engineering/flow-duration-curve Flow duration curves] | *[https://www.sciencedirect.com/topics/engineering/flow-duration-curve Flow duration curves] | ||
| + | |||
| + | [[Category:Level 3 - Regulatory/Municipal (MS4)/TMDLs]] | ||
Latest revision as of 15:23, 3 December 2022


Flow duration curves use historical records to relate flow values in a stream or river to the percent of time those values have been met or exceeded. The curves show flow from high to low along the Y-axis and the percent of time when that flow is exceeded on the X-axis. Flow duration curves are often divided into different flow regimes. For example, a curve could be divided into 3 regimes based on percent likelihood of exceedance. The three regimes could each account for 33.3 percent of the curve and be labeled as low, medium, and high flow regimes. Low flows are exceeded a majority of the time, while high flows are exceeded infrequently.
Load duration curves are similar to flow duration curves but instead relate pollutant loads in a stream or river to the percent of time a specific flow has been met or exceeded. Load duration curves are generated by multiplying the water quality standard by the flow. Load duration curves represent the acceptable pollutant loading across a range of flows. Monitored values are plotted on the load duration curve to identify when exceedances of the water quality criterion occur. Values plotting above the load duration line represent exceedances of a water quality criterion.
For total maximum daily loads (TMDLs), load duration curves are primarily used for total suspended solids (TSS) and fecal bacteria (total fecal coliforms or E. coli). Typically, five flow or load regimes are used (very low, low, mid, high, and very high). The specific flows that these correspond with can vary. For example, in the adjacent image, very low and very high correspond with the lowest and highest 10 percent of flows, respectively, mid flows correspond with flows in the 40-60 percent range, and high and low flows correspond with 10-40 and 60-90 percent of the flows, respectively.
Interpreting wasteload allocations (WLAs) from load duration curves can be challenging for an MS4 (Municipal Separate Storm Sewer System) permittee. These challenges include the following.
- Permittees typically manage their area as a single system and do not implement best management practices (BMPs) based on flow in a receiving water.
- The effects of stormwater practices that retain water on the landscape, such as infiltration, are not accounted for in MS4 wasteload allocations for the high and very high flow regimes.
- Streamflow does not always correlate with precipitation. For example, the highest flows in streams and rivers, on an average annual basis, occur in early to mid-spring, while rainfall is greatest and rainfall intensities highest in late spring and early summer. In addition, peak stormwater runoff in early- to mid-spring typically occurs over a period of several days to weeks as snow melts. Stormwater BMPs are designed to manage this type of runoff, resulting in maximum BMP effectiveness during high stream flows. Conversely, intense rains in late spring and summer often overwhelm stormwater BMPs. Typically streamflows decrease during this time period, meaning stormwater BMPs are often less effective in middle flow regimes (Baldwin and Lall, 1999; Zheng et al., 2018)
- Slater and Villarni (2017) showed that antecedent moisture content is an important factor affecting streamflow. This is a relatively unimportant factor in managing stormwater runoff since BMPs are typically designed to capture an instantaneous volume of water regardless of antecedent moisture content, although BMPs would be expected to perform above design expectations under drier initial conditions.
Recommendation for interpreting load duration curves for MS4 permittees

For most total suspended solids (TSS) TMDLs based on load duration curves, the Minnesota Pollution Control Agency (MPCA) recommends using the mid value WLA when assessing compliance with or progress toward meeting a WLA, as specified in the MS4 General Permit.
Justification for this is based on the following.
- TSS WLAs are underallocated for MS4 stormwater. In- and near-stream erosion processes typically dominate pollutant loading at high and very high flows. Stormwater practices that retain water on the landscape (e.g infiltration) or slow the release of runoff (e.g. constructed ponds and wetlands, many filtration practices) reduce erosion associated with in- and near-stream processes. These effects are not accounted for in load determinations (e.g. models) when setting TMDLs. Consequently, these practices are not properly credited for MS4s at high and very high flows.
- Stormwater practices are already most effective at times when high and very high flow occurs. The adjacent image shows that stream hydrographs typically show a lag of several hours to more than a day before achieving peak flow. In the absence of very large rainfall events, sustaining peak flows at high and very high levels requires extended periods of rainfall or snowmelt. For these extended periods of rainfall and snowmelt, BMPs designed to treat an instantaneous volume will typically be overdesigned and thus under-credited since they will release water gradually (e.g. through infiltration), resulting in increased capture of runoff.
- Stormwater BMP effectiveness decreases at times when stream flows are decreasing. The most intense storms typically occur in late spring and summer, when stream flows are decreasing and are more typically at mid-flow levels. Most stormwater BMPs are designed to treat small and moderate storms.
Some exceptions to the above recommendation include the following.
- There are specific pollutant sources in the watershed that contribute at high and very high flows and that can be managed by the permittee.
- The permittee does not or cannot implement practices that retain runoff or slow the release of runoff.
- Exceedances of water quality criteria occur only at low and/or very low flows. In this case, the permittee should apply the WLA for these flow regimes.
- The permittee has conducted appropriate modeling to account for load reductions at high or very high flow conditions.
The above recommendation does not apply for bacteria TMDLs, since bacteria concentrations in stormwater runoff and receiving waters are typically greatest under wet weather conditions. Stormwater management for bacteria should therefore focus on wet weather conditions, which typically are correlated with higher flow conditions in receiving waters.
Suggested reading
- What is a Flow Duration Curve?
- Flow-Duration Curves, James K. Searcy, Manual of Hydrology: Part 2. Low-Flow Techniques (GEOLOGICAL SURVEY WATER-SUPPLY PAPER 1542-A)
- Flow duration curves
This page was last edited on 3 December 2022, at 15:23.