Difference between revisions of "Requirements, recommendations and information for using Harvest and re-use/cistern as a BMP in the MIDS calculator"
m (→Related pages) |
|||
| (One intermediate revision by the same user not shown) | |||
| Line 51: | Line 51: | ||
[[file:PET plot.png|300px|thumb|alt=plot of PET over time|<font size=3>Statewide average weekly potential evapotranspiration (PET) from May 1 through September 30. See the discussion for information on data used to compile this plot.</font size>]] | [[file:PET plot.png|300px|thumb|alt=plot of PET over time|<font size=3>Statewide average weekly potential evapotranspiration (PET) from May 1 through September 30. See the discussion for information on data used to compile this plot.</font size>]] | ||
| − | Two methods are used to calculate irrigation rate. The first is based on plant water demand, called potential evapotranspiration (PET). A daily rate was calculated using data collected from the | + | Two methods are used to calculate irrigation rate. The first is based on plant water demand, called potential evapotranspiration (PET). A daily rate was calculated using data collected from the University of Wisconsin Extension. Daily PET rates between January 1, 2000, and December, 2015 were compiled in an Excel spreadsheet. Data for 11 locations in Minnesota was compiled individually for each location. The locations were Bemidji, Thief River Falls, Moorhead, Marshall, Morris, St. Cloud, Rochester, Hibbing, Minneapolis, Brainerd, and Duluth. Data for January, February, and December were discarded. The average daily PET was calculated for each location using the long-term data. State zip codes were then associated with one of these locations. Thus, when a user enters a zip code in the MIDS calculator, the PET record for that location is associated with the PET data for one of the ten cities. The Excel spreadsheet containing this information is [[file:ET data.xlsx]]. The weekly irrigation rate is based on the average achieved irrigation application rate from May through September. |
The second method is based on the user defined maximum daily irrigation rate. This is input as a constant value during the specified irrigation period. | The second method is based on the user defined maximum daily irrigation rate. This is input as a constant value during the specified irrigation period. | ||
| Line 67: | Line 67: | ||
On a day in which it rains, irrigation can occur such that rainfall plus irrigation for that day equals R<sub>I</sub>. For example, if PET is 0.90 inches per week, this would be 0.129 inches per day. If the user defined maximum was 1 inch per week, this would be 0.143 inches per day. The lower value is the PET and that would be used to compute irrigation applied that day. If 0.1 inches of rain fell that day, then (0.129 - 0.100) = 0.029 inches of water could be applied as irrigation on that day. | On a day in which it rains, irrigation can occur such that rainfall plus irrigation for that day equals R<sub>I</sub>. For example, if PET is 0.90 inches per week, this would be 0.129 inches per day. If the user defined maximum was 1 inch per week, this would be 0.143 inches per day. The lower value is the PET and that would be used to compute irrigation applied that day. If 0.1 inches of rain fell that day, then (0.129 - 0.100) = 0.029 inches of water could be applied as irrigation on that day. | ||
| − | Finally, irrigation rates are adjusted for crop type ([http://www.fao.org/docrep/x0490e/x0490e0b.htm 1 | + | Finally, irrigation rates are adjusted for crop type ([http://www.fao.org/docrep/x0490e/x0490e0b.htm 1], [http://www.usbr.gov/pn/agrimet/cropcurves/crop_curves.html 3]). The irrigation rate is multiplied by the following coefficients to give the final irrigation rate. |
*Turf = 0.95 | *Turf = 0.95 | ||
*Vegetables = 0.95 | *Vegetables = 0.95 | ||
Latest revision as of 22:47, 28 January 2023
Volume retention is achieved in the harvest and re-use/cistern BMP through re-use of the water for irrigation or other acceptable purposes (e.g. toilet flushing). The type of storage device is not considered in the calculator (e.g. pond or cistern). Any pollutant associated with the water used for irrigation or non-irrigation uses is removed from the system. Pollutants in water that bypasses the storage device or not used for irrigation or non-irrigation uses are not removed.
Contents
MIDS calculator user inputs for harvest and re-use/cistern
For a harvest and reuse/cistern system, the user must input the following parameters to calculate the volume and pollutant load reductions associated with the BMP.
- Watershed tab
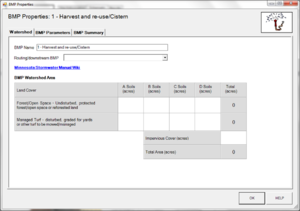
- BMP Name: This cell is auto-filled, but can be changed by the user.
- Routing/downstream BMP: If this BMP is part of a treatment train and overflow water that bypasses the storage device is being routed from this BMP to another BMP, the user selects the name of the BMP from the dropdown box to which water is being routed. All water must be routed to a single downstream BMP. Note that the user must include the BMP receiving the routed water in the Schematic tab or the BMP will not appear in the dropdown box.
- BMP Watershed Area: BMP watershed areas are the areas draining directly to the BMP. Values can be added for four soil types (Hydrologic Soil Groups (HSG) A, B, C, D) and for three Land Cover types (Forest/Open Space, Managed Turf and impervious). The surface area of the storage device should not be included in the BMP watershed area. If the storage device is enclosed it is assumed that runoff from the surface area of the container will not be routed into the unit. If the storage container is open (i.e. pond) it is assumed that precipitation and evapotranspiration at the surface of these systems are neutralizing. Units are in acres.
- BMP Parameters tab
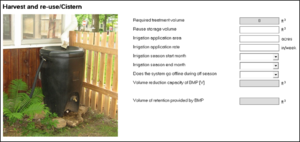
- Reuse storage volume (S): This is the storage volume of the storage device used to collect runoff to be used for irrigation or non-irrigation purposes. This can be a single storage container or a combined volume from multiple storage containers onsite. Units are in cubic feet.
- Irrigation application area (AI): This is the area that will be irrigated during the irrigation season. This can be a single area or a combined area from multiple irrigation sites. Units are in acres.
- Provide user defined maximum weekly irrigation rate?: A dropdown menu asks the user if they are setting a maximum value to the amount of irrigation applied each week. If the user answers "No", then the irrigation rate is determined based on plant water demand (PET or potential evapotranspiration).
- User defined maximum irrigation application rate: This defines the maximum irrigation rate applied to the irrigation area during the irrigation season. If the rate exceeds the PET, the irrigation rate is the PET. Units are in inches/week. Guidance on watering lawns and turf, including recommended irrigation rates, are found at [1].
- Irrigation season start month: This is the starting month of the irrigation season (i.e. the first month during which water stored in the storage container is used for irrigation).
- Irrigation season end month: This is the ending month of the irrigation season. After this month runoff is either collected and stored in the storage container until the next irrigation season or bypasses the system.
- Does the system go offline during the off season?: This is a YES/NO question. Answering YES means that the system goes off line during months outside of the irrigation season. The reuse storage device is emptied at the end of the irrigation season and any runoff generated bypasses the system. Answering NO means that the storage device will continue to collect runoff during the off season until it fills. This runoff will then be available at the start of the next irrigation season. Typically, the answer will be "Yes" for a cistern and "No" for a pond.
- Is water retained on-site for non-irrigation uses?: This is a YES/NO question. Answering "Yes" allows the user to specify a volume of water taken from storage and used for non-irrigation purposes, such as toilet flushing.
- Weekly water volume retained for non-irrigation uses: This is the weekly volume of water retained for uses other than irrigation, such as toilet flushing. Units are cubic feet per week.
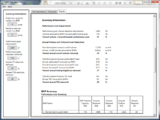
- BMP Summary Tab: The BMP Summary tab summarizes the volume and pollutant reductions provided by the specific BMP. It details the performance goal volume reductions and annual average volume, dissolved P, particulate P, and TSS load reductions. Included in the summary are the total volume and pollutant loads received by the BMP from its direct watershed, from upstream BMPs and a combined value of the two. Also included in the summary, are the volume and pollutant load reductions provided by the BMP, in addition to the volume and pollutant loads that exit the BMP through the outflow. This outflow load and volume is what is routed to the downstream BMP if one is defined in the Watershed tab. Finally, percent reductions are provided for the percent of the performance goal achieved, percent annual runoff volume retained, total percent annual particulate phosphorus reduction, total percent annual dissolved phosphorus reduction, total percent annual TP reduction, and total percent annual TSS reduction.
Methodology
Required Treatment Volume
Required treatment volume, or the volume of stormwater runoff delivered to the BMP, equals the performance goal (1.1 inches for MIDS or user-specified performance goal) times the impervious area draining to the BMP. This value also includes any left over water routed to this BMP from upstream BMPs. This stormwater is delivered to the BMP instantaneously.
Volume Reduction
The volume reduction achieved by a BMP compares the capacity of the BMP to the required treatment volume. The Volume reduction capacity of BMP [V] is calculated using BMP inputs provided by the user. The harvest and re-use/cistern BMP achieves volume reduction through the capture of stormwater runoff into a storage device and the subsequent release of the stored water over an irrigation area or for a non-irrigation use such as toilet flushing. The volume reduction capacity of the BMP (V) that counts toward the performance goal is equal to either the storage capacity of the storage device or the amount of water that is used for irrigation and non-irrigation over a three day period, whichever value is lowest.
V=min[S;AI∗RI∗1556+Vnonirrigation]
Where
- S is the storage volume of the storage container in ft3;
- AI is the irrigation application area in acres;
- RI is the calculated average achieved weekly irrigation rate May-August (inches per week);
- 1556 is a conversion factor; and
- Vnonirrigation is the volume used for non-irrigation purposes, in cubic feet.
May to September was chosen to take into count the peak growing season and provides a higher credit then using the average throughout the irrigation period. The average achieved irrigation application rate is adjusted to a 3 day period between expected rain events and multiplied by the application area.
Analysis of rainfall patterns indicates that a typical time period between precipitation events is 72 hours in Minnesota. Therefore, the irrigation and non-irrigation use is applied over a 3 day time period. Derivation of RI is discussed below.
The Volume of retention provided by BMP is the amount of volume credit the BMP provides toward the performance goal. This value is equal to Volume reduction capacity of BMP [V], calculated using the above method, as long as the volume reduction capacity is less than or equal to Required treatment volume. If Volume reduction capacity [V] is greater than Required treatment volume, then the BMP volume credit is equal to Required treatment volume. This check makes sure that the BMP is not getting more credit than the amount of water it receives. For example, if the BMP is oversized, the user will only receive credit for Required treatment volume routed to the BMP.
Calculating irrigation rates
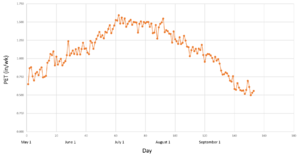
Two methods are used to calculate irrigation rate. The first is based on plant water demand, called potential evapotranspiration (PET). A daily rate was calculated using data collected from the University of Wisconsin Extension. Daily PET rates between January 1, 2000, and December, 2015 were compiled in an Excel spreadsheet. Data for 11 locations in Minnesota was compiled individually for each location. The locations were Bemidji, Thief River Falls, Moorhead, Marshall, Morris, St. Cloud, Rochester, Hibbing, Minneapolis, Brainerd, and Duluth. Data for January, February, and December were discarded. The average daily PET was calculated for each location using the long-term data. State zip codes were then associated with one of these locations. Thus, when a user enters a zip code in the MIDS calculator, the PET record for that location is associated with the PET data for one of the ten cities. The Excel spreadsheet containing this information is File:ET data.xlsx. The weekly irrigation rate is based on the average achieved irrigation application rate from May through September.
The second method is based on the user defined maximum daily irrigation rate. This is input as a constant value during the specified irrigation period.
Irrigation rates from the two methods are compared on a daily basis. The lower of the two values is chosen as the irrigation rate for that day.
((RI/7)∗3∗Ai∗43560)/12
Where
- RI is the calculated average achieved weekly irrigation rate May-August (inches per week) and
- Ai is the application area (acres)
May to September was chosen to take into count the peak growing season and provides a higher credit then using the average throughout the irrigation period. The average achieved irrigation application rate is adjusted to a 3 day period between expected rain events and multiplied by the application area.
On a day in which it rains, irrigation can occur such that rainfall plus irrigation for that day equals RI. For example, if PET is 0.90 inches per week, this would be 0.129 inches per day. If the user defined maximum was 1 inch per week, this would be 0.143 inches per day. The lower value is the PET and that would be used to compute irrigation applied that day. If 0.1 inches of rain fell that day, then (0.129 - 0.100) = 0.029 inches of water could be applied as irrigation on that day.
Finally, irrigation rates are adjusted for crop type (1, 3). The irrigation rate is multiplied by the following coefficients to give the final irrigation rate.
- Turf = 0.95
- Vegetables = 0.95
- Forages = 0.85
- Cereals = 0.75
- Trees = 1.0
Pollutant Reduction
Pollutant load reductions are calculated on an annual basis. Therefore, the first step in calculating annual pollutant load reductions is to determine an annual volume reduction based on the design parameters. This is accomplished through a daily time step water balance imbedded within the MIDS calculator. The water balance tracks watershed runoff, the reuse storage volume that is available, the amount of watershed runoff that bypasses the storage system, and the application volume. Runoff is routed to the storage device until it is filled. Once filled, overflow water bypasses the system. Water is released from the storage device during the irrigation period at a flow equal to the irrigation rate times the irrigation area, during days that precipitation does not happen. Irrigation only occurs if water is present in the storage device. If the volume of water present in the storage device on a particular day is less than the irrigation rate only the volume of water present in the storage device will be removed from the storage device via irrigation. At the end of the irrigation season, water either remains in the storage device while runoff is continually collected or the storage device is emptied and all runoff bypasses the system. This is dependent on the answer to the question Does the system go offline during the off season.
Daily watershed runoff volumes were generated for a 10 acre site using the P8 model, during precipitation and snowmelt events over a 30 year period (years 1974 – 2004). The average annual precipitation throughout the 30-year period used for the P8 modeling was 28.8 inches. The modeled daily runoff values are adjusted to match site conditions based on the size of the contributing watershed and the annual average precipitation for the site. The adjustment factor is given by
adjustment=AW/(10acres)∗PA/(28.8inches)
Where
- AW is the contributing watershed area, in acres, to the harvest and re-use/cistern BMP; and
- PA is the annual average precipitation amount, in inches, based on the zip code of the site.
- The resulting daily runoff values adjusted for the site watershed area and annual precipitation are used in the water balance. The water balance is used to calculate the annual volume reduction, which is equal to the annual average volume of water used for irrigation divided by the total annual average runoff volume.
- All pollutants in the stormwater used for irrigation are 100 percent removed. Any water that bypasses the re-use system or is not used for irrigation results in a 0 percent pollutant removal.
NOTE: The user can modify event mean concentrations (EMCs) on the Site Information tab in the calculator. Default concentrations are 54.5 milligrams per liter for total suspended solids (TSS) and 0.3 milligrams per liter for total phosphorus (particulate plus dissolved). The calculator will notify the user if the default is changed. Changing the default EMC will result in changes to the total pounds of pollutant reduced.
Routing
Overflow from a harvest and re-use/cistern BMP can be routed to any other BMP, except for a green roof, a swale side slope, and any BMP in a stormwater treatment sequence that would cause stormwater to be rerouted back to the harvest and re-use/cistern BMP already in the treatment sequence. All BMPs can be routed to a harvest and re-use/cistern BMP.
Assumptions for harvest and re-use/cistern
The following general assumptions apply in calculating the credit for harvest and re-use/cistern BMP. If these assumptions are not followed the volume and pollutant reduction credits cannot be applied.
- The re-use system is constructed and design according to design criteria.
- The irrigation area can accept water at the irrigation rate defined.
Harvest and re-use/Cistern Example
This example was completed using Version 2 of the Calculator.
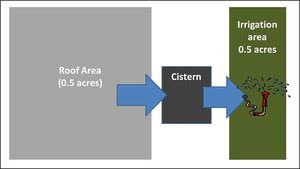
A cistern is going to be constructed to collect runoff from a 0.5 acre roof. The cistern will be constructed to hold 1995 cubic feet of water and will irrigate a 0.5 acre lawn area at an average irrigation rate of 1 inch per week. Irrigation will occur from May through September after which the cistern will drain completely and not collect runoff during the off season. The following steps detail how this system would be set up in the MIDS calculator.
Step 1: Determine the watershed characteristics of your entire site. For this example we have a 0.5 acre site with all 0.5 acres being impervious. The entire roof area is draining to a cistern. The cistern area and irrigation area are not included in the watershed because runoff from these two areas do not drain into the cistern BMP.
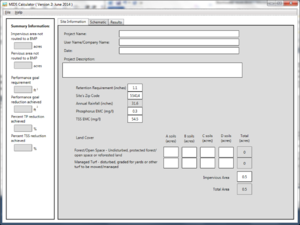
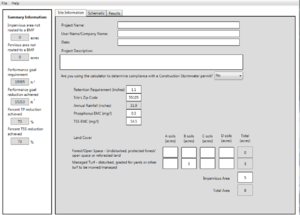
Step 2: Fill in the site specific information into the Site Information tab. This includes entering a Zip Code (55414 for this example) and the watershed information from Step 1. Zip code and impervious area must be filled in or an error message will be generated. Other fields on this screen are optional.
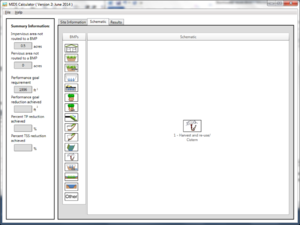
Step 3: Go to the Schematic tab and drag and drop the Harvest and re-use/Cistern icon into the Schematic Window.
Step 4: Open the BMP properties for the Cistern by right clicking on the Harvest and re-use/Cistern icon and selecting Edit BMP properties, or by double clicking on the Harvest and re-use/Cistern icon.
Step 5: If help is needed, click on the Minnesota Stormwater Manual Wiki link or the Help button to review input parameter specifications and calculation specific to the Harvest and re-use/Cistern BMP.
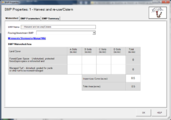
Step 6: Determine the watershed characteristic for the cistern. For this example the impervious area is draining to the cistern. The watershed parameters therefore include a 0.5 acre site, all of which is impervious. Fill in the BMP specific watershed information (0.5 acres on impervious cover).
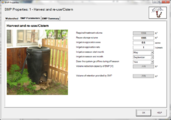
Step 7: Enter in the BMP design parameters into the BMP parameters tab. Harvest and re-use/Cistern requires the following entries:
- Reuse storage volume equal to the cistern volume of 1995
- Irrigation application area equal to 0.5 acres
- Irrigation application rate of 1 inch/week
- Irrigation start month equal to May
- Irrigation end month equal to September
- Does the system go offline during off season – Yes
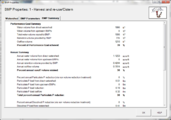
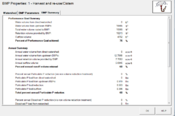
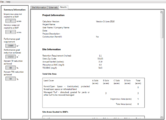
- MIDS calculator screen shots for inputs for harvest and reuse. Click on an image for enlarged view.
Step 8: Click on BMP Summary tab to view results for this BMP.
Step 9: Click on the OK button to exit the BMP properties screen.
Step 10: Click on Results tab to see overall results for the site.
Harvest and re-use/pond Example (Version 3)
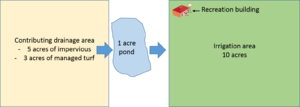
A 1-acre stormwater pond is used to irrigate a 10 acre ballfield and provide water for toilet flushing for a recreation building located at the ballfield. The pond collects runoff from 5 acres of impervious surface and 3 acres of turf on B soils. The pond has a 5-foot deep permanent pool, resulting in 2 feet of water that can be withdrawn for irrigation in order to maintain a minimum pool depth of 3 feet. The maximum irrigation rate is 1 inch per week. Irrigation will occur from May through September. The following steps detail how this system would be set up in the MIDS calculator.
Step 1: Determine the watershed characteristics of your entire site. For this example we have an 8 acre acre site draining to a 1 acre pond. The contributing area to the pond consists of 5 acres of impervious surface and 3 acres of turf on B soils.
Step 2: Fill in the site specific information into the Site Information tab. This includes entering a Zip Code (55105 for this example) and the watershed information from Step 1. Zip code and impervious area must be filled in or an error message will be generated. The user must also indicate whether the calculator is being used to determine compliance with the Construction Stormwater permit. In this case the answer to this question is no. Other fields on this screen are optional.
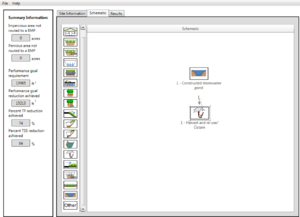
Step 3: Go to the Schematic tab and drag and drop the Constructed stormwater pond icon into the Schematic Window. Go to the Schematic tab and drag and drop the Harvest and re-use/Cistern icon into the Schematic Window.
Step 4: Open the BMP properties for the pond by right clicking on the Constructed stormwater pond icon and selecting Edit BMP properties, or by double clicking on the Constructed stormwater pond icon.
Step 5: If help is needed, click on the Minnesota Stormwater Manual Wiki link or the Help button to review input parameter specifications and calculation specific to the Constructed stormwater pond BMP.
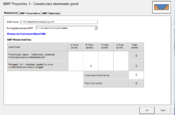
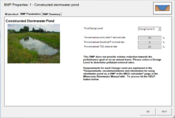
Step 6: Determine the watershed characteristic for the pond. For this example the entire impervious and pervious area is draining to the pond. The watershed parameters therefore include 5 acres of impervious surface and 3 acres of pervious turf on B soils. Fill in the BMP specific watershed information (5 acres on impervious cover and 3 acres on Managed turf and B soils). Route the pond to the Harvest and re-use/Cistern. Click on the BMP Parameters tab and select Pond Design Level 2 from the dropdown menu. For information on pond level designs, link here.
Step 7: Open the BMP properties for the harvest and use/reuse BMP by right clicking on the Harvest and re-use/Cistern icon and selecting Edit BMP properties, or by double clicking on the Harvest and re-use/Cistern icon.
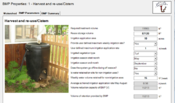
Step 8: Since the stormwater runoff has already been routed to the pond (Step 6), do not enter anything on the Watershed tab. Enter in the BMP design parameters into the BMP parameters tab. Harvest and re-use/Cistern requires the following entries:
- Reuse storage volume. Storage occurs in a 1 acre pond with 2 feet of available water depth, for a volume of 87120 cubic feet
- Irrigation application area equal to 10 acres
- Irrigation maximum application rate of 1 inch/week
- Irrigated vegetation type is turf
- Irrigation start month equal to May
- Irrigation end month equal to September
- Does the system go offline during off season – No (pond is in use throughout the year)
- Water retained on site for non-irrigation uses equal the volume of water used for toilet flushing equal 15 cubic feet per week
- MIDS calculator screen shots for inputs for harvest and reuse. Click on an image for enlarged view.
Step 9: Click on BMP Summary tab to view results for this BMP.
Step 10: Click on the OK button to exit the BMP properties screen.
Step 11: Click on Results tab to see overall results for the site.
Links to MIDS pages
- Overview of Minimal Impact Design Standards (MIDS)
- Performance goals for new development, re-development and linear projects
- Design Sequence Flowchart-Flexible treatment options
- Community Assistance Package
- MIDS calculator
- Performance curves for MIDS calculator
- Training and workshop materials and modules
- Technical documents
Related pages
- Overview for stormwater and rainwater harvest and use/reuse
- Design criteria for stormwater and rainwater harvest and use/reuse
- Construction specifications for stormwater and rainwater harvest and use/reuse
- Operation and maintenance for stormwater and rainwater harvest and use/reuse
- Water quality considerations for stormwater and rainwater harvest and use/reuse
- Environmental concerns for stormwater and rainwater harvest and use/reuse
- Cost-benefit considerations for stormwater and rainwater harvest and use/reuse
- Case studies for stormwater and rainwater harvest and use/reuse
- Calculating credits for stormwater and rainwater harvest and use/reuse
- Definitions for stormwater and rainwater harvest and use/reuse
- Requirements, recommendations and information for using Harvest and re-use/cistern as a BMP in the MIDS calculator
- Links for stormwater and rainwater harvest and use/reuse
- References for stormwater and rainwater harvest and use/reuse
- Technical support for stormwater and rainwater harvest and use/reuse
This page was last edited on 28 January 2023, at 22:47.

