Difference between revisions of "Interpreting wasteload allocations based on flow/load duration curves"
(Created page with "File:Flow duration curve.png|300px|thumb|alt=image of flow duration curve}<font size=3>Example of a flow duration curve ([https://pubs.usgs.gov/wsp/1542a/report.pdf Searcy,...") |
m |
||
| Line 1: | Line 1: | ||
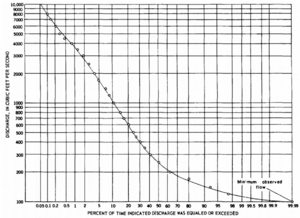
| − | [[File:Flow duration curve.png|300px|thumb|alt=image of flow duration curve | + | [[File:Flow duration curve.png|300px|thumb|alt=image of flow duration curve|<font size=3>Example of a flow duration curve ([https://pubs.usgs.gov/wsp/1542a/report.pdf Searcy, 1959]</font size>]] |
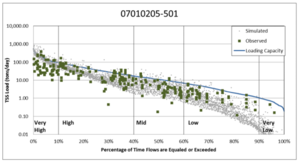
[[File:Load duration curve.png|300px|thumb|alt=image load duration curve|<font size=3>TSS load duration curve for Buffalo Creek in Minnesota. From [https://www.pca.state.mn.us/sites/default/files/wq-iw8-52e.pdf South Fork Crow River Watershed Total Maximum Daily Load Report]]</font size>]] | [[File:Load duration curve.png|300px|thumb|alt=image load duration curve|<font size=3>TSS load duration curve for Buffalo Creek in Minnesota. From [https://www.pca.state.mn.us/sites/default/files/wq-iw8-52e.pdf South Fork Crow River Watershed Total Maximum Daily Load Report]]</font size>]] | ||
Revision as of 15:52, 23 October 2019


]]
Flow duration curves use historical records to relate flow values in a stream or river to the percent of time those values have been met or exceeded. The curves show flow from high to low along the X-axis and the percent of time when that flow is exceeded on the Y-axis. Flow duration curves are often divided into different flow regimes. For example, a curve could be divided into 3 regimes based on percent likelihood of exceedance. The three regimes could each account for 33.3 percent of the curve and be labeled as low, medium, and high flow regimes. Low flows are exceeded a majority of the time, while high flows are exceeded infrequently.
Load duration curves are similar to flow duration curves but instead relate pollutant loads in a stream or river to the percent of time those values have been met or exceeded. Load duration curves represent the acceptable pollutant loading across a range of flows. Load duration curves are generated by multiplying the water quality standard by the flow. This provides the acceptable load. Monitored values exceeding the allowable load represent a water quality exceedance.
For total maximum daily loads (TMDLs), load duration curves are primarily used for total suspended solids (TSS) and bacteria (total fecal coliforms or E. coli). Typically, five flow or load regimes are used (very low, low, mid, high, and very high). The flows these correspond with vary depending on the entity developing the curve. As example, in the adjacent image, very low and very high correspond with the lowest and highest 10 percent of flows, respectively, mid flows correspond with flows in the 40-60 percent range, and low and high flows correspond with 10-40 and 60-90 percent of the flows, respectively.
Interpreting wasteload allocations (WLAs) from load duration curves can be challenging for a MS4 (Municipal Separate Storm Sewer System) permittee. These challenges include the following.
- Permittees typically manage their area as a single system and do not implement best management practices (BMPs) based on flow in a receiving water.
- Stormwater BMPs are generally ineffective at high rainfall intensities, which typically correspond with high and very high flow regimes.
- The effect of stormwater practices that retain water on the landscape, such as infiltration, are not accounted for in the high and very high flow regimes.
- Surface runoff dominates on the rising limb of the hydrograph, regardless of how high the flows were before the event began.
Recommendation for interpreting load duration curves for MS4 permittees
For most TMDLs, the Minnesota Pollution Control Agency (MPCA) recommends using the mid value for the WLA. Justification for this is based on the following.
- In- and near-stream erosion processes are likely to dominate pollutant loading at high and very high flows. These are not directly impacted by stormwater management practices. However, increased runoff occurs for high intensity or long long duration storms, potentially resulting in increased delivery of runoff volumes to a receiving stream or river. Practices that retain water on the landscape (e.g infiltration) or slow the release of runoff (e.g. constructed ponds and wetlands, many filtration practices) reduce erosion associated with in- and near-stream processes. These effects are generally not accounted for in load determinations (e.g. models) when setting TMDLs. Consequently, these practices are not properly credited at high and very high flows.
- Stormwater BMPs are typically designed to capture an instantaneous volume. The adjacent image shows that stream hydrographs typically show a lag a several hours to more than a day before achieving peak flow. In the absence of very large rainfall events, sustaining peak flows at high and very levels requires extended periods of rainfall or snowmelt. For these extended periods of rainfall and snowmelt, BMPs designed to treat an instantaneous volume will typically be overdesigned and thus under-credited since they will release water gradually (e.g. through infiltration), resulting in increased capture of runoff.
- Most stormwater BMPs are designed to treat small and moderate storms. These practices do not effectively treat large events. It
Suggested reading
- What is a Flow Duration Curve?
- Flow-Duration Curves, James K. Searcy, Manual of Hydrology: Part 2. Low-Flow Techniques (GEOLOGICAL SURVEY WATER-SUPPLY PAPER 1542-A)
- Flow duration curves