Difference between revisions of "Technical Paper 40 rainfall frequency maps"
m |
m |
||
| Line 13: | Line 13: | ||
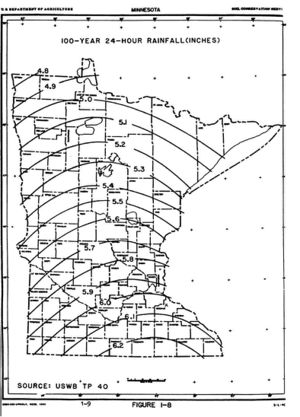
[[File:100 year 24 hour rainfall.jpg|300 px|alt=map showing 100-year 24-hour rainfall distribution across Minnesota|map showing 1-year 24-hour rainfall distribution across Minnesota]] | [[File:100 year 24 hour rainfall.jpg|300 px|alt=map showing 100-year 24-hour rainfall distribution across Minnesota|map showing 1-year 24-hour rainfall distribution across Minnesota]] | ||
| − | [[Category:Level | + | [[Category:Level 3 - General information, reference, tables, images, and archives/Images/Maps]] |
Revision as of 22:19, 19 December 2022
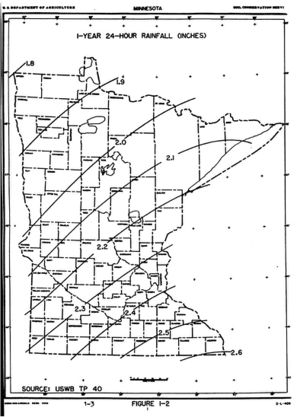
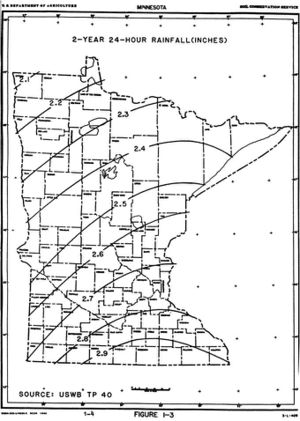
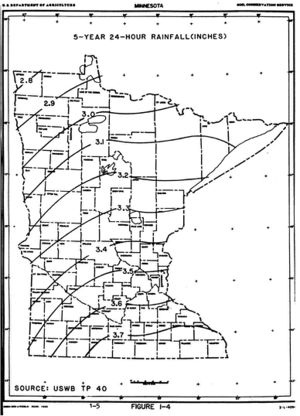
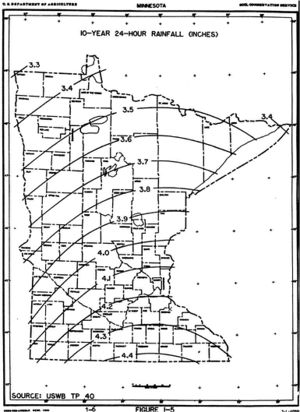
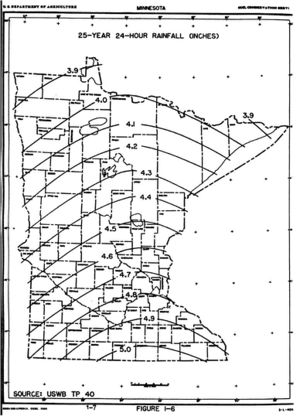
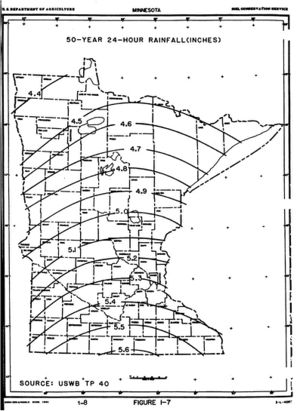
Rainfall frequency maps from Technical Paper 40
Caution: Precipitation frequency information (Atlas 14) has been updated by the National Oceanic and Atmospheric Administration (NOAA). We recommend using Atlas 14.
To see a comparison of Atlas 14 and TP-40, link here.
