Winter Parking Lot and Sidewalk Maintenance Manual
Background Information
Good Business Choices
Customer service is the key to success. Best Management Practices (BMP) keep parking lots and sidewalks safe and also reduce environmental impacts. Educating customers on the proper methods of snow removal and ice control (and of the value of this approach) can create a good and long-standing relationship.
Customers want reliable service. Providing a well-planned and well-executed winter maintenance program will have a positive impact. Using the latest technologies will increase the abilty to provide reliable service.
Customers want to hire educated winter maintenance professionals. This maunal will provide the necessary information to increase staff knowledge on the best practices for winter maintenance.
Using the right amount of material at the right time, will save time and money.
Certification in Smart Salting is a good reflection on the professional and the organization.
Customers and the public want safe parking lots and sidewalks. Understanding the materials, weather and application rates, provide a head start on controlling icy, slippery parking lots, and sidewalks.
Clean and neat parking lots and sidewalks are important to the public. By using less material and increased winter sweeping, pedestrians will track less material into buildings and there will be less damage to flooring. Proper snow storage makes debris removal in the spring easier. Covered storage of deicers will reduce loss of material, protect water, and is more aesthetic. Using BMPs and lower application rates will keep parking lots and sidewalks looking neat.
Customers also want affordable snow and ice control. The use of sophisticated chemicals and equipment may require a larger budget up-front; however, these costs can be balanced by reduced on-going costs. Reducing the need for sweeping, floor and rug maintenance, parking lot striping, and snow and ice maintenance time will allow for cost savings.
Minnesotan’s value water resources and the protection of lakes, streams, and wetlands is important. Educating customers how sustainable winter maintenance protects water resources is necessary.
Using less material is an effective approach to protecting our water resources. It is difficult to recover salt or sand once applied.
Water and Environmental Impacts
- Only 2.5% of all of the water on this planet is freshwater (not saltwater). Of that, less than 1% is available for use. The majority of the freshwater is frozen in the glaciers (Freshwater Crisis n.d.).
- Water is recycled over long periods of time. There is a limited supply of water on this planet. Water is reused, recycled and dispersed as illustrated below from the Minnesota Department of Natural Resources (DNR), “Healthy Rivers: a Water Course” (Healthy Rivers 2004).
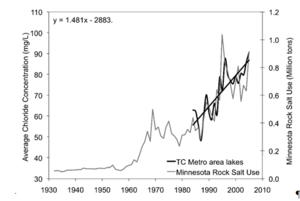
Chloride concentrations are increasing in many surface waters and groundwater across Minnesota.
- In the Twin Cities Metropolitan Area (TCMA), of surface water bodies tested, 39 are on the draft 2014 impaired waters list for chloride exceedances and 38 more are found to be at high risk as of July 2015. (MPCA 2015). Salts (chloride) dissolve in water and move with the water to nearby lakes, streams, and wetlands and also infiltrate into groundwater.
- Chloride is virtually a permanent pollutant that does not degrade and cannot be removed from surface waters. Once in the water, it continues to accumulate in the environment over time.
- Salt water is heavier than freshwater and may sink to the bottom of lakes. This may cause chemical stratification of the lake and loss of or changes in lake turn over (Stefan et al. 2008).
- Thirty percent of the 270 shallow aquifer monitoring wells tested in the TCMA exceeded the state chloride standard. (MPCA 2013).
- About 75% of Minnesotans rely on groundwater for drinking water. The MPCA has found 30% of the shallow monitoring wells, often found in urban areas, have exceeded the state standard for salt levels. As water moves from shallow to deeper aquifers, the salt contamination could penetrate sources of drinking water (MPCA 2013).
- The average salt use in the TCMA based on purchasing records is 349,000 tons per year (Sander et al. 2007).
Deicers can be very damaging to both soil and vegetation. Efforts to keep salt off vegetation are needed: drive slower when applying deicers, turn down spinner speed to reduce spread pattern, use drop spreaders on sidewalks, store snow piles on hard surfaces, and reduce application rates. One source of information about salt-tolerant plants is the Plant Selector from Minnesota Department of Transportation.
Impacts of Materials
Abrasives and deicers cause problems to infrastructure, drainage, water, vegetation, and soils when used in large quantities. Abrasives: Winter Sand
- Runs off parking lots with water to the nearest storm drain entering lakes, wetlands, streams, and rivers.
- Fills in surface water bodies, accelerating the aging process.
- Covers habitat and disrupts the food chain.
- Irritates the gills of fish.
- Clogs and disrupts the flow of water in storm drain systems.
Deicers are not "environmentally safe" regardless of what the bag says.
Chlorides commonly used for deicing are Sodium Chloride (road salt), Magnesium Chloride, Calcium Chloride, and Potassium Chloride.
- Road salt is the least expensive and most widely used deicer.
- Salt is corrosive to steel.
- Some have corrosion inhibitors and anti-caking agents added that are often toxic.
- Frequently damage plants through contact or by interfering with soil properties.
- Salt can cause soil to lose its ability to retain water, leading to soil erosion.
- Excess salt can make soil more alkaline and compact, and less permeable, making it more difficult to store nutrients that plants need to grow.
- Cannot be removed by stormwater ponds or rain gardens.
- Cannot be removed from the lakes, wetlands and rivers.
- Are persistent pollutants and will not break down over time.
About one teaspoon of salt can pollute five gallons of water. This applies to all chloride containing deicers.
Acetates:
- Are non-chloride compounds.
- Are an organic substance.
- When added to water, compete with aquatic life for oxygen.
- Contribute nutrients which promote algal blooms in lakes and ponds.
- Most of the problems they cause in the water are relatively short term, but severe.
- Are usually safer for vegetation.
- Are less corrosive than salts.
- Have the potential to be treated by stormwater BMPs.
Acetates can have a high biological oxygen demand (BOD), and can contribute to oxygen depletion in soil and water. Use carefully.
Plant-based additives (beet, corn, molasses):
- These additives do not contribute chloride to water but contribute nutrients (fertilizer).
- Cause an increase aquatic plant and algae growth.
- Use up oxygen in the lake or water body as they decompose.
- Serious impacts but not as long-lasting as chloride.
One lb. of phosphorus encourages growth of up to 500 lbs. of algae. Phosphorus is in plant-based products.
Twin Cities Metropolitan Area Chloride (TCMA) Management Plan
There are two primary sources of chloride to Minnesota water resources: 1) salt applied to roads, parking lots, and sidewalks for deicing; and 2) water softener brine discharges to municipal wastewater treatment plants (MPCA 2015). To address chloride impacts to Minnesota water resources, the MPCA worked with local stakeholders to develop a Chloride Manageme6nt Plan designed specifically to minimize chloride use across the seven counties of the metropolitan area. This plan is intended to be useful for all winter maintenance practices. The plan can be located on the MPCA’s website: http://www.pca.state.mn.us/programs/roadsalt.html
1 ton of rock salt ($50) causes greater than $1,450 in corrosion damage to bridges. (Sohanghpurwala 2008)
Fathead Minnows will die if exposed to chloride concentrations of 443 mg/l for more than 30 days (Axler n.d.)
Prepare for Winter Operations
Policies/Plans
Start now—develop a maintenance policy or plan that guides winter operations. A little planning and communication up-front can help achieve better results throughout the season.
- Develop a maintenance policy or plan.
- Review the maintenance policy with the crew.
- Inform customers of the maintenance policy.
- In the plan:
- list the key actions to take during a winter event
- list the order of these actions
- address the level of service
- consider customer expectations, the hours and use of the building, priority access points and environmental concerns in the policy
- spell out any additional strategies such as routes, chemicals, application rate ranges etc.
- Follow the plan.
- Document actions.
- Review and update the maintenance policy each year.
Our waters are threatened by contracts which are based on fees for material use. This encourages overuse of materials.
Reduce liability. Establish a maintenance policy and follow it.
Training
Reduce risk by having a solid written winter maintenance policy and training program that utilizes best management practices. Schedule training for supervisors, staff, and customers.
The MPCA has three Smart Salting training classes available:
- Level 1 Winter maintenance of roads
- Level 1 Winter maintenance of parking lots/sidewalks
- Level 2 winter maintenance training for supervisory staff
Check the MPCA website to find out about upcoming training opportunities.
Storage
Snow Piles:
- Store in an area where the solids can be recovered after the snow melts.
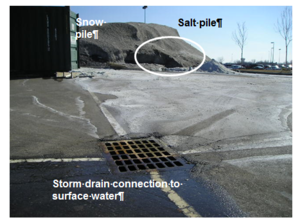
- Locate snow piles down-slope from salt and sand storage to prevent snow melt from flowing through salt or sand storage areas.
- Avoid pushing snow into lakes, ponds, wetlands, rivers, or other natural areas.
Improper storage of salts can lead to groundwater cantamination
Salt and Salt/Sand Piles:
- Storage areas often cause groundwater or surface water contamination. These problems can be easily tracked back to the source. Do not skimp on proper storage. When locating new storage for liquid or granular products investigate local visual screening ordinances.
- Indoor storage is recommended.
- Store on an impervious (water proof) surface.
- Floor should be sloped away from the door.
- Sweep loading areas back into the pile.
- Store away from lakes, rivers, ditches, storm drains, and wetland edges.
Salt storage areas are often a source of groundwater contamination. To reduce risk, have a covered storage area on an impervious pad. Take measures to keep salt or salt brine from leaving storage area.
A common mistake is storing a salt pile downhill from a snow pile
Salt Bags:
- Protect from rain or snow.
- Dispose of bags properly.
- Seal all open bags.
Liquids:
- Know the freezing point of the liquid. This will determine if it can be stored outdoors. Salt brine (NaCl) will freeze at -6o F.
- Tanks should be double-walled or have secondary containment. Secondary containment is like creating a bath tub around the tank so if the tank leaks, the “tub” captures the spill.
- Label the tank documenting its contents.
- For more information on storage tanks see www.pca.state.mn.us/cleanup/ast.html
Sand piles:
- Winter sand is typically mixed with some deicer to prevent freeze-up of the pile; therefore, sand pile storage should be the same as salt pile storage.
- Store leftover winter sand for next year. Do not use it for other purposes.
Prevent groundwater contamination. Do not locate storage areas near wells. Limestone regions with fissures and sinkholes are very prone to groundwater contamination, as are those with sandy soils.
Weather =
Know existing and potential weather conditions for a successful snow and ice control operation. Monitor the weather closely to prepare to act early in storm situations. Check the National Weather Service http://www.noaa.gov, local TV stations, or website weather. A Road Weather Information System (RWIS) is available for [http://www.rwis.dot.state.mn.us/ free on-line} at. The RWIS provides real time pavement temperatures and other information from locations around the state.
Pavement Temperature
Pavement and air temperature are different. Know the pavement temperature to determine the proper amount and type of material to apply. Weather stations report air temperature which is measured at least 6 ft. in the air. The air temperature is not helpful when trying to determine what to apply to surfaces on the ground.
Air temperature measurements are generally the same in a given area, but pavement temperatures in the same general location can vary greatly. Pavement temperatures are influenced by exposure to sun, pavement type, and subsurface materials.
The same air temperature in November and January will often accompany very different pavement temperatures.
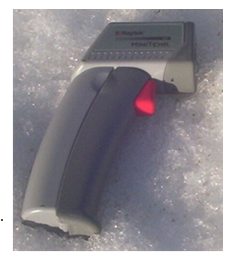
The hand-held temperature sensors can be purchased from auto part stores for less than $100. Some temperature sensors only accurately monitor in the warm temperature range, confirm the one purchased measures in the cold temperature range. Mirror-mounted temperature sensors are also available; they are less likely to be lost or stolen, but do cost more and are generally not available at an auto parts store. RoadWatch by Commercial Vehicle Group, Inc. is one example of this type of sensor. A small investment in equipment will improve performance.
Knowing the pavement temperature allows the application of the proper amount of material for each situation.
Getting prepared for winter
- Calculate the area of the parking lots, service roads, and sidewalks.
- Understand the environmental problems caused by snow, salt, and sand storage. Determine where and how to best store each item.
- Understand the properties of various deicers, and then select the type(s) to use.
- Train the crew on proper application rates.
- Mark islands, fire hydrants, and other landmarks that could be obscured by snow.
- Note existing conditions of curbs and other items that might be damaged by winter maintenance activities.
- Note or mark all catch basins, manholes, sidewalk segments that may cause a hazard to the plow and the operator.
Drainage
Inspect storm drains in the fall. Remove obstructions such as leaves, sticks, and trash to prepare for the spring melt. Because storm drains lead to lakes, rivers, ponds, and wetlands, never use salt to open frozen storm drains. Salt used to thaw frozen drains harms aquatic life. Use non-chemical methods such as heat to open drains.
Poor drainage on the maintenance surfaces will result in icy surfaces and will increase the risk of safety problems. These areas cause the application of salt on non-snow event days in the winter. To remedy this, inventory the site and note drainage problems. Make a checklist so the professional or client can fix these drainage problems in the summer.
Examples of drainage problems:
- Roof that drips on the steps
- Downspout discharging on sidewalk
- Sidewalk segments sloped into a V
- Potholes or low spots in parking lots
Storm drains lead to the nearest lake, river, pond, or wetland. They do not go to a treatment plant.
Equipment
The trend in winter maintenance is to use less material to accomplish the same results. Following this trend will reduce environmental impacts and save money. Below are listed a few tips, but there are many other innovations in the equipment area that can help to reduce application rates.
- Purchase a pavement sensor (Figure 8)
- Buy equipment that can deliver very low rates of granular products.
- Outfit larger trucks with ground speed controls so that the application rate changes automatically as the speed changes.
- Modify existing equipment so that it can discharge the application rates described in the “Application Rates” section. Older equipment often applies more salt than recommended.
- Outfit sidewalk spreaders with shields to better direct the spread pattern.
- Invest in equipment that can deliver liquid deicers.
- Obtain a tank for liquid storage or find a near-by source of liquids to fill up trucks.
Calibration
Calibration is an essential procedure to understand how much material will be discharged at a given setting. No matter how sophisticated or simple the operation, calibrate each piece of equipment in the fall of the year.
Calibration tells how much material will be applied at each setting.
Simple Calibration for Salt Spreaders=
If the equipment has different settings, it must be calibrated for each setting and for each product, as they all flow differently. It generally takes a team of two or three people to calibrate equipment efficiently.
Ground Speed Controlled Spreaders
Ground speed controlled spreaders are run by a computer in the cab and are tied to the speedometer and an auger or conveyor sensor in the rear of the truck. The application rate is set and the computer regulates the amount of salt discharged (regardless of the speed traveled) consistently. Most equipment used for winter maintenance of roads have ground speed controls. These are more effective and efficient systems than the manually controlled systems.
The equipment vendor will have specific calibration instructions for the operation based the type and brand of equipment. Contact them; it is in their best interest to provide instructions to calibrate and correct product use. This is the basic principle behind calibrating a ground speed controlled spreader:
- The speedometer input (sensor) lets the controller know how fast or slow the truck is traveling.
- The auger or conveyor input (sensor) tells the controller how fast or slow the auger is turning.
- To calibrate a ground oriented controller, input the pounds discharged per revolution.
- Once the computer knows the pounds/ revolution, it will calculate the necessary auger speed needed to hit the target application rates at the speed the truck is traveling.
Best bet: Contact manufacturer for calibration instructions.
Calibration allows accurate deicer use
Manual Controlled Spreaders
Manual controlled spreaders fall into two categories. Those that have an auger or conveyor and those that are gravity fed. They operate by selecting a setting that changes the size of the discharge opening and/or the auger or conveyor speed. More or less salt may be discharged depending on the speed of application. Most parking lot and sidewalk spreaders fit into one of these two categories.
All good programs are based on calibration of equipment.
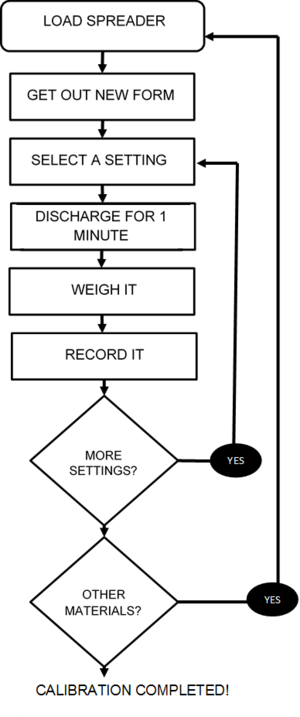
The basic principle behind calibrating an auger/conveyor spreader is to choose a setting, run the spreader for a timed interval, and weigh the discharge. Record the discharge and repeat for all settings. In the end, there will be data that tells the operator how much material will be delivered at each setting. With this information, the operator can choose the proper setting. Without this information, they have no guidance on which setting to use. Calibration is different for gravity fed spreaders. There is more detail on this in a few pages.
Apply wisely. The chemicals applied cannot be recovered.
Surfaces such as pervious asphalt, pervious concrete, and pervious pavers do not experience refreeze. All melted snow and ice travel to the storage layer below the surface. Salt is generally not needed on these surfaces and sand should be avoided.
Example: Step #1, blank calibration form
See the References and Resources section for a full size form to copy for calibration. This is how the empty form looks.(Keep a stack of these on a clipboard when ready to begin the calibration.)
Example: Step #2, calibration form filled out during calibration
Fill in the header information and column 2, the discharge weight per setting.
Example: Step #3, calibration form ready to put in truck for road application'
Back in the shop, do the calculations to fill in the rest of the blanks. Multiply the weight in column 2 with the multiplier in the top row. This provides the pounds per mile that needed to fill in the table.
Some fish species are affected by concentrations of less than 1000 ppm NaCl, about 1 to 1.5 tablespoons of salt in 5 gallons of water.
Example: Step #4, calibration form ready to zip tie to hand spreader or put in truck for parking lot application.
Divide by 63 to convert pounds per lane mile to pounds per 1,000 square feet. This is very useful for parking lot and sidewalk applications.
Gravity Flow Equipment
This is applicable for equipment that does not have a motorized delivery system such as an auger. This type of equipment might be a pickup mounted spreader, gator mounted spreader or a hand push spreader. Gravity flow equipment is typically controlled by gate opening and speed of application.
Step 1: Calculate discharge rate
- Mark out a 10-foot stretch of pavement. (By increasing the size of the test area i.e., the longer the test area, the more accurate the results will be).
- Sweep it clean of sand or any other material.
- Using a constant speed, apply one pass of material to the test area.
- Measure the width the material is spread or bounces, in feet.
- Sweep up and weigh the material that is within the marked 10-foot stretch.
- Record the lever position/setting for the gate/chute. If there are no numbers for the positions, make permanent marks on the equipment to identify the positions.
- To improve accuracy, repeat this two more times and calculate the average weight of material applied.
- Record results in columns A, B, C, and D (Figure 14).
Step 2: Repeat step #1 for various settings.
Step 3: Fill out chart.
- Fill out columns E, F, and G (Figure 14).
- If using more than one type of material, repeat the test for each material.
- Place the completed calibration chart with the equipment.
Shortcuts:
- Put down a tarp over the application area; this makes it quicker to recover and weigh material.
- After the first pass, put a bag around spreader to catch discharge material. The first pass is needed to determine the spread width.
Calculate application rate:
What if calibration is not a practice?
Even without calibrating the equipment, the amount of material to use can be determined but will take more time to calculate. Know the material, the size of the area to be treated, and the pavement temperature, then consult the application rate chart (application rate section) and do the math. Without calibration, the way to evenly distribute the recommended amount across the maintenance area must be determined by the professional. This approach may work well for treating sidewalks using the “chicken feed” method. For example:
- 20oF degrees pavement temperature and rising
- Using dry salt
- Sidewalk is 2,000 square feet
- Table recommends 2.25 lbs. per 1,000 square feet (for this situation)
- Measure about 4.5 lbs. of salt
- Figure out a way to spread it evenly over the 2,000 sq. ft. surface
Sand fills in lake bottoms, accelerating the aging process of lakes. Lakes get shallower as they age, some eventually becoming wetlands.
