![]()
Category:Level 3 - General information, reference, tables, images, and archives/Images/Graphs
Graphs
Information: To determine what page the image can be found on, click on an image to open the page, then in the left toolbar click on What links here.
Media in category "Level 3 - General information, reference, tables, images, and archives/Images/Graphs"
The following 44 files are in this category, out of 44 total.
 Available soil water.jpg 914 × 777; 95 KB
 Available water capacity.png 781 × 510; 124 KB
 Chloride concentrations in runoff.png 1,209 × 642; 71 KB
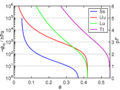
 Conductivity vs water content.png 972 × 452; 53 KB
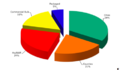 Distribution of road salt use in Twin cities area.PNG 468 × 273; 29 KB
 Example 0.3 in hr.jpg 995 × 601; 70 KB
 Example 0.6 in hr.jpg 997 × 601; 68 KB
 Example 1.63 in hr.jpg 1,001 × 603; 62 KB
 Example particle retention curves.png 736 × 1,061; 293 KB
 Filter strip sizing.png 640 × 937; 262 KB
 Infiltration rate 0.2 inch hr.jpg 975 × 581; 73 KB
 Infiltration rate 0.3 inch hr.jpg 975 × 581; 72 KB
 Infiltration rate 0.6 inch hr.jpg 975 × 581; 73 KB
 Infiltration rate 0.9 inch hr.jpg 975 × 581; 75 KB
 Infiltration rate 1.63 inch hr.jpg 975 × 579; 72 KB
 Penetrometer curve.jpg 633 × 490; 41 KB
 Permeameter samples.png 977 × 630; 37 KB
 Planting technique effect on height of Bosque elm.jpg 738 × 496; 29 KB
 Planting technique effect on trunk diameter of Bosque elm.jpg 729 × 468; 25 KB
 Plot impervious vs water quality volume inches.png 1,007 × 552; 126 KB
 Plot impervious vs watershed inches.png 1,008 × 553; 97 KB
 Plot of construction and maintenance costs for wet basin.png 1,333 × 949; 168 KB
 Pretreament sizing PSD.png 1,313 × 650; 594 KB
 PSD curve.png 1,263 × 772; 365 KB
 Rainfall distribution curves.png 574 × 398; 66 KB
 Snowmelt infiltration based on soil moisture content.png 1,376 × 907; 108 KB
 Soil density.png 1,320 × 475; 187 KB
 Soil enzymes.jpg 666 × 395; 41 KB
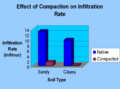 Soil infiltration after compaction.png 1,050 × 783; 103 KB
 Soil moisture characteristic.png 960 × 720; 80 KB
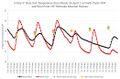 Soil temperature.jpg 1,041 × 683; 125 KB
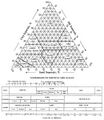 Soil texture triangle.jpg 519 × 599; 88 KB
 Tanner phosphorus reduction graph.png 1,133 × 632; 80 KB
 Unit peak discharge Type 2 rainfall distribution.png 1,500 × 1,131; 314 KB
 Water holding capacity.png 547 × 408; 86 KB


