![]()
Gallery of new files
This special page shows the last uploaded files.
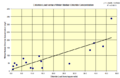
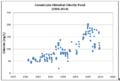
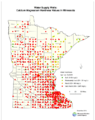
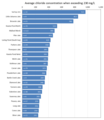
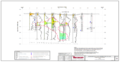
 Relationship between road density and median winter chloride concentration.PNG PLeegar
16:14, 15 March 2016
670 × 421; 14 KB
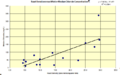
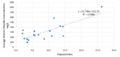
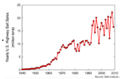
 Relationship between road salt load and median winter stream chloride concentration.PNG PLeegar
16:10, 15 March 2016
670 × 435; 15 KB
 Winter chloride concentrations (November-March) in TCMA lakes versus Osgood Index.PNG PLeegar
16:05, 15 March 2016
639 × 305; 31 KB
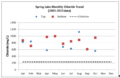 Average monthly chloride concentrations in top and bottom samples in Spring Lake.PNG PLeegar
16:02, 15 March 2016
649 × 420; 33 KB
 Average monthly chloride concentrations in top and bottom samples in Powderhorn Lake.PNG PLeegar
15:59, 15 March 2016
688 × 440; 36 KB
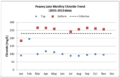 Average monthly chloride concentrations in top and bottom samples in Peavey Lake.PNG PLeegar
15:56, 15 March 2016
655 × 426; 33 KB
 Average monthly chloride concentrations in top and bottom samples in Brownie Lake.PNG PLeegar
15:52, 15 March 2016
652 × 423; 32 KB
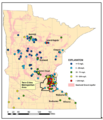
 Chloride concentration trends in Minnesota’s ambient groundwater.PNG PLeegar
15:47, 15 March 2016
602 × 693; 397 KB
 Reasing chloride concentration in surface samples in Gervais Lake from 1983-2014.PNG PLeegar
15:27, 15 March 2016
773 × 522; 54 KB
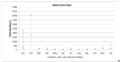
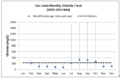 Monthly chloride concentrations (average, maximum, and minimum) in Elm Creek.PNG PLeegar
15:09, 15 March 2016
686 × 447; 42 KB
 Monthly chloride concentrations (average, maximum, and minimum) in Sand Creek.PNG PLeegar
15:04, 15 March 2016
693 × 449; 41 KB
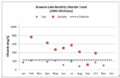
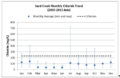
 Monthly average chloride concentations in Battle Creek.PNG PLeegar
20:25, 14 March 2016
496 × 323; 25 KB
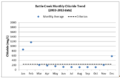
 Monthly average chloride concentations in Bassett Creek.PNG PLeegar
20:22, 14 March 2016
488 × 317; 22 KB
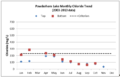
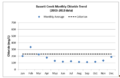
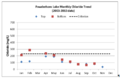 Monthly average chloride concentations in Powderhorn Lake.PNG PLeegar
20:12, 14 March 2016
492 × 318; 23 KB
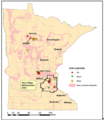
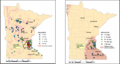
 Hardness values of drinking water supply wells in Minnesota.PNG PLeegar
20:05, 14 March 2016
575 × 728; 242 KB
 Hardness values of drinking water supply wells in the TCMA.PNG PLeegar
19:59, 14 March 2016
569 × 446; 98 KB
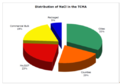 Distribution of NaCl in the TCMA (Figure adapted from Sander et al.PNG PLeegar
19:46, 14 March 2016
517 × 360; 40 KB
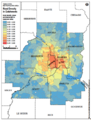
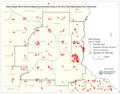
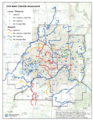
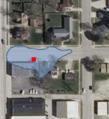
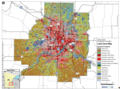 Land Use in the TCMA (based on the National Land Cover Database from 2011.PNG PLeegar
19:40, 14 March 2016
590 × 439; 433 KB
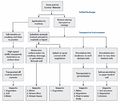
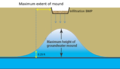
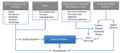 Conceptual model of anthropogenic sources of chloride and pathways.PNG PLeegar
19:38, 14 March 2016
567 × 251; 41 KB
 Chloride concentrations in ambient groundwater from the sand and gravel aquifers.PNG PLeegar
19:34, 14 March 2016
567 × 662; 374 KB
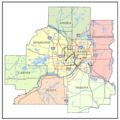
 Comparison of Impaired Lakes and Wetlands in the TCMA.PNG PLeegar
16:47, 14 March 2016
523 × 605; 61 KB
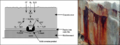

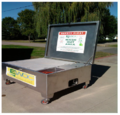
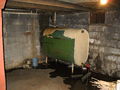
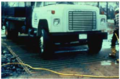 A vehicle wash rack may be needed to remove sediment from tires.PNG PLeegar
22:44, 2 March 2016
501 × 331; 362 KB
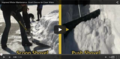
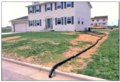
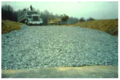
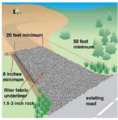 Vehicle tracking pad should be at least 50 feet in length.PNG PLeegar
22:41, 2 March 2016
512 × 520; 453 KB
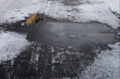
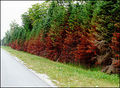
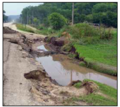 A road near Elba Minnesota, was damaged by flashfloods in August 2007.PNG PLeegar
22:04, 2 March 2016
412 × 366; 355 KB
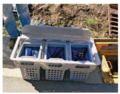 Stormwater inlet protection BMPs can be inserted into a catch basin.PNG PLeegar
21:58, 2 March 2016
414 × 326; 354 KB


_in_TCMA_lakes_versus_Osgood_Index.PNG)


_in_Elm_Creek.PNG)
_in_Sand_Creek.PNG)


.PNG)


