Examples for completing the TMDL reporting form
Examples for completing the TMDL reporting form
The purpose of this section is to provide step-by-step examples on how to fill out the three required tabs in the TMDL Form. These are the BMP-Activites completed tab, the Cumulative reductions tab, and the Adaptive management strategy tab. The Permittee is not required to report on every BMP/activity that has been implemented, but instead just on those BMP/activities that are being applied to applicable WLAs. Please read overview of categories before continuing on with the examples.
In order to complete the TMDL reporting form, it is important that the permittee have a means to:
- Define the watersheds of applicable TMDLs
- Plot structural BMPs within their jurisdiction, and
- Determine which BMPs are treating discharges to which impaired waters
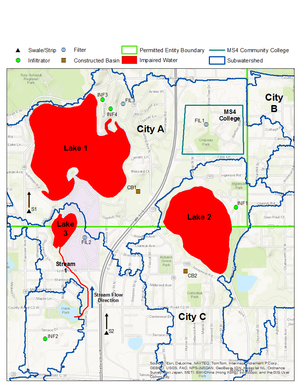
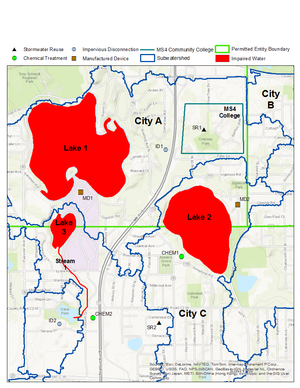
This information is provided in the figures we will be referring to throughout each example. The subsequent sections will demonstrate how to take that information and translate it to the TMDL reporting form.
Scenario 1: Metroshed WRAPS
This example set uses maps 1 and 2, which appear on the right hand side of the page. Each map covers the same area with one exception. Map 1 depicts structural BMPs and Map 2 depicts non-structural BMPs. Regardless of BMP type, the TMDLs required to be reported on are the same.
The example covers a metro area TMDL, the Metroshed WRAPS, with four MS4 permittees (City A, City B, City C, and MS4 College) and four impaired waters. The following TMDLs have been completed to address these impairments:
- Lake 1: Phosphorus
- Lake 2: Phosphorus
- Lake 3: Phosphorus
- Metroshed WRAPS: TSS
- Metroshed WRAPS: E. coli
- Lake TMDLs: Will be labeled by Waterbody + Pollutant. The title of the TMDL Project will therefore not be captured.
- Stream TMDLs: For ease of reporting, the Permittee is allowed to report on groupings of WLAs within the same report. Stream TMDLs will therefore be labeled by TMDL Project Name + Pollutant. For example, if the Permittee has TSS WLAs on four stream reaches in a single project, these will be grouped into one TMDL to report on. If the Permittee has been assigned WLAs for bacteria (whether they are expressed as fecal coliform or E. Coli) on the same four stream reaches in the same project, the Permittee would have two TMDLs to report on. Note that a Permittee may request to have the form customized to allow for individual reach reporting, however, the grouping convention will be the default.
City A
City A has been assigned WLA for three of the five TMDLs included in the Metroshed WRAPS project, the Lake 1: Phosphorus, Lake 2: Phosphorus, and Lake 3: Phosphorus TMDLs. As noted in the previous section, the baseline year for each TMDL is 2010. Since the baseline, City A has implemented 14 BMP/activities that can be credited as progress toward achieving an applicable WLA. Note that all 14 BMP/activites "do not" apply to each TMDL WLA. Table 1 illustrates which TMDL each BMP can be credited to and in what category.

