MPCA review of submittals using the MPCA Simple Estimator
MPCA anticipates several permittees will use the MPCA Simple Estimator to demonstrate compliance with or progress toward meeting total maximum daily load (TMDL) wasteload allocations (WLAs). If a permittee uses the MPCA Simple Estimator , it is recommended they submit an electronic copy of the entire Excel spreadsheet. An electronic copy of the worksheet called Summary sheet, or a printout or legible image of the worksheet called Summary sheet may be acceptable, though MPCA may request an electronic copy of the spreadsheet to clarify items on the Summary sheet.
In reviewing the information in the Estimator, MPCA staff will focus on the following.
- Comparing the reduction (lbs or %) or final loading rate (lb/ac/yr) with the WLA, depending on how the WLA is expressed in the TMDL
- Changes in default values for event mean concentration (emc), runoff coefficients, bmp removal efficiencies, or the fraction of runoff that is treated and infiltrated by bmps
- Changes in adjusted loads compared to unadjusted total loads
- Land use distributions
- BMPs implemenated
These are discussed briefly below.
Contents
- 1 Comparing the reduction (lbs or %) or final loading rate (lb/ac/yr) with the WLA, depending on how the WLA is expressed in the TMDL
- 2 Changes in default values for event mean concentration, runoff coefficients, bmp removal efficiencies, or the fraction of runoff that is treated and infiltrated by bmps
- 3 Changes in adjusted loads compared to unadjusted total loads
- 4 Land use distributions
- 5 BMP information
- 6 Links
Comparing the reduction (lbs or %) or final loading rate (lb/ac/yr) with the WLA, depending on how the WLA is expressed in the TMDL
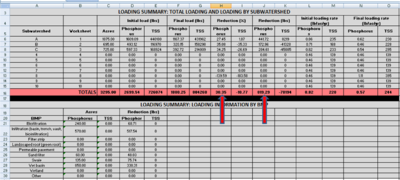
Wasteload allocations are typically expressed as a total load, a mass load reduction (e.g. pounds), a percent mass reduction, or a loading rate (lb/ac/yr). The value reported in the Estimator will be compared to the WLA as reported in the TMDL or as interpreted by the MPCA. The Summary sheet from the Estimator is the source of this information.
An example is shown in the adjacent image. This shows a Summary sheet from the Estimator, illustrating pounds of phosphorus reduced for a site having three subwatersheds. The pollutant of concern is phosphorus. The Summary sheet shows initial loading for each of the subwatersheds and for the entire site (2699.54 lbs), pounds reduced after BMP implementation (819.29 lbs), percent reduction from the initial load (30.35%), and final loading rate (0.57 lb/ac/yr). Each of these results is also displayed by subwatershed.
Changes in default values for event mean concentration, runoff coefficients, bmp removal efficiencies, or the fraction of runoff that is treated and infiltrated by bmps
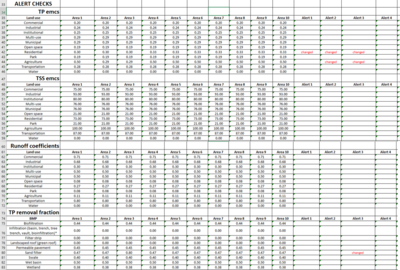
Default values for these inputs are based on information from the literature and are therefore considered defensible. However, local information may exist to support changing these values. This includes water quality monitoring data, site-specific land use information, bmp performance monitoring, or some similar information. The Estimator spreadsheet contains cells for describing the rationale for changes to these inputs. The Stormwater Manual provides guidance for adjusting emcs and runoff coefficients. The adjacent image provides an example of some changes that MPCA staff would examine in determining compliance with a wla. Examples of changes that may merit further investigation by MPCA staff include the following.
- Improved bmp removal efficiency
- increased fraction of water infiltrating for a specific bmp
- changes in emc or runoff coefficient greater than 10 percent compared to the default value
In the adjacent image, the user changed the default event mean concentration (emc) for the residential and agricultural areas. In these cases, MPCA staff would examine the changes. The permittee should provide a brief explanation of the reason for the change, either on the worklsheet where the change was made or in the Notes worksheet of the Estimator. The Notes worksheet is preferable because it allows the permittee to provide a detailed explanation of the change. For example, in the case of the image on the right, the emc was changed from the default of 0.325 mg/ L to 0.350 mg/L to account for high tree canopy, then modified again to 0.30 mg/L to account for enhanced street sweeping that targeted leaf removal during fall. The agricultural emc was changed as the land was developed and changed to mixed (multi-use) land use. The screen shot of the alert section of the spreadsheet also indicates the pollutant removal fraction for a sand filter was changed. In this case, it was due to incorporation of iron into the sand filter ( iron-enhanced sand filter), resulting in a change from the default pollutant removal of 0.47 to 0.80.
Changes in adjusted loads compared to unadjusted total loads
The bmps included in the Simple Estimator have approved pollutant removal efficiencies. There are other actions that may reduce pollutant loading, or in some cases increase loading. Examples include changes in land use and street sweeping. Because there are not documented reductions for these activities, permittees can adjust emcs and/or runoff coefficients based on local data or information. MPCA encourages these adjustments when they are well supported and provide more realistic pollutant loading estimates. These activities should be documented in the spreadsheet. The spreadsheet is designed so that these adjustments will be noted and MPCA staff may request additional information about the basis for these adjustments.
The Summary sheet in the worksheet does not display changes in loading associated with adjusted loads. MPCA staff will examine individual worksheets to identify these changes. The permittee should document the reason for these changes, preferably in the Notes worksheet where more detailed explanation can be provided.
Land use distributions
MPCA staff will not conduct a comprehensive analysis of land use detailed in the Estimator spreadsheet. However, staff may request additional information under certain circumstances. Examples where MPCA may request additional information include but are not limited to the following.
- A single land use for the entire area, particularly if it is mixed (multi-use) land use
- Multiple entries for the same land use. For example, a permittee may include two residential areas on a worksheet if pollutant loading in the two areas is significantly different
- Associated changes in adjusted loads, emcs, or runoff coefficient, particularly if rationale for these changes is not provided
- Land uses different than the defaults (e.g. low density residential, forested)
If maps displaying land use for the site and/or subwatersheds are readily available and easily submitted, the MPCA encourages permittees to submit these with the spreadsheet.
BMP information
The Summary sheet in the Estimator provides a summary of pollutant reductions associated with each structural BMP type. This is summary information across all worksheets (subwaterasheds) and includes the acreages treated by each BMP type and associated reduction in pollutant loading (pounds). In the example in the adjacent image, pollutant reductions were achieved with biofiltration, infiltration, swales, sand filters, and wet ponds. Examples of items MPCA staff may examine include but are not limited to the following:
- BMP acreages that exceed total acreages within individual worksheets,
- very large pollutant removal associated with small scale BMPs (e.g. biofiltration, sand filters), and
- pollutant removals associated with BMPs where pollutant removal or treatment fractions were changed.
Links
- Guidance and examples for using the MPCA Estimator
- Recommendations and guidance for utilizing the MPCA Simple Estimator to meet TMDL permit requirements
- Case study for using the MPCA Simple Estimator to meet TMDL permit requirements
- Download Version 3 of the estimator here: File:MPCA simple estimator version 3.0.xlsx

