![]()
Difference between revisions of "Adjusting dissolved and particulate phosphorus ratios in the MIDS Calculator"
| Line 38: | Line 38: | ||
Within each land use there is one biofiltration practice. Both practices are sized as follows. | Within each land use there is one biofiltration practice. Both practices are sized as follows. | ||
*Drainage area is one (1) acre of impervious surface | *Drainage area is one (1) acre of impervious surface | ||
| − | *Each practice is sized to meet the MIDS performance goal of 1.1 inches (3000 square feet areas and 1.35 feet deep | + | *Each practice is sized to meet the MIDS performance goal of 1.1 inches (3000 square feet areas and 1.35 feet deep, on D soil) |
| + | *Media Mix C is used with no amendment | ||
| − | <gallery caption="Screen shots for Example 1. Click on an image for enlarged view." widths=" | + | The adjacent image gallery provides screen shots of the calculator inputs, where to change the particulate and dissolved phosphorus ratios, and the resulting summary. The summary shows increased particulate loads for the commercial land use and increased dissolved loads for the residential land use. Because the bmp is more efficient at retaining particulate phosphorus, a greater amount of total phosphorus is removed in the commercial land use setting. |
| + | |||
| + | <gallery caption="Screen shots for Example 1. Click on an image for enlarged view." widths="300px"> | ||
File:Example 1 calculator inputs.png|alt=Screen shot of calculator inputs for Example 1|Screen shot of calculator inputs for Example 1 | File:Example 1 calculator inputs.png|alt=Screen shot of calculator inputs for Example 1|Screen shot of calculator inputs for Example 1 | ||
File:Example 1 Excel screen shot.png|alt=Screen shot of where to change values for Example 1|Screen shot of where to change values for Example 1 | File:Example 1 Excel screen shot.png|alt=Screen shot of where to change values for Example 1|Screen shot of where to change values for Example 1 | ||
| − | File:Example 1 summary.png|alt=Screen shot of summary information for Example 1|Screen shot of summary information for Example 1 | + | File:Example 1 summary.png|alt=Screen shot of summary information for Example 1|Screen shot of summary information for Example 1. Note that the commercial land use is the top value and residential the bottom in each case. |
</gallery> | </gallery> | ||
Revision as of 01:39, 15 March 2023
Phosphorus in stormwater runoff occurs in particulate and dissolved forms. Many stormwater practices are effective at removing particulate phosphorus, but many are ineffective for removing dissolved phosphorus. In addition, the dissolved phosphorus (DP) and total phosphorous (TP) loads for a site vary depending on several factors, such as land use (residential, commercial, and industrial), time of year, and precipitation amounts and patterns. To accurately model pollutant loading at a site, it may therefore be important to accurately assign these ratios. See this page for more information on phosphorus.
This page describes how to adjust the dissolved phosphorus to total phosphorus (DP:TP and the particulate phosphorus to total phosphorus (PP:TP) ratios in the MIDS Calculator.
Contents
Case 1: adjusting phosphorus ratios across an entire site


The Minimal Impact Design Standards (MIDS) calculator assigns a single value across a site for fractions of total phosphorus that are in dissolved and particulate forms (45 and 55 percent, respectively). These values can be adjusted by changing the value fields within the Excel spreadsheet that the MIDS calculator creates. To change the dissolved phosphorous to total phosphorous ratio for a site (DP:TP) follow these instructions:
- Open the MIDS Excel file you are adjusting. This is done in Excel, not in the MIDS Graphical User Interface.
- Ensure your event mean concentration (emv) is accurate for the conditions that are being modeled. The default value in the calculator is 0.3 mg/L. For more information on emcs, link here.
- Under the Site Information and Summary tab in the MIDS Excel spreadsheet change cell C60 to the desired particulate fraction. The default is 0.55.
- Under the same tab, “Site Information and Summary”, change cell C62 to the desired dissolved phosphorous fraction. The default is 0.45.
- Save the file and close it.
When you open the MIDS calculator GUI, the Results tab will show results for the site and for the individual bmps. The Summary Information accurately reflects phosphorus on the site. However, the individual BMP information under BMP Summary will not be accurate as you did not change the fractions for these. If you want accurate information for the individual bmps, you must adjust the individual bmps as described below in Case 2.
Case 2: adjusting phosphorus ratios and event mean concentrations (emcs) for individual bmps


DP:TP and PP:TP ratios can be adjusted for any bmp. Changing the ratio only affects the bmp for which the change was made. Thus, when evaluating results for the site, you must use the BMP summary rather than the site summary information.
- Open the MIDS Excel file you are adjusting. This is done in Excel, not in the MIDS Graphical User Interface.
- If you are not adjusting the event mean concentration (emc) for individual bmps, ensure the emc on the Site Information and Summary tab is accurate for the conditions that are being modeled. The default value in the calculator is 0.3 mg/L. For more information on emcs, link here.
- Navigate to the “MIDS BMP Calculator” tab, Column AM and in the row corresponding to your bmp, change the PP:TP ratio and emc to desired values. The defaults are 0.55 for the ratio and cell F6 for the emc (0.3 mg/L). Column AM is named “Annual Particulate P Load from Direct Drainage Area (lbs)”. See the corresponding screen shot.
- To change the DP:TP ratio for the same bmp, navigate to the “MIDS BMP Calculator” tab, Column AU and in the row corresponding to your bmp, change the PP:TP ratio and emc to desired values. The defaults are 0.45 for the ratio and cell F6 for the emc (0.3 mg/L). Column AU is named “Annual Particulate P Load from Direct Drainage Area (lbs)”. See the corresponding screen shot.
Example 1 - differing land uses
Two land uses with differing phosphorus runoff characteristics are being modeled. Land use 1 is an industrial area and land use 2 is in a residential area. Per guidance in the Minnesota Stormwater Manual, we adjust the dissolved P to total P ratio to 0.25, thus giving a particulate P to total P ratio of 0.75.
Within each land use there is one biofiltration practice. Both practices are sized as follows.
- Drainage area is one (1) acre of impervious surface
- Each practice is sized to meet the MIDS performance goal of 1.1 inches (3000 square feet areas and 1.35 feet deep, on D soil)
- Media Mix C is used with no amendment
The adjacent image gallery provides screen shots of the calculator inputs, where to change the particulate and dissolved phosphorus ratios, and the resulting summary. The summary shows increased particulate loads for the commercial land use and increased dissolved loads for the residential land use. Because the bmp is more efficient at retaining particulate phosphorus, a greater amount of total phosphorus is removed in the commercial land use setting.
- Screen shots for Example 1. Click on an image for enlarged view.
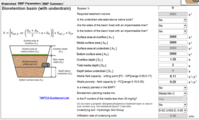
Screen shot of calculator inputs for Example 1
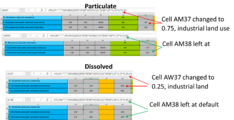
Screen shot of where to change values for Example 1
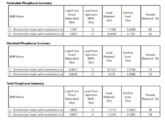
Screen shot of summary information for Example 1. Note that the commercial land use is the top value and residential the bottom in each case.


Example 2 - leaf drop versus non-leaf drop
A residential land use is being modeled and we want to know the differences in phosphorus loading during fall leaf drop compared to other times of the year. For the fall leaf drop we change the dissolved P to total P ratio to 0.50, the particulate P to total P ratio to 0.50, and change the event mean concentration to 1.0 mg/L. For the remainder of the year we leave the emc at the default of 0.35 and change the DP:TP ratio to 0.40 and the PP:TP ratio to 0.60.
Note: The term “leaf drop” implies fall when the leaves are falling.