![]()
Difference between revisions of "Performance curves for MIDS calculator"
m |
|||
| Line 2: | Line 2: | ||
==Performance curve development== | ==Performance curve development== | ||
| − | |||
| − | |||
| − | |||
| − | |||
| − | |||
| − | |||
| − | |||
| − | |||
| − | |||
| − | |||
The performance curves were developed using the [http://wwwalker.net/p8/ P8 model]. P8 was used to calculate runoff from several hypothetical 10 acre development scenarios with varying levels of imperviousness, soil types, and BMP volumes. Twenty hypothetical watersheds were included in the P8 modeling analysis, including [[Glossary#H|Hydrologic Soil Group]] A, B, C and D soils with 10 percent, 20 percent, 50 percent, 70 percent or 90 percent imperviousness. | The performance curves were developed using the [http://wwwalker.net/p8/ P8 model]. P8 was used to calculate runoff from several hypothetical 10 acre development scenarios with varying levels of imperviousness, soil types, and BMP volumes. Twenty hypothetical watersheds were included in the P8 modeling analysis, including [[Glossary#H|Hydrologic Soil Group]] A, B, C and D soils with 10 percent, 20 percent, 50 percent, 70 percent or 90 percent imperviousness. | ||
| Line 26: | Line 16: | ||
==Example Performance Curve== | ==Example Performance Curve== | ||
An example curve is displayed below for a native soils infiltration rate of 1.63 inches per hour. The infiltration rate represents the infiltration rate of the native soils below the BMP. Similar curves were created for soil infiltration rates of 0.9, 0.6, 0.3, 0.2 and 0.0 inches per hour. Linear interpolation is used for values that fall between infiltration rates and/or watershed percent imperviousness. Internally, the calculator takes the volume reduction capacity of the BMP, calculated using the BMP parameters entered by the user, with the contributing watershed area, the infiltration rate associated with the BMP, and the percent imperviousness of the watershed, and calculates the percent annual volume reduction. This percent annual volume reduction for the specific BMP is then used to calculate the pollutant load reductions for TSS, dissolved phosphorus, and particulate phosphorus. | An example curve is displayed below for a native soils infiltration rate of 1.63 inches per hour. The infiltration rate represents the infiltration rate of the native soils below the BMP. Similar curves were created for soil infiltration rates of 0.9, 0.6, 0.3, 0.2 and 0.0 inches per hour. Linear interpolation is used for values that fall between infiltration rates and/or watershed percent imperviousness. Internally, the calculator takes the volume reduction capacity of the BMP, calculated using the BMP parameters entered by the user, with the contributing watershed area, the infiltration rate associated with the BMP, and the percent imperviousness of the watershed, and calculates the percent annual volume reduction. This percent annual volume reduction for the specific BMP is then used to calculate the pollutant load reductions for TSS, dissolved phosphorus, and particulate phosphorus. | ||
| + | |||
| + | <gallery> | ||
| + | File:Infiltration rate 1.63 inch_hr.jpg|alt=Graph showing plots of percent annual runoff volume reduction as a function of BMP capacity for 1.63 in/hr native soil and various percent impervious cover|Graph showing plots of percent annual runoff volume reduction as a function of BMP capacity for 1.63 in/hr native soil and various percent impervious cover | ||
| + | File:Infiltration rate 0.9 inch_hr.jpg|alt=Graph showing plots of percent annual runoff volume reduction as a function of BMP capacity for 0.9 in/hr native soil and various percent impervious cover|Graph showing plots of percent annual runoff volume reduction as a function of BMP capacity for 0.9 in/hr native soil and various percent impervious cover | ||
| + | File:Infiltration rate 0.6 inch_hr.jpg|Graph showing plots of percent annual runoff volume reduction as a function of BMP capacity for 0.6 in/hr native soil and various percent impervious cover|Graph showing plots of percent annual runoff volume reduction as a function of BMP capacity for 0.6 in/hr native soil and various percent impervious cover | ||
| + | File:Infiltration rate 0.3 inch_hr.jpg|alt=Graph showing plots of percent annual runoff volume reduction as a function of BMP capacity for 0.3 in/hr native soil and various percent impervious cover|Graph showing plots of percent annual runoff volume reduction as a function of BMP capacity for 0.3 in/hr native soil and various percent impervious cover | ||
| + | File:Infiltration rate 0.2 inch_hr.jpg|alt=Graph showing plots of percent annual runoff volume reduction as a function of BMP capacity for 0.2 in/hr native soil and various percent impervious cover|Graph showing plots of percent annual runoff volume reduction as a function of BMP capacity for 0.2 in/hr native soil and various percent impervious cover | ||
| + | </gallery> | ||
===Example Calculation=== | ===Example Calculation=== | ||
Revision as of 19:31, 19 August 2014
The MIDS performance goal requirement is instantaneous, requiring the BMP to infiltrate an amount of water independent to the duration of a precipitation event. A conversion is needed to relate the instantaneous volume reduction capacity of a BMP to a percent annual volume reduction. This conversion is facilitated through the use of performance curves relating an annual percent volume reduction to the BMP volume reduction capacity. The percent annual volume reduction is then used to determine annual volume and pollutant load reductions.
Contents
Performance curve development
The performance curves were developed using the P8 model. P8 was used to calculate runoff from several hypothetical 10 acre development scenarios with varying levels of imperviousness, soil types, and BMP volumes. Twenty hypothetical watersheds were included in the P8 modeling analysis, including Hydrologic Soil Group A, B, C and D soils with 10 percent, 20 percent, 50 percent, 70 percent or 90 percent imperviousness.
Watershed runoff volumes from pervious areas were computed in P8 (Program for Predicting Polluting Particle Passage thru Pits, Puddles, and Ponds) using the Soil Conservation Service (SCS) Curve Number Method. Pervious curve numbers were selected for each hypothetical watershed based on soil type and an assumption that the pervious areas within the hypothetical development would be open space areas in fair to good condition. References on SCS curve numbers provide a range of curve numbers that would apply to pervious areas in fair to good condition. Pervious curve numbers of 39, 65, 74, and 80 were used for hydrologic soil groups A, B, C, and D, respectively. (For a more detailed discussion of the Curve Number Method, see Urban Hydrology for Small Watersheds, Chapter 2).
Depression storage represents the initial loss caused by such things as surface ponding, surface wetting, and interception. As previously discussed, the P8 model utilizes the SCS Curve Number method to estimate runoff from pervious areas. For impervious areas, runoff begins once the cumulative storm rainfall exceeds the specified impervious depression storage, with the runoff rate equal to the rainfall intensity. An impervious depression storage value of 0.06 inches was used for the P8 simulation.
The P8 model requires hourly precipitation and daily temperature data; long-term data was used so that watersheds and BMPs can be evaluated for varying hydrologic conditions. The hourly precipitation and average daily temperature data were obtained from the National Weather Service site at the Minneapolis-St. Paul International Airport. The simulation period used for the P8 analysis was January 1, 1955 through December 31, 2004 (50 years).
For the P8 analysis, the 50-year hourly dataset was modified to exclude the July 23-24, 1987 “super storm” event, in which 10 inches of rainfall fell in six hours. This storm event was excluded because of its extreme nature and the resulting skew on the pollutant loading and removal predictions. Excluding the July 23-24, 1987 “super storm”, the average annual precipitation throughout the 50-year period used for the P8 modeling was 27.7 inches.
Bioretention basins were used to simulate the amount of water infiltrated by each BMP. The bioretention basins were sized for a range of treatment volumes in addition to five infiltration rates based on the underlying soils ranging between 0.2 and 1.63 inches per hour. The bioretention basins were modeled using each of the drainage characteristic combinations of soils type and impervious surfaces. The final results from the modeling were total percent annual runoff volume reductions based on the ratio between the volume capacity of the BMP and the watershed area, as well as the percent imperviousness of the watershed, and the infiltration rate of the native soils.
Example Performance Curve
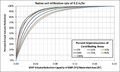
An example curve is displayed below for a native soils infiltration rate of 1.63 inches per hour. The infiltration rate represents the infiltration rate of the native soils below the BMP. Similar curves were created for soil infiltration rates of 0.9, 0.6, 0.3, 0.2 and 0.0 inches per hour. Linear interpolation is used for values that fall between infiltration rates and/or watershed percent imperviousness. Internally, the calculator takes the volume reduction capacity of the BMP, calculated using the BMP parameters entered by the user, with the contributing watershed area, the infiltration rate associated with the BMP, and the percent imperviousness of the watershed, and calculates the percent annual volume reduction. This percent annual volume reduction for the specific BMP is then used to calculate the pollutant load reductions for TSS, dissolved phosphorus, and particulate phosphorus.
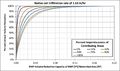
Graph showing plots of percent annual runoff volume reduction as a function of BMP capacity for 1.63 in/hr native soil and various percent impervious cover
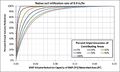
Graph showing plots of percent annual runoff volume reduction as a function of BMP capacity for 0.9 in/hr native soil and various percent impervious cover
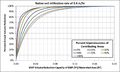
Graph showing plots of percent annual runoff volume reduction as a function of BMP capacity for 0.6 in/hr native soil and various percent impervious cover
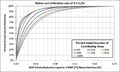
Graph showing plots of percent annual runoff volume reduction as a function of BMP capacity for 0.3 in/hr native soil and various percent impervious cover
Graph showing plots of percent annual runoff volume reduction as a function of BMP capacity for 0.2 in/hr native soil and various percent impervious cover


Example Calculation
Using the information detailed in the bioretention basin without an underdrain example the following are the calculations the calculator would make to find the annual volume reduction of the system. The design parameters of the bioretention basin in the example result in a basin with a volume reduction capacity of 6067 cubic feet and a watershed area of 2.2 acres (95,832 cubic feet). Those two values are used to calculate a ratio between the BMP volume reduction capacity and the watershed area of 0.06331 cubic feet per square foot. The percent imperviousness of the watershed is 64 percent and the infiltration rate of the native soils under the BMP is 0.45 inches per hour. The infiltration rate falls between two existing curves (0.6 inches per hour and 0.3 inches per hour); therefore, linear interpolation is needed to find the percent annual volume reduction at 0.45 inches per hour. The first step is to find the percent annual volume reduction using the 0.6 inches per hour curve below in combination with the ration between the volume reduction capacity and the watershed area and the percent imperviousness of the contributing watershed. Using those two values on the performance curves results in a percent annual volume reduction of 94 percent.
The next step that the calculator completes is to use the 0.3 inches per hour curve shown below to find the corresponding percent annual volume reduction of 92 percent using the same lookup parameters. Linear interpolation is then used to calculate the final percent annual volume reduction of 93 percent for an infiltration rate of 0.45 inches per hour.
Calculation of contributing watershed area and watershed percent imperviousness
The contributing watershed area and percent imperviousness of the watershed takes into account watershed areas routed from other BMPs in addition to the direct watershed area of the BMP. If the overflow of a BMP is routed downstream to another BMP, the upstream BMP’s contributing area will be included in determining the total watershed area and percent imperviousness of the downstream BMP for use in the performance curve calculations. When the overflow water is routed, a portion of the pervious and impervious area of the upstream BMP is routed to the downstream BMP as contributing areas. The portion routed to the downstream BMP is equivalent to the percent annual volume that is not retained by the upstream BMP. For example, if the upstream BMP has a percent annual volume reduction of 70 percent, then 30 percent of the pervious area and 30 percent of the impervious area associated with the upstream BMP is routed to the downstream BMP. This area is combined with the direct watershed information of the downstream BMP to determine the watershed area and percent imperviousness used in the performance curves.
Dry Swale Calculations
For the swale side slope and swale main channel BMP, the performance curves are used to calculate the performance goal volume retention instead of the annual volume reduction. These systems do not have an instantaneous storage capacity similar to other BMPs. Instead, a percent annual volume reduction is calculated using relationships between BMP design parameters and modeling results as explained in the volume calculation methodology for each of the systems (swale side slope, swale main channel). The performance curves are then used to calculate the BMP volume reduction capacity of the BMP using the percent annual volume reduction and water shed parameters such as soil type, watershed area, and watershed percent imperviousness.
Swale Side Slope Example Calculation
Using the information entered in the swale side slope and main channel example the following are calculations the calculator uses to determine the BMP volume reduction capacity based on the percent annual volume reduction and watershed parameters. The BMP design parameters are entered into the calculator as detailed in the example. A percent annual volume reduction of 12 percent is determined based on the design parameters following the method described here . The infiltration rate of the native soils is 1.63 inches per hour, therefore the below performance curve is used to calculate the BMP volume reduction capacity. The below figure is zoomed in to help show the interpolations made. The percent impervious of the contributing watershed is 72 percent and the total watershed area is 1.943 acres (84,637 square feet). In this example the performance curve is used in the opposite process from the bioretention basin example above. The percent annual volume reduction is known and the BMP volume reduction capacity needs to be calculated. Using the information provided the ratio between the BMP volume reduction capacity of the BMP and the watershed area is determined to be 0.001437 cubic feet per square foot. This value is then multiplied by the total drainage area to determine the BMP volume reduction capacity for the swale side slope of 122 cubic feet.
Performance curves developed from modeling results
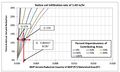
Example calculation of percent annual volume reduction for 1.63 in/hr and 64% impervious cover condition
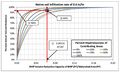
Example calculation of percent annual volume reduction for 0.6 in/hr and 64% impervious cover condition
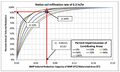
Example calculation of percent annual volume reduction for 0.3 in/hr and 64% impervious cover condition


