Difference between revisions of "Rainfall frequency maps"
m |
m |
||
| Line 1: | Line 1: | ||
| − | {{alert|Precipitation frequency information (Atlas 14) has been updated by the National Oceanic and Atmospheric Administration (NOAA). We recommend using Atlas 14 | + | {{alert|Precipitation frequency information (Atlas 14) has been updated by the National Oceanic and Atmospheric Administration (NOAA). We recommend using Atlas 14.|alert-info}} |
| − | NOAA's Atlas 14, Volume 8 precipitation frequency information can be found on [http://hdsc.nws.noaa.gov/hdsc/pfds/pfds_map_cont.html?bkmrk=mn NOAA's precipitation frequency data server. | + | NOAA's Atlas 14, Volume 8 precipitation frequency information can be found on [http://hdsc.nws.noaa.gov/hdsc/pfds/pfds_map_cont.html?bkmrk=mn NOAA's precipitation frequency data server]. Rainfall frequency maps from [http://www.nws.noaa.gov/oh/hdsc/PF_documents/TechnicalPaper_No40.pdf Technical Paper 40] have been moved to [[Technical Paper 40 rainfall frequency maps|this page.]] |
| − | |||
| − | |||
*Rainfall frequency curves for the 1, 2, 5, 10, 25, 50, and 100 year 24-hour rainfall events for Minnesota. The source of the data is Technical Paper 40 ([http://www.nws.noaa.gov/oh/hdsc/PF_documents/TechnicalPaper_No40.pdf National Oceanic and Atmospheric Administration]) | *Rainfall frequency curves for the 1, 2, 5, 10, 25, 50, and 100 year 24-hour rainfall events for Minnesota. The source of the data is Technical Paper 40 ([http://www.nws.noaa.gov/oh/hdsc/PF_documents/TechnicalPaper_No40.pdf National Oceanic and Atmospheric Administration]) | ||
Revision as of 13:30, 17 December 2015
Information: Precipitation frequency information (Atlas 14) has been updated by the National Oceanic and Atmospheric Administration (NOAA). We recommend using Atlas 14.
NOAA's Atlas 14, Volume 8 precipitation frequency information can be found on NOAA's precipitation frequency data server. Rainfall frequency maps from Technical Paper 40 have been moved to this page.
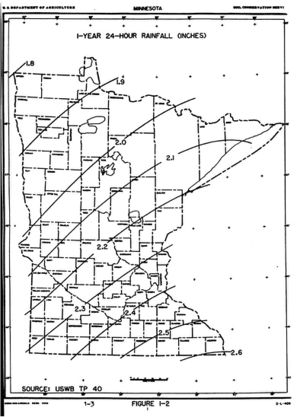
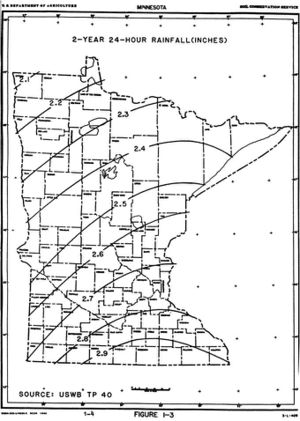
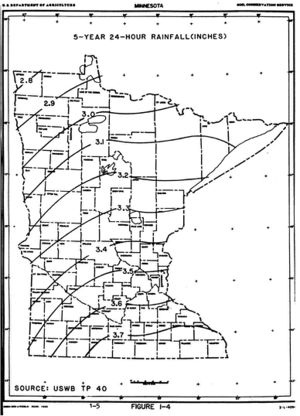
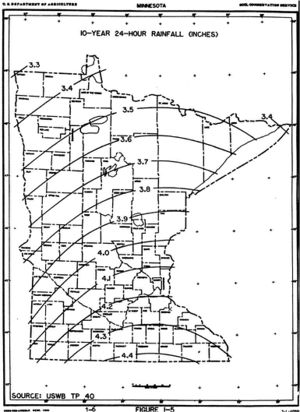
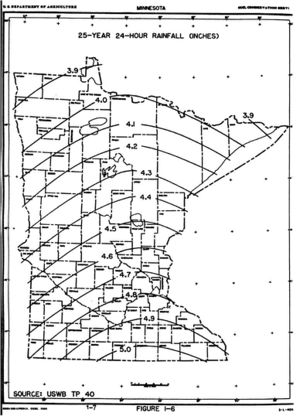
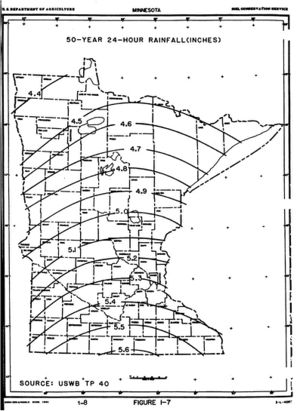
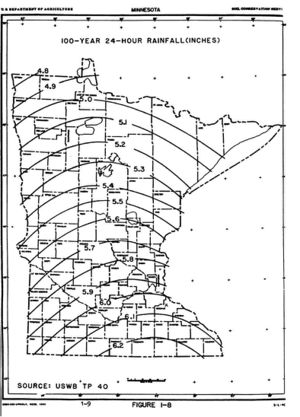
- Rainfall frequency curves for the 1, 2, 5, 10, 25, 50, and 100 year 24-hour rainfall events for Minnesota. The source of the data is Technical Paper 40 (National Oceanic and Atmospheric Administration)
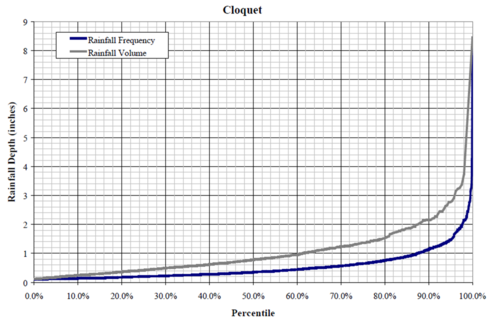
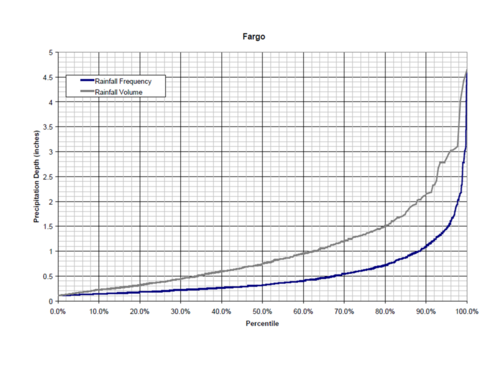
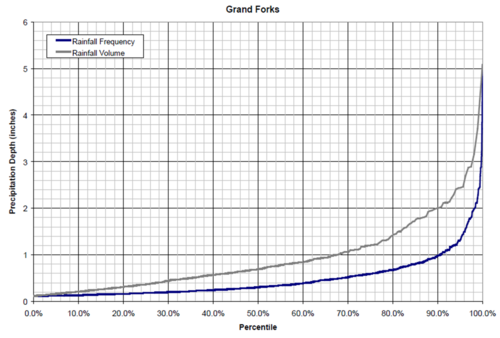
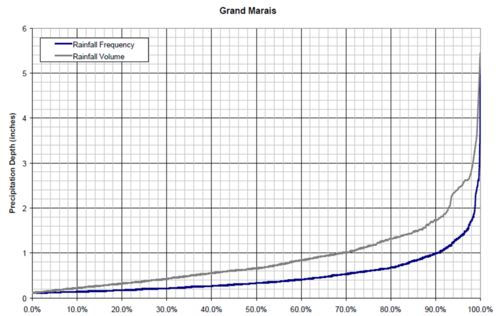
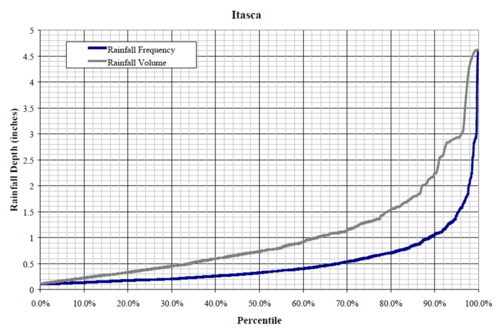
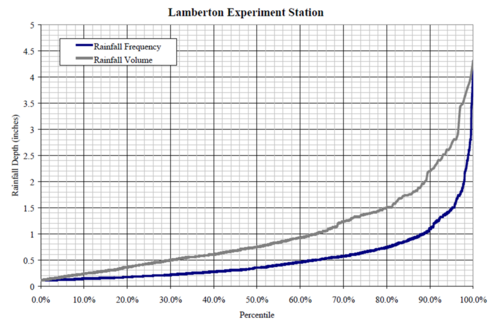
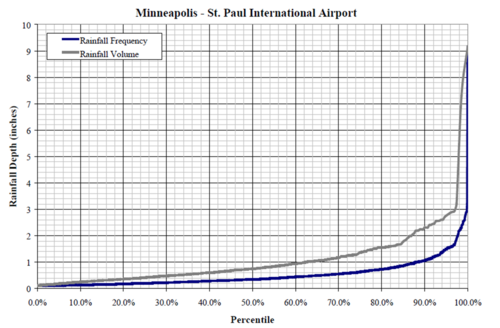
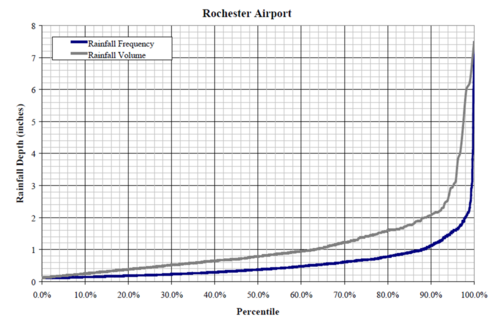
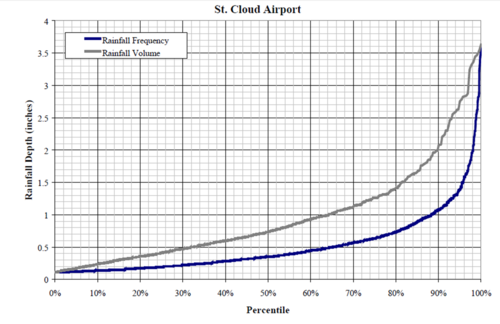
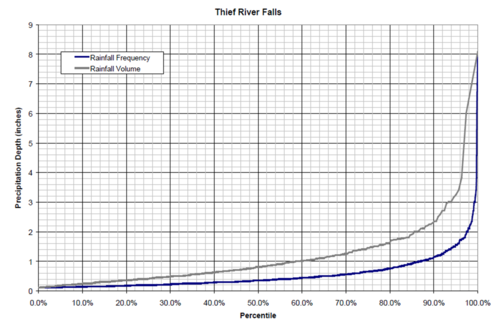
- Rainfall frequency and volume percentiles as a function of precipitation depth for ten locations in Minnesota. Rainfall frequency specifies the number of 24-hour rain events, expressed as a percent of all events, that are less than a certain depth. Volume represents the total annual volume of rain that is associated with a particular rain depth. For example, 88 percent of rain events in Cloquet are 1 inch or less, while rain events of one inch or less account for 60 percent of the annual volume.
Information: To view the title of an image hold the mouse over the image. To view the image click on the image. Most views show higher resolution depictions of the image.
