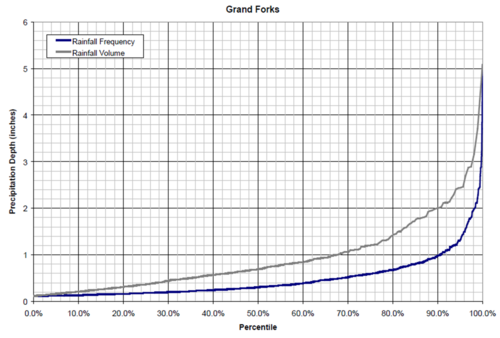
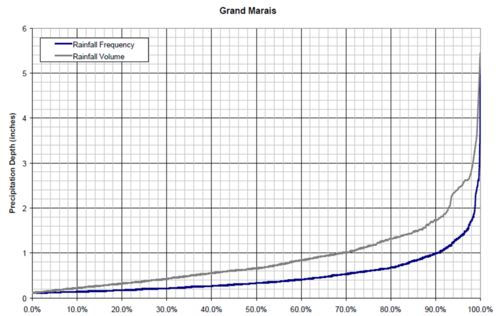
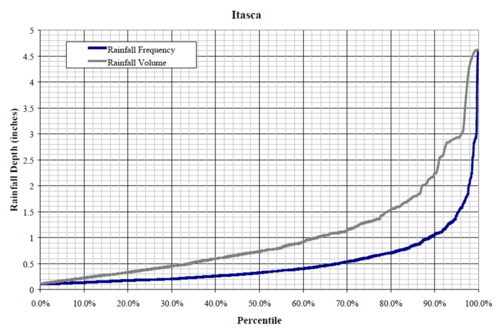
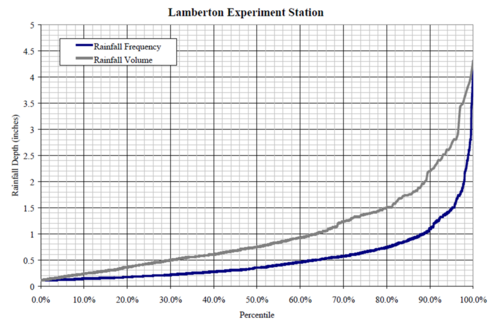
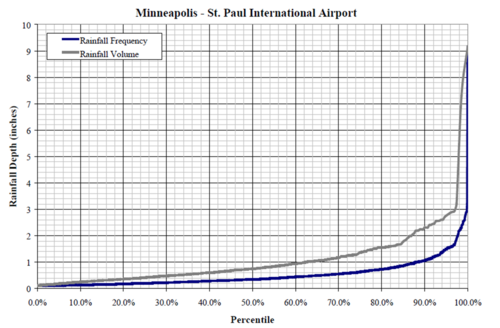
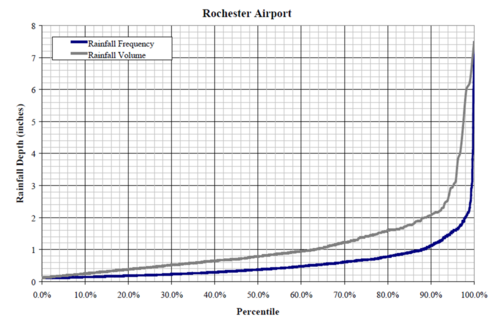
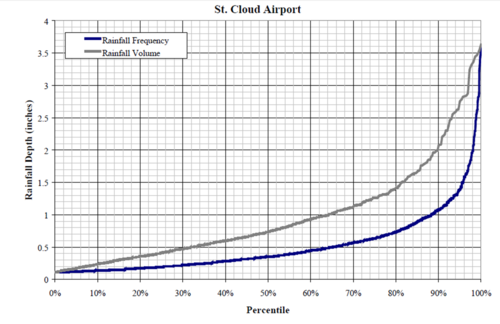
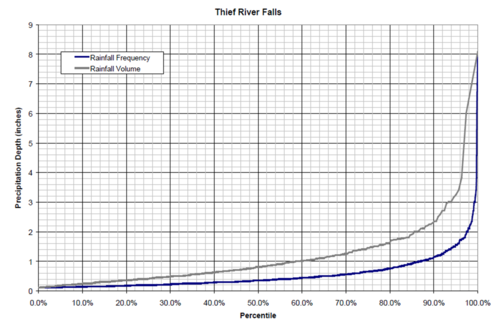
In the development of rainfall frequency and volume data for Minnesota, the Minnesota Stormwater Manual Sub-Committee conducted an analysis of rainfall distribution for several locations in Minnesota. The methodology and results of this analysis are described in Issue Paper B. Frequency-volume graphs were developed for several locations in the state and are illustrated below.
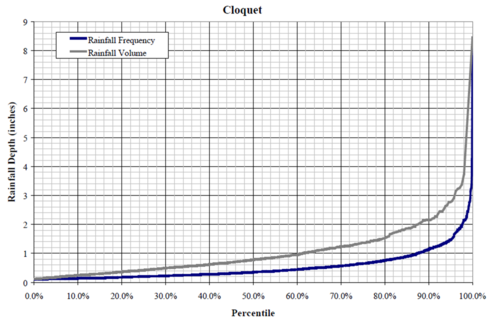
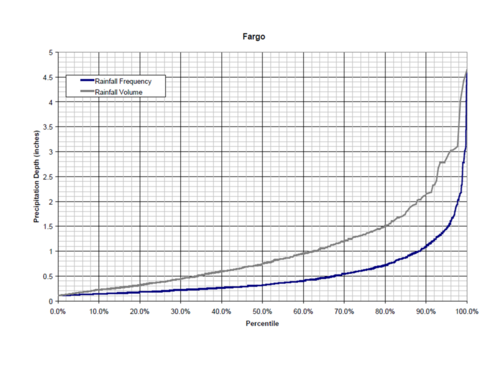
map showing rainfall frequency and volume percentiles as a function of precipitation depth for Cloquet map showing rainfall frequency and volume percentiles as a function of precipitation depth for Fargo map showing rainfall frequency and volume percentiles as a function of precipitation depth for Grand Forks map showing rainfall frequency and volume percentiles as a function of precipitation depth for Grand Marais map showing rainfall frequency and volume percentiles as a function of precipitation depth for Itasca map showing rainfall frequency and volume percentiles as a function of precipitation depth for Lamberton map showing rainfall frequency and volume percentiles as a function of precipitation depth for Minneapolis and St. Paul map showing rainfall frequency and volume percentiles as a function of precipitation depth for Rochester map showing rainfall frequency and volume percentiles as a function of precipitation depth for St. Cloud map showing rainfall frequency and volume percentiles as a function of precipitation depth for Thief River Falls