Scenario for developing a stormwater treatment train for a site with limited infiltration capacity
This page provides information on implementing a stormwater BMP treatment train for a site with limited infiltration capacity.
Contents
- 1 Step 1: Determine site characteristics
- 2 Step 2: Review Pollutant Removal Processes & Identify Potential Practices
- 3 Step 3: Determine site constraints & BMP placement
- 4 Step 4: Select individual BMPs and evaluate range of performance
- 5 Step 5: Size BMPs and assess performance
- 6 Step 6: Review construction and operations criteria
Step 1: Determine site characteristics
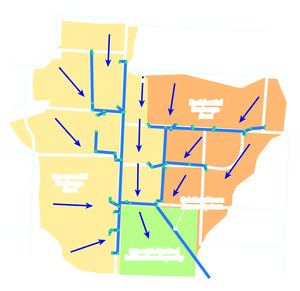
The site with limited infiltration capacity consists of a residential and commercial drainage area over soils with high clay content and shallow bedrock. There is a 7 acre site between a commercial and residential region of the drainage area that is currently undeveloped. The goal of the project is to implement BMPs at this site to help reduce the peak volume of stormwater entering the downstream storm sewer system during the 1.1 inch rainfall event. Once complete, the site is meant to be a demonstration area for BMPs and a public park for the community. The conditions for the site with limited infiltration capacity scenario are summarized in the table below and the existing site layout can be seen in the figure to the right.
Treatment train scenario limited infiltration capacity
Step 2: Review Pollutant Removal Processes & Identify Potential Practices
The main goal of the project is to reduce the required capacity of the existing downstream storm sewer system. For this reason, the BMPs selected for this site should offer volume reduction or peak attenuation benefits. Because the site is intended to serve as public education opportunity, BMPs offering additional pollutant removal benefits with aesthetically pleasing qualities are also a high priority.
This scenario offers opportunity for multiple BMP practices; the practices selected for the site are public education, swales & strips, filters, constructed basins, and manufactured devices. The process of selecting and placing BMPs on a site is typically iterative, working between the site constraints, project goals, and available budget. The approach and considerations for this scenario are discussed in the following sections.
The following summarizes various BMP categories and their applicability to this site.
Treatment train scenario limited infiltration capacity BMP options
Step 3: Determine site constraints & BMP placement
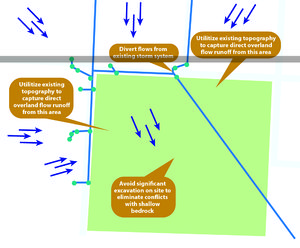
Existing site conditions cause several constraints regarding placement of BMPs. The most significant of these constraints for this scenario are soil conditions and existing topography.
- Soil Conditions – The soils at this site are poorly draining, and there is known to be shallow depths of bedrock. To keep the costs lower, it is ideal to minimize the amount of excavation on site. This will limit the depths of BMPs, and make optimal placement in the existing drainage paths of the site.
- Topography - Currently runoff generally drains through the site and to the southeast. The existing storm sewer collects from the majority of the upstream drainage area. Since no improvements are being made outside of the site, it is ideal to utilize existing topography in the direct vicinity of the site to capture overland flow and direct to BMPS along the perimeter of the property, and to identify one location on the existing storm system to divert flow to a primary BMP on site.
- Regulatory Requirements - All local, state, and federal regulatory requirements must be met. The design criteria and recommendations from the Minnesota Stormwater Manual will be followed.
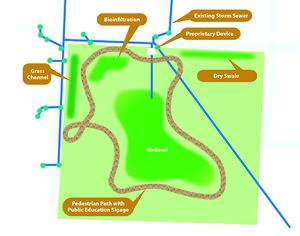
The viable locations for BMP placement identified are along the north and west perimeters, and the drainage path through the center of the site. This will allow BMPs on the perimeter to collect overland flow drainage from the existing commercial and residential areas, and allow a diversion of stormwater from the existing sewer system to a larger centralized BMP. Paths winding throughout the site are also proposed to provide a display of all BMP features and their functions to the community.
Step 4: Select individual BMPs and evaluate range of performance
As discussed in Step 2, the practices that are most applicable to this site are public outreach, swales & strips, filters, constructed basins, and manufactured devices.
- Public Education: Site Signage
While public education will not have measureable performance benefits, it provides the community with an understanding of the impacts of stormwater pollution and the efforts that can be taken to mitigate them. It also offers education on the function of BMPs within a watershed and the benefits they provide.
- Swales & Strips: Grass Channel & Dry Swale
Swales & strips may be used on the west and northwest edges of the property to collect direct overland flow from the drainage area, before it is collected by the existing storm system. Depending on the primary purposed of the swale or strip, a range of performance may be provided by this type of BMP. This may vary from minimal pollutant removal through filtration in a grass channel used primarily for conveyance, to more significant pollutant removal and volume reduction through a dry swale with a bioretention base offering additional storage volume and filtration capacity. Both of these types of swales are proposed for this site. The direct drainage area to the west of the site includes high imperviousness resulting in higher runoff volume pollutant loadings. For this reason, a grass channel is proposed to function as a pretreatment and conveyance feature to a downstream BMP that may offer additional performance benefits. The direct drainage area to the northeast of the site is residential and has a lower impervious cover and pollutant load/runoff expectation. A dry swale with a bioretention base and underdrain is proposed at this location to treat the majority of the tributary area.
- Filter: Biofiltration
While an infiltration BMP would provide higher pollutant removal and volume reduction benefits, the existing underlying soils for the site are poorly draining and not conducive for infiltration. A variety of filtration BMPs may be applicable for this site including bioinfiltration, media filters, and enhanced sand filters. A biofiltration BMP allows for an assortment of plantings, which not only serve as an aesthetic benefit, but also offers additional pollutant removal benefits through biological processes.
- Manufactured Device: SAFL Baffle
As discussed in Step 3, the majority of the drainage area is collected by an existing storm sewer system. A new structure is proposed to divert storm sewer to the BMP site, in order to treat and delay a portion of the peak runoff volume entering the downstream stormwater system. The main purpose of this proprietary device is to serve as pretreatment in this structure to reduce sediment and floatables reaching the downstream BMPs. A multitude of proprietary devices exist that could potentially serve this purpose. However, a SAFL baffle was selected for this site due to its low cost relative to the its function, its ease of access and maintenance, and the significant amount of performance evaluation data available through the University of Minnesota. This product used in a deep sump structure was found to still function well when clogged, requiring less frequent maintenance. The removal efficiency of the SAFL baffle is directly related to the flow rates through the baffle, the manhole size, the manhole sump depth, and the angle between incoming and outgoing pipes. As drainage area increases, the removal efficiency for suspended solids decreases significantly. This scenario has a significant amount of drainage area tributary to the SAFL Baffle, lowering TSS removal efficiency. However, this BMPs’ primary purpose is to serve as pretreatment and it will significantly reduce maintenance needs to downstream BMPs.
- Constructed Basins: Stormwater Wetland
For this scenario, a wet detention pond, a stormwater wetland, and a dry detention pond are all applicable BMPs that would meet the primary goal of peak flow attenuation. Of the three options, dry detention offers the fewest performance benefits, as it ultimately only utilizes two processes: attenuation and sedimentation. Both the wet detention pond and stormwater wetland BMPs act as a standalone treatment train, offering pollutant removal benefits through hydraulic, physical, biological, and chemical processes. The poorly draining underlying soils also make these ideal practices because a bottom liner would not be required to maintain a permanent pool. However, the stormwater wetland provides the opportunity for decorative vegetation and with it an additional pollutant removal biological process through plant metabolism.
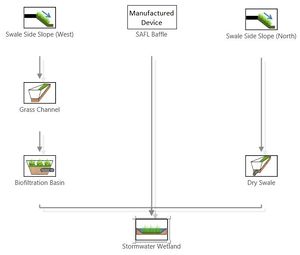
It is determined that a grass channel, dry swale, biofiltration, SAFL baffle, and wetland BMPs with educational signage and trails will best meet the goals of the project, as shown in the figure to the right.
Step 5: Size BMPs and assess performance
BMP sizing can be an iterative process between meeting project goals, working within site constraints, meeting regulatory requirements, and meeting client expectations. The MIDS calculator was used to evaluate the performance goals for the site given the drainage area, soil conditions, impervious area, average annual rainfall for the area, and the Water Quality Event retention goal (1.1 of impervious). Assumptions included an annual Phosphorus EMC of 0.3 mg/L, and an annual TSS EMC of 54.5 mg/L (MIDS calculator defaults). The table below summarizes the existing site runoff, volume and pollutant retention goals for this scenario. The BMPs were sized to best meet the project performance goals within the available space on site.
| Annual runoff volume (acre-feet | Annual particulate phosphorus load (lbs) | Annual dissolved phosphorus load (lbs) | Annual total suspended solids load (lbs) | Performance goal volume retention requirement (ft3 |
|---|---|---|---|---|
| 82.33 | 36.95 | 30.23 | 12205 | 111804 |
Grass channel and dry swale
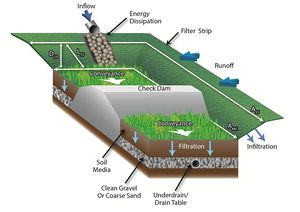
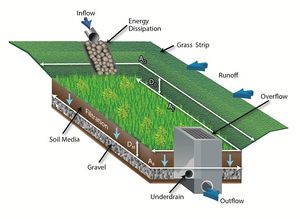
A grass channel, or swale, can have a multitude of different configurations and components depending on its desired functions and site topography. A typical configuration of a swale or strip with the features is shown to the right.
The primary purpose for the grass channel on the west side of this site is to serve as conveyance and pretreatment for the downstream biofiltration BMP. For this reason, the main design parameters will include main channel length, width, depth, and slope as well as the swale side slope length. Check dams were added to further reduce flow volumes into the biofiltration basin downstream as well as to add some additional volume reduction benefits. The grass channel was placed on the eastern edge of the roadway to maximize capture from the commercial area west of the site.
The dry swale on the northern edge of the property is intended to capture and treat stormwater from the residential drainage area north of the site by incorporating an engineered soil media base layer. Due to poorly draining underlying soils, an underdrain was also included in the dry swale, to better facilitate drainage of the filter media.
Both swales are designed to meet the MPCA design criteria, requirements and recommendations. Sizing input parameters for both the grass channel and the dry swale are summarized below.
| Feature | Side slope (V:H) | Channel length (ft) | Bottom width (ft) | Slope (%) | Bioretention base depth (ft) | Check dam depth (ft) | Check dam width (ft) | Drawdown time (hrs) |
|---|---|---|---|---|---|---|---|---|
| Grass channel | 1:3 | 200 | 10 | 1 | n/a | 0.24 | 10.72 | 48 |
| Dry swale | 1:3 | 230 | 10 | 3 | 1 | n/a | n/a | 48 |
Infiltration rate of the underlying soils is 0.06 in/hr. These parameters were entered into the MIDS calculator to evaluate performance of the grass channel BMP for runoff volume and pollutant load reductions, as well as to gain an understanding of the outflow directed to the biofiltration and wetland BMPs located downstream in the treatment train. The MIDS Calculator evaluates swale side slopes as an upstream BMP to swale main channel. However, virtually no volume or pollutant removal benefits were recognized for the swale side slope. The event and annual results for the grass channel and dry swale BMPs are summarized below.
Event runoff volume performance summary
| Parameter | Grass channel | Dry swale |
|---|---|---|
| Runoff Volume from Direct Watershed (ft3) | 2076 | 4352 |
| Runoff Volume from Upstream BMPs (ft3) | 0 | 0 |
| Retention Volume Provided by BMP (ft3) | 207 | 334 |
| Outflow Volume from BMP (ft3) | 1869 | 4018 |
| Percent Performance Goal Achieved (%) | 10 | 8 |
Annual performance goal summary
| Pollutant | Parameter | Grass channel | Dry swale |
|---|---|---|---|
| Volume | Runoff from Direct Watershed (acre-ft.) | 1.53 | 3.20 |
| Runoff from Upstream BMPs (acre-ft.) | 0.00 | 0.00 | |
| Retention Volume Provided by BMP (acre-ft.) | 0.13 | 0.22 | |
| Outflow Volume from BMP (acre-ft.) | 1.40 | 2.98 | |
| Percent Performance Goal Achieved (%) | 9 | 7 | |
| Particulate phosphorus | Particulate P from Watershed (lbs.) | 0.69 | 1.43 |
| Particulate P from Upstream BMPs (lbs.) | 0 | 0 | |
| Particulate P Load Reduction (lbs.) | 0.52 | 0.70 | |
| Particulate P Outflow | 0.17 | 0.73 | |
| Total Percent Particulate P Reduction | 75 | 49 | |
| Dissolved phosphorus | Dissolved P from Watershed (lbs.) | 0.56 | 1.17 |
| Dissolved P from Upstream BMPs (lbs.) | 0 | 0 | |
| Dissolved P Load Reduction (lbs.) | 0.05 | 0.19 | |
| Dissolved P Outflow | 0.51 | 0.98 | |
| Total Percent Dissolved P Reduction (%) | 9 | 16 | |
| Total suspended solids (TSS) | TSS from Watershed (lbs.) | 226 | 474 |
| TSS from Upstream BMPs (lbs.) | 0 | 0 | |
| TSS Load Reduction (lbs.) | 160 | 333 | |
| TSS Outflow | 66 | 141 | |
| Total Percent TSS Reduction (%) | 71 | 70 |
Biofiltration basin
Biofiltration basin performance is highly dependent on the sizing parameters of the BMP, the vertical location of the underdrain above the bottom of the basin, and the bioretention soil media mix properties. A typical configuration of a biofiltration BMP is shown in Figure 3.3.5.
Because the underlying soils are not conducive to infiltration, the biofiltration BMP is used primarily for filtration, and the underdrain was included with the elevation set at the bottom of the basin. The basin was sized based on available space within the flatter portion of the existing topography in the northwest corner of the site. The goal was to maximize the footprint of the basin to reduce the volume of stormwater exiting the BMP while utilizing the existing topography to the maximum extent practicable. The biofiltration BMP was designed to meet the MPCA design criteria, requirements and recommendations. Table 3.3.6 displays the sizing input parameters for the biofiltration basin.
| Surface area at overflow (ft2) | Media surface area (ft2) | Overflow depth (ft) | Total media depth (ft) | Drawdown time (hrs) |
|---|---|---|---|---|
| 6187 | 4788 | 1 | 2 | 48 |
Bioretention Soil Mix B was chosen for the basin for enhanced filtration, and the vegetation design included trees for an added aesthetic and pollutant removal benefit. The selected media mix dictates the MIDS inputs for soil-water storage properties, including a media field capacity of 0.14 ft3/ft3, a wilting point of 0.05 ft3/ft3, and a media porosity of 0.45 ft3/ft3. The infiltration rate of the underlying soil is 0.06 in/hr. These parameters were entered into the MIDS Calculator to evaluate the performance of the BMP. The results are summarize in Table 3.3.7.
Event runoff volume performance summary
| Parameter | Biofiltration |
|---|---|
| Runoff Volume from Direct Watershed (ft3) | 0 |
| Runoff Volume from Upstream BMPs (ft3) | 1869 |
| Retention Volume Provided by BMP (ft3) | 1018 |
| Outflow Volume from BMP (ft3) | 851 |
| Percent Performance Goal Achieved (%) | 54 |
Annual performance goal summary
| Pollutant | Parameter | Biofiltration |
|---|---|---|
| Volume | Runoff from Direct Watershed (acre-ft.) | 0 |
| Runoff from Upstream BMPs (acre-ft.) | 1.40 | |
| Retention Volume Provided by BMP (acre-ft.) | 0.39 | |
| Outflow Volume from BMP (acre-ft.) | 1.01 | |
| Percent Performance Goal Achieved (%) | 28 | |
| Particulate phosphorus | Particulate P from Watershed (lbs.) | 0 |
| Particulate P from Upstream BMPs (lbs.) | 0.17 | |
| Particulate P Load Reduction (lbs.) | 0.1 | |
| Particulate P Outflow | 0.068 | |
| Total Percent Particulate P Reduction | 60 | |
| Dissolved phosphorus | Dissolved P from Watershed (lbs.) | 0 |
| Dissolved P from Upstream BMPs (lbs.) | 0.51 | |
| Dissolved P Load Reduction (lbs.) | 0.36 | |
| Dissolved P Outflow | 0.15 | |
| Total Percent Dissolved P Reduction (%) | 71 | |
| Total suspended solids (TSS) | TSS from Watershed (lbs.) | 0 |
| TSS from Upstream BMPs (lbs.) | 66 | |
| TSS Load Reduction (lbs.) | 47 | |
| TSS Outflow | 19 | |
| Total Percent TSS Reduction (%) | 71 |
SAFL Baffle
SAFLE Baffle performance is primarily impacted by the size of the manhole, the depth of the sump in the manhole, inflow rates, and the angle between in the inflow and outflow pipes. Research shows that removal efficiency is increased for pipes with a 90 degree separation angle, compared to a straight through flow (180 degrees). Despite this fact, a through flow configuration is best suited for this site. The following displays the sizing parameters for the SAFL Baffle used.
| Manhole diameter (ft) | Manhole sump depth (ft) | Inflow/outflow pipe diameter (in) |
|---|---|---|
| 6 | 6 | 36 |
The SAFL baffle removes TSS from stormwater by filtering and settling processes at lower flow rates. During higher flow rates, washout occurs in which previously settled particles are re-suspended and carried out of the outflow pipe. Accounting for washout is highly important when considering pollutant removal efficiencies. SHSAM is a design software used for sizing sump manholes for SAFL Baffles. This software was used to estimate the suspended sediment removal efficiency for this SAFL Baffle design. The sizing parameters as well as precipitation data, expected particle size distribution, watershed parameters, and influent suspended sediment concentration data were input into program. Results showed an expected 8.6% removal efficiency for suspended solids. Typically a percentage of particulate phosphorous is attached to solids and therefore also removed. However, no significant available data exists for the SAFL Baffles quantifying particulate phosphorus pollutant removal efficiencies. For this reason, 0% particulate and dissolved phosphorous removal was assumed. These parameters were input into the MIDS calculator to evaluate performance of the SAFL Baffle BMP. Event and annual results are summarized in the following tables.
Event runoff volume performance summary
| Parameter | SAFL Baffle |
|---|---|
| Runoff Volume from Direct Watershed (ft3) | 10537 |
| Runoff Volume from Upstream BMPs (ft3) | 0 |
| Retention Volume Provided by BMP (ft3) | 0 |
| Outflow Volume from BMP (ft3) | 10537 |
| Percent Performance Goal Achieved (%) | 0 |
Annual performance goal summary
| Pollutant | Parameter | SAFL Baffle |
|---|---|---|
| Volume | Runoff from Direct Watershed (acre-ft.) | 77.61 |
| Runoff from Upstream BMPs (acre-ft.) | 0.00 | |
| Retention Volume Provided by BMP (acre-ft.) | 0.00 | |
| Outflow Volume from BMP (acre-ft.) | 77.61 | |
| Percent Performance Goal Achieved (%) | 0 | |
| Particulate phosphorus | Particulate P from Watershed (lbs.) | 0 |
| Particulate P from Upstream BMPs (lbs.) | 34.83 | |
| Particulate P Load Reduction (lbs.) | 0 | |
| Particulate P Outflow | 0 | |
| Total Percent Particulate P Reduction | 34.83 | |
| Dissolved phosphorus | Dissolved P from Watershed (lbs.) | 28.5 |
| Dissolved P from Upstream BMPs (lbs.) | 0 | |
| Dissolved P Load Reduction (lbs.) | 0 | |
| Dissolved P Outflow | 28.5 | |
| Total Percent Dissolved P Reduction (%) | 0 | |
| Total suspended solids (TSS) | TSS from Watershed (lbs.) | 11505 |
| TSS from Upstream BMPs (lbs.) | 0 | |
| TSS Load Reduction (lbs.) | 989 | |
| TSS Outflow | 10516 | |
| Total Percent TSS Reduction (%) | 8.6 |
Stormwater wetland
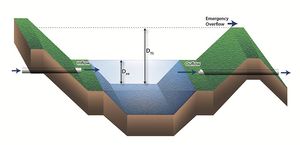
The primary goal when sizing the stormwater wetland was to treat the remaining stormwater runoff from the site not previously removed by upstream treatment train BMPs, and to attenuate peak flows from to decrease downstream storm sewer capacity needs. Figure 3.3.6 shows a typical configuration and components of a stormwater wetland. The wetland receives inflow from the biofiltration basin, the dry swale, and the SAFL baffle BMPs.
The wetland is sized to control the Water Quality Volume; flows in excess will be directed to the overflow and released at a rate less than 6.62 ft3/s. The main parameters to consider when sizing the stormwater wetland include volumes of the permanent wetland pool, the sediment forebay, low and high marsh, and micropool, areas. The stormwater wetland BMP was designed to meet the MPCA design criteria, requirements and recommendations. The wetland footprint is approximately 1.17 acres. The sizing parameters for the stormwater wetland are summarized below.
| Wetland area locations | Volume (acre-feet) | Depth (feet) |
|---|---|---|
| Permanent pool | 2.38 | 6 |
| Forebay | 0.24 | 6 |
| Low marsh | 0.36 | 1.5 |
| Micropool | 0.9 | 6 |
| High marsh | 2.75 | 4.5 |
The MIDS calculator does not require sizing inputs for non-volume reducing BMPs, but calculates pollutant removal based on assumed percent reductions for particulate phosphorous and total suspended solids. The event and annual results for the wetland BMP performance are summarized below.
Event runoff volume performance summary
| Parameter | Stormwater wetland |
|---|---|
| Runoff Volume from Direct Watershed (ft3) | 0 |
| Runoff Volume from Upstream BMPs (ft3) | 112044 |
| Retention Volume Provided by BMP (ft3) | 0 |
| Outflow Volume from BMP (ft3) | 112044 |
| Percent Performance Goal Achieved (%) | 0 |
Annual performance goal summary
| Pollutant | Parameter | Stormwater wetland |
|---|---|---|
| Volume | Runoff from Direct Watershed (acre-ft.) | 0.00 |
| Runoff from Upstream BMPs (acre-ft.) | 81.59 | |
| Retention Volume Provided by BMP (acre-ft.) | 0.00 | |
| Outflow Volume from BMP (acre-ft.) | 81.59 | |
| Percent Performance Goal Achieved (%) | 0 | |
| Particulate phosphorus | Particulate P from Watershed (lbs.) | 0 |
| Particulate P from Upstream BMPs (lbs.) | 35.65 | |
| Particulate P Load Reduction (lbs.) | 19.43 | |
| Particulate P Outflow | 16.22 | |
| Total Percent Particulate P Reduction | 55 | |
| Dissolved phosphorus | Dissolved P from Watershed (lbs.) | 0 |
| Dissolved P from Upstream BMPs (lbs.) | 29.63 | |
| Dissolved P Load Reduction (lbs.) | 0 | |
| Dissolved P Outflow | 29.63 | |
| Total Percent Dissolved P Reduction (%) | 0 | |
| Total suspended solids (TSS) | TSS from Watershed (lbs.) | 0 |
| TSS from Upstream BMPs (lbs.) | 10676 | |
| TSS Load Reduction (lbs.) | 7260 | |
| TSS Outflow | 3416 | |
| Total Percent TSS Reduction (%) | 68 |
Overall Site with Limited Infiltration Capacity BMP Treatment Train Performance
The treatment train as a whole was evaluated using the MIDS Calculator. The majority of the area drains through the SAFL Baffle and ultimately to the stormwater wetland. A small overland flow area west of the site is directed through the grass channel and biofiltration basin, before reaching the wetland at the downstream end of the treatment train. Overland flow area directly north of the site is routed through the dry swale before ultimately reaching the stormwater wetland as well. This configuration is shown in the figure to the right.
The treatment train for this scenario provides an annual removal efficiency of 32% Total Phosphorous and 72% Total Suspended Solids. Although the runoff volume removal is only 1% for the site, the wetland is able to attenuate the peak runoff flow and decrease outflow rates to the existing storm system. This allows for a reduction in required capacity in the downstream sewer system and ultimately meets the project goals. The MIDS Calculator annual performance results of the BMP treatment train as a whole are summarized below.
Annual performance goal summary
| Pollutant | Parameter | Stormwater wetland |
|---|---|---|
| Volume | Performance Goal Runoff Volume (acre-ft.) | 82.33 |
| Retention Volume Provided by BMPs (acre-ft.) | 0.74 | |
| Percent Runoff Volume Removed (%) | 1 | |
| Phosphorus | Performance Goal Particulate P Load (lbs.) | 36.95 |
| Performance Goal Dissolved P Load (lbs.) | 30.23 | |
| Particulate P Load Removed by BMPs (lbs.) | 20.75 | |
| Dissolved P Load Removed by BMPs (lbs.) | 0.6 | |
| Percent TP Removed (%) | 32 | |
| Dissolved phosphorus | Performance Goal TSS Loads (lbs.) | 12205 |
| TSS Load Removed by BMPs (lbs.) | 8789 | |
| Percent TSS Removed (%) | 72 |
Step 6: Review construction and operations criteria
Each of the BMPs included in the treatment train have unique criteria for construction and operations. Information regarding construction and operations should be reviewed in detail before design and construction of the BMPs take place. Available information for each of the BMPs used in the Site with Limited Infiltration Capacity Scenario are provided below.
