![]()
Uploads by Mtrojan
This special page shows all uploaded files.
| Date | Name | Thumbnail | Size | Description | Versions |
|---|---|---|---|---|---|
| 20:27, 28 December 2021 | Return to top.png (file) |  |
966 bytes | 1 | |
| 18:39, 23 January 2013 | Check box.png (file) |  |
1 KB | 1 | |
| 14:46, 17 February 2016 | Fish logo.png (file) | 2 KB | 1 | ||
| 18:33, 5 April 2016 | Picture1.png (file) |  |
2 KB | 1 | |
| 15:47, 5 September 2018 | Test for image mapping.png (file) |  |
2 KB | 1 | |
| 12:34, 29 April 2015 | Question mark.png (file) |  |
2 KB | 2 | |
| 14:57, 31 October 2013 | Schematic of suckering.jpg (file) |  |
2 KB | 1 | |
| 14:58, 31 October 2013 | Schematic showing annual growth.jpg (file) |  |
3 KB | 2 | |
| 15:00, 31 January 2014 | Announcement.png (file) |  |
4 KB | 1 | |
| 15:07, 17 February 2016 | Dollar logo.jpg (file) | 4 KB | 1 | ||
| 15:08, 2 September 2014 | Symbol for other bmp.jpg (file) |  |
4 KB | 1 | |
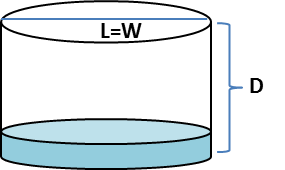
| 18:58, 23 October 2017 | Vertical cylinder.png (file) |  |
5 KB | 1 | |
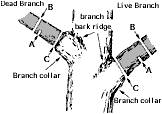
| 19:53, 12 September 2014 | Pruning branches at branch collar.jpg (file) |  |
5 KB | 2 | |
| 13:15, 2 September 2014 | Symbol used for harvest and reuse.jpg (file) |  |
5 KB | 1 | |
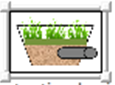
| 13:09, 16 July 2014 | Symbol for tree trench with underdrain.jpg (file) |  |
5 KB | 1 | |
| 15:26, 29 July 2014 | Symbol for stormwater wetland.jpg (file) |  |
6 KB | 1 | |
| 20:24, 11 January 2017 | Peak flow.gif (file) |  |
6 KB | 2 | |
| 14:59, 31 October 2013 | Schematic showing soil removal.jpg (file) |  |
6 KB | 1 | |
| 20:30, 29 January 2016 | Open loop calibration.pdf (file) | 7 KB | 1 | ||
| 18:48, 23 September 2014 | Schematic for disconnection credit.png (file) |  |
7 KB | 1 | |
| 20:16, 19 August 2014 | Symbol for biofiltration with an underdrain.jpg (file) |  |
7 KB | 1 | |
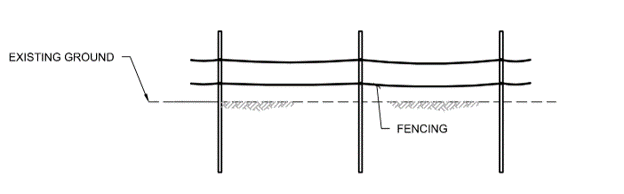
| 19:04, 7 November 2022 | Goose fencing.png (file) |  |
7 KB | 1 | |
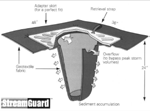
| 21:01, 13 March 2013 | Catch basin insert.png (file) |  |
7 KB | 1 | |
| 20:29, 29 January 2016 | Control point calibration.pdf (file) | 7 KB | 1 | ||
| 21:33, 17 January 2017 | MIDS version 3 announcement.png (file) |  |
7 KB | 3 | |
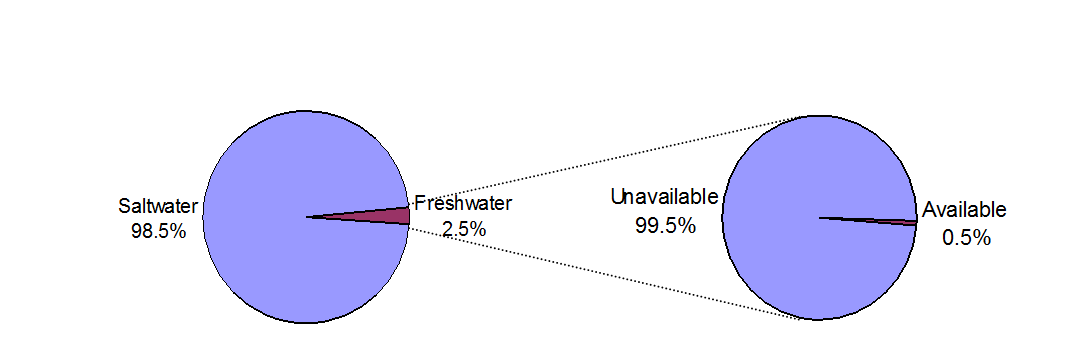
| 21:41, 8 February 2016 | Available water.png (file) |  |
7 KB | 1 | |
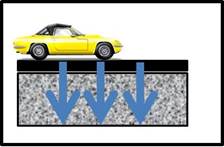
| 19:07, 26 August 2014 | MIDS calculator symbol permeable pavement.jpg (file) |  |
7 KB | 1 | |
| 14:54, 1 May 2015 | Construction stormwater icon.jpg (file) | 8 KB | 1 | ||
| 19:57, 29 August 2014 | Symbol for constructed pond.jpg (file) |  |
9 KB | 1 | |
| 15:15, 30 April 2015 | Chesapeake Stormwater Network logo.jpg (file) | 9 KB | 1 | ||
| 16:27, 26 December 2012 | Minnesota normal annual precipitation.png (file) |  |
9 KB | 2 | |
| 20:57, 17 September 2013 | Bioinfiltration MIDS.png (file) |  |
10 KB | 1 | |
| 16:46, 15 May 2013 | Mids logo.jpg (file) | 10 KB | 1 | ||
| 20:35, 27 February 2017 | Test image 1.png (file) |  |
10 KB | 3 | |
| 17:33, 5 August 2014 | Symbol for wet swale.jpg (file) |  |
10 KB | 1 | |
| 20:23, 19 August 2014 | MIDS symbol for infiltration.jpg (file) |  |
10 KB | 1 | |
| 16:24, 5 August 2014 | Symbol for swale side slope.jpg (file) |  |
10 KB | 1 | |
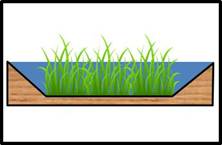
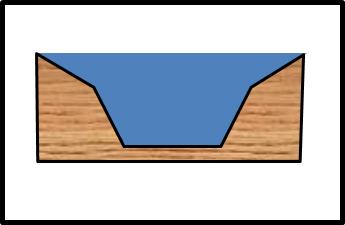
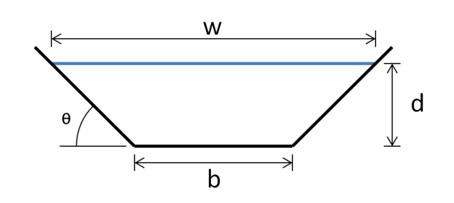
| 20:29, 27 March 2018 | Swale cross-section.png (file) |  |
10 KB | 1 | |
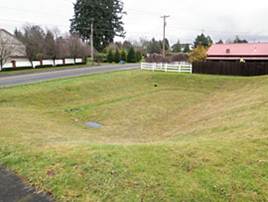
| 21:19, 21 May 2015 | Infiltration basin 1.jpg (file) |  |
10 KB | 2 | |
| 20:56, 17 September 2013 | Biofiltration.png (file) |  |
10 KB | 1 | |
| 16:23, 5 February 2021 | Roseville image.jpg (file) |  |
10 KB | 1 | |
| 20:34, 29 January 2016 | Calibration data record.pdf (file) | 11 KB | 1 | ||
| 11:56, 12 May 2021 | Version 4 image.png (file) |  |
11 KB | 1 | |
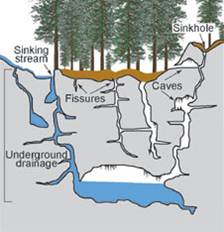
| 15:26, 16 July 2015 | Illustration of karst features.jpg (file) |  |
11 KB | 1 | |
| 20:55, 19 August 2014 | MIDS calculator green roofs symbol.jpg (file) |  |
11 KB | 1 | |
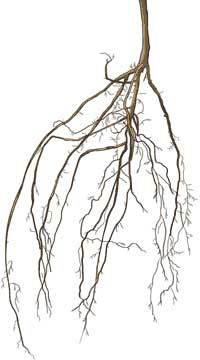
| 19:20, 4 September 2014 | Bare root.jpg (file) |  |
11 KB | 1 | |
| 20:22, 21 April 2017 | Pdf.jpg (file) |  |
11 KB | 1 | |
| 18:53, 25 September 2017 | Determining infiltration rates 2.png (file) |  |
11 KB | 1 | |
| 13:37, 2 November 2016 | Magnifying glass.jpg (file) |  |
11 KB | 1 | |
| 18:48, 25 September 2017 | Determining infiltration rates 1.png (file) |  |
11 KB | 1 |