Difference between revisions of "TCMA Chloride Management Plan - Appendix C – Sidewalk Survey Results"
| Line 6: | Line 6: | ||
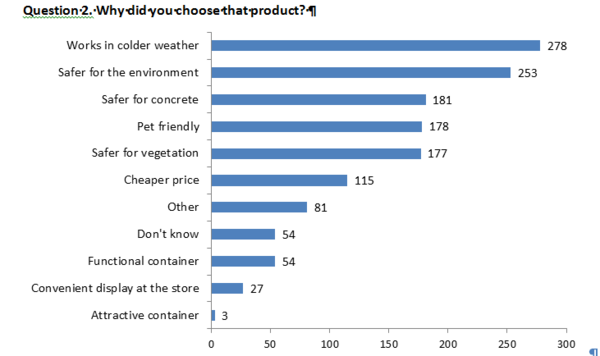
[[File:Question 2 Why did you choose that product..PNG|right|thumb|600 px|alt=This chart shows results from Question 2 Why did you choose that product|<font size=3>Question 2 Why did you choose that product</font size>]] | [[File:Question 2 Why did you choose that product..PNG|right|thumb|600 px|alt=This chart shows results from Question 2 Why did you choose that product|<font size=3>Question 2 Why did you choose that product</font size>]] | ||
| + | |||
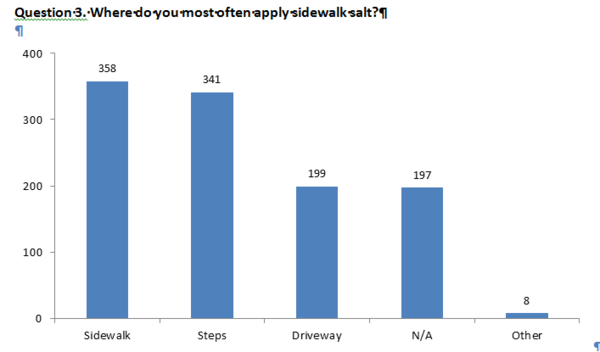
| + | [[File:Question 3 Where do you most often apply sidewalk salt.PNG|right|thumb|600 px|alt=This chart shows results from Question 3 Where do you most often apply sidewalk salt.PNG|<font size=3>Question 3 Where do you most often apply sidewalk salt.PNGt</font size>]] | ||
Revision as of 18:55, 22 March 2016
Appendix C – Sidewalk Survey Results
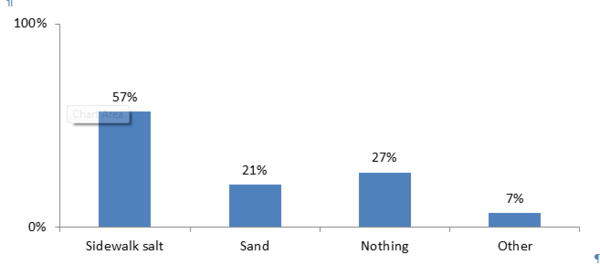
Below is a summary of results of the Sidewalk Survey that was completed by 754 residents in the TCMA from November 2011 through March 2012.


