TCMA Chloride TMDL - Watershed and Waterbody Characterization
Contents
Watershed and Waterbody Characterization
This section presents a brief description of the impaired lakes, wetlands and streams addressed in this TMDL. Watersheds, land use, water quality conditions, and sources of chloride are discussed.
Lakes and Wetlands
The Impaired Lake and Wetland Characterization in the TCMA table presents the impaired lakes and wetlands and general characteristics of each waterbody and watershed, including watershed area, percent impervious, lake area, mean depth, and volume. Percent impervious was derived using the National Land Cover Database (NLCD) from 2011 and is discussed further in the Land Use section
Impaired Lake and Wetland Characterization in the TCMA
Link to this table
| Waterbody Name | Watershed Area (ac) | % Impervious (NLCD, 2011)* | Lake Area (ac) | Mean Depth (ft) | Volume (ac-ft) |
|---|---|---|---|---|---|
| Battle Creek Lake | 4,326 | 33% | 93 | 4 | 372 |
| Brownie Lake | 452 | 53% | 18 | 22 | 404 |
| Carver Lake | 2,242 | 31% | 48 | 15 | 720 |
| Como Lake | 1,850 | 36% | 69 | 6 | 414 |
| Diamond Lake | 744 | 45% | 51 | 3 | 57 |
| Kasota Pond North | 10 | 45% | 1.4 | n/a | n/a |
| Kasota Pond West | 6 | 69% | 0.9 | n/a | n/a |
| Kohlman Lake | 7,533 | 33% | 82 | 4 | 328 |
| Little Johanna Lake | 1,703 | 50% | 17 | 10 | 170 |
| Loring Pond (South Bay)** | 34 | 17% | 7 | 7.5 | 52.5 |
| Mallard Marsh | 16 | 43% | 2.9 | n/a | n/a |
| Parkers Lake | 1,064 | 41% | 93 | 11 | 1,023 |
| Peavey Lake | 776 | 15% | 9.7 | n/a | n/a |
| Pike Lake | 5,735 | 43% | 36 | 7 | 252 |
| Powderhorn Lake | 332 | 45% | 12 | 4 | 73 |
| Silver Lake | 655 | 38% | 71 | 6 | 426 |
| South Long Lake | 114,785 | 12% | 186 | 16 | 2,976 |
| Spring Lake | 39 | 25% | 3 | 9.5 | 28.5 |
| Sweeney Lake | 2,439 | 41% | 69 | 12 | 828 |
| Tanners Lake | 1,732 | 31% | 69 | 19 | 1,311 |
| Thompson Lake | 178 | 53% | 7 | 8 | 56 |
| Valentine Lake | 2,404 | 32% | 55 | 4 | 220 |
| Wirth Lake | 426 | 13% | 37 | 11 | 407 |
Streams
The Impaired Stream Characterization in the TCMA table resents the impaired streams and watershed area and percent impervious cover of the watershed.
Impaired Stream Characterization in the TCMA
Link to this table
| Waterbody Name | Watershed Area (ac) | % Impervious (2011)* |
|---|---|---|
| Bass Creek | 5,434 | 30.9% |
| Bassett Creek | 25,209 | 33.8% |
| Battle Creek | 7,246 | 32.6% |
| Elm Creek | 66,382 | 9.7% |
| Judicial Ditch 2 | 1,587 | 20.6% |
| Minnehaha Creek | 109,151 | 14.4% |
| Raven Stream | 42,750 | 2.0% |
| Raven Stream, East Branch | 14,751 | 4.5% |
| Rush Creek, South Fork | 13,844 | 4.7% |
| Sand Creek (includes AUIDs: 07020012-513 and 07020012-662) | 175,578 | 2.0% |
| Unnamed creek (Headwaters to Medicine Lk) | 6,447 | 37.6% |
| Unnamed creek (Unnamed ditch to wetland) | 793 | 37.6% |
| Unnamed Stream (Unnamed lk 62-0205-00 to Little Lk Johanna) | 1,627 | 51.6% |
-* Source: 2011 NLCD
Subwatersheds=
Watershed maps for each impaired waterbody are included in Appendix A-1.
Land Use
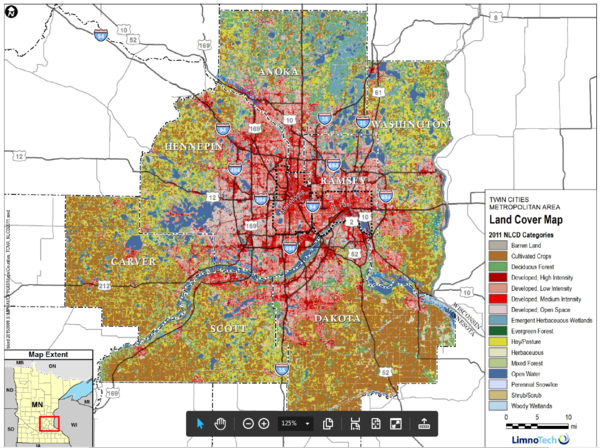
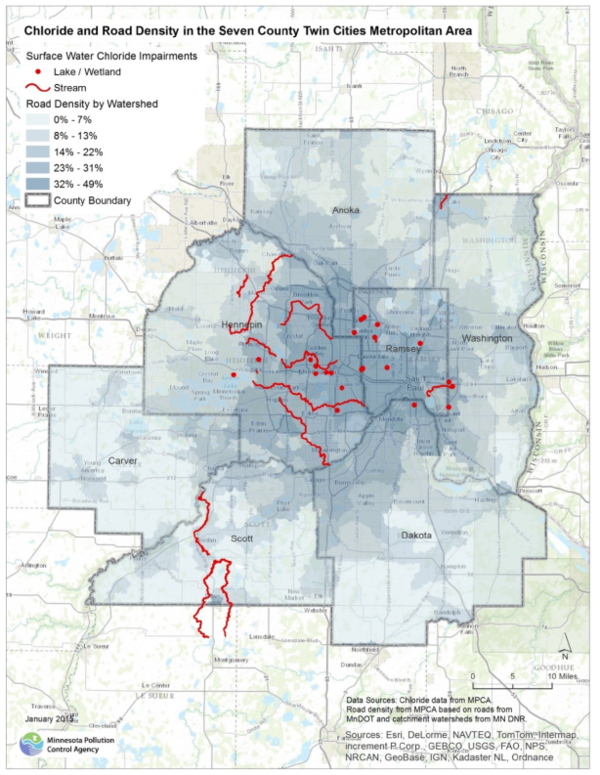
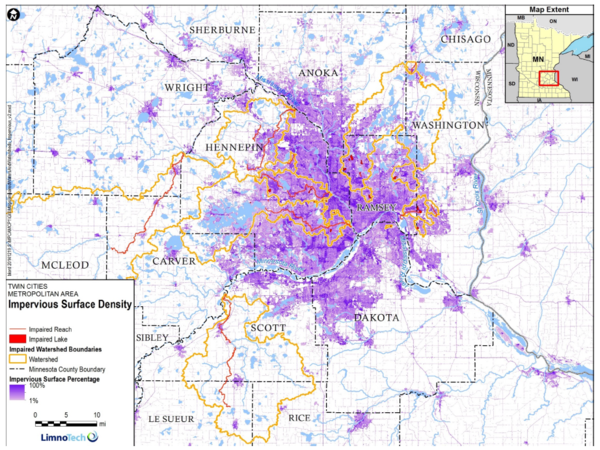
The land use in the TCMA is largely urban in the core of Minneapolis and St. Paul with a transition to rural and agricultural moving outward through the suburbs. This land use pattern can be seen in Figure 2 which is based on the NLCD from 2011, the most recent national land cover product. This data is based on 2011 Landsat satellite data. Road densities by watershed are presented in Figure 3 based on road density information provided by the Minnesota Department of Transportation (MnDOT) and watershed catchments developed by Minnesota Department of Natural Resources (DNR). The NLCD also includes a layer for percent impervious (Xian et al., 2011). The impervious layer is comprised of 30m x 30m pixels each with a percent impervious value. The pixels for each drainage area are averaged to calculate a percent impervious for each impaired watershed. The percent impervious for the TCMA is shown in Figure 4 below. Similar to the land use pattern, both road densities and percent impervious are shown to decline moving outward from the TCMA core through the suburbs. The percent impervious for each impaired watershed is listed above in the Impaired Lake and Wetland Characterization in the TCMA table and the Impaired Stream Characterization in the TCMA table.
Current and Historic Chloride Concentrations
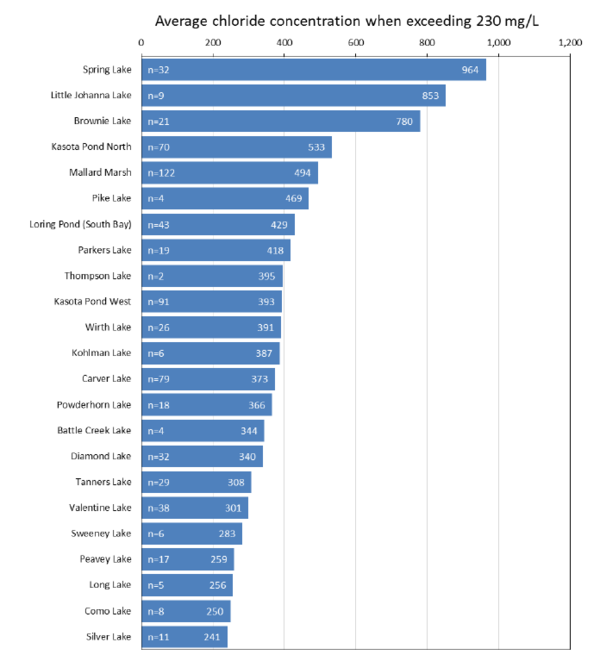
Ambient chloride data for each impaired waterbody were compiled and assessed to understand current and historic water quality. A summary of the assessment is presented in Appendix A-1. As stated in Section 2, the chronic chloride standard of 230 mg/L has been applied as the numeric WQT for this TMDL. The impaired lakes, wetlands, and streams were compared in terms of the concentrations of chloride measured and ranked from highest concentrations to lowest. These rankings are presented in Figure 5 and Figure 6. These figures are not a direct reflection of the 303(d) listing assessment; rather they are intended to make a relative comparison of the extent of impairment across impaired waters. The values presented in these figures were calculated by first identifying the maximum chloride concentration measured in a waterbody on individual sampling days, and then averaging all the individual sampling day maximums that exceed the target of 230 mg/L for the period from 2003-2013. These figures indicate the variability in one waterbody or watershed to the next in terms of the severity of the impairment. This information may be used to target priority areas for reductions in chloride loads. Table 5 and Table 6 show the number of days with samples exceeding the chronic and acute standard within the last 10 years for lakes and streams, respectively. More information about the chloride trends in the TCMA can be found in section 2.3 of the TCMA Chloride Management Plan.
Number of days with lake and wetland samples exceeding the chronic and acute criterion in the TCMA, 2003-2013
Link to this table
| Lake | Number of Individual Days with Samples | Number of Days with Samples Exceeding 230 mg/L Chronic Criterion | Number of Days with Samples Exceeding 860 mg/L Acute Criterion |
|---|---|---|---|
| Battle Creek Lake | 81 | 4 | 0 |
| Brownie Lake | 27 | 21 | 5 |
| Carver Lake | 138 | 79 | 0 |
| Como Lake | 84 | 8 | 0 |
| Diamond Lake | 117 | 32 | 1 |
| Kasota Pond North | 91 | 70 | 8 |
| Kasota Pond West | 91 | 91 | 0 |
| Kohlman Lake | 80 | 6 | 1 |
| Little Johanna Lake | 9 | 9 | 5 |
| Loring Pond (South Bay) | 65 | 43 | 3 |
| Mallard Marsh | 122 | 122 | 0 |
| Parkers Lake | 30 | 19 | 0 |
| Peavey Lake | 20 | 17 | 0 |
| Pike Lake | 9 | 4 | 0 |
| Powderhorn Lake | 67 | 18 | 0 |
| Silver Lake | 78 | 11 | 0 |
| South Long Lake | 149 | 5 | 0 |
| Spring Lake | 32 | 32 | 20 |
| Sweeney Lake | 44 | 6 | 0 |
| Tanners Lake | 128 | 29 | 0 |
| Thompson Lake | 18 | 2 | 0 |
| Valentine Lake | 76 | 38 | 0 |
| Wirth | 68 | 17 | 0 |
Number of days with stream samples exceeding the chronic and acute criterion in the TCMA, 2003-2013
Link to this table
| Stream | Number of Individual Days with Samples | Number of Days with Samples Exceeding 230 mg/L Chronic Criterion | Number of Days with Samples Exceeding 860 mg/L Acute Criterion |
|---|---|---|---|
| Bass Creek | 26 | 8 | 2 |
| Bassett Creek | 273 | 35 | 0 |
| Battle Creek | 366 | 39 | 10 |
| Elm Creek | 209 | 20 | 14 |
| Judicial Ditch 2 | 45 | 9 | 0 |
| Minnehaha Creek | 1,281 | 242 | 12 |
| Nine Mile Creek | 304 | 40 | 1 |
| Raven Stream | 48 | 11 | 0 |
| Raven Stream, East Branch | 39 | 7 | 0 |
| Rush Creek, South Fork | 87 | 14 | 0 |
| Sand Creek (includes AUIDs: 07020012-513 and 07020012-662) | 389 | 19 | 0 |
| Shingle Creek | 330 | 66 | 15 |
| Unnamed creek (Headwaters to Medicine Lk) | 27 | 8 | 0 |
| Unnamed creek (Unnamed ditch to wetland) | 35 | 33 | 0 |
| Unnamed Stream (Unnamed lk 62-0205-00 to Little Lk Johanna) | 6 | 3 | 1 |
Chloride Source Summary
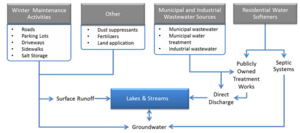
Chloride enters the TCMA lakes, streams, wetlands, and groundwater from a variety of sources. A conceptual model diagram of the primary anthropogenic sources is shown in Figure 7. A study of chloride fate and transport in the TCMA estimated that approximately 22%-30% of the chloride applied in the TCMA was exported out of the TCMA via streamflow in the Mississippi, Minnesota, and St. Croix Rivers (Stefan et al., 2008). Therefore, 70%-78% of the applied percentage retained in the TCMA suggests that chloride may continue to accumulate locally and eventually make its way to the deep aquifers. This implies that, on average, chloride concentrations in the TCMA waterbodies are increasing with time. If the chloride loading remains steady, the concentrations will level out when equilibrium develops between loadings and transport out of the TCMA. By the same token, if loadings are reduced sufficiently and persistently, the chloride concentrations in TCMA waterbodies will begin to decrease and will continue to decrease until a new equilibrium is reached. Each of the sources in Figure 7 is briefly described below.chloride was estimated to remain in the TCMA soils, lakes, wetlands, and groundwater. Since chloride does not break down, this potentially high
