TCMA Chloride TMDL - Watershed and Waterbody Characterization
Contents
- 1 Watershed and Waterbody Characterization
- 2 Permitted Sources
- 2.1 Municipal Separate Storm Sewer System (MS4) Winter Maintenance Activities
- 2.2 Municipal and Industrial Wastewater Sources
- 2.3 Non-permitted Sources
- 2.4 Parking Lots, Driveways, and Sidewalks – Non-permitted Runoff from Winter Maintenance Activities
- 2.5 Residential Water Softeners
- 2.6 Agriculture
- 2.7 Natural Background Sources of Chloride
- 2.8 Other Potential Sources
Watershed and Waterbody Characterization
This section presents a brief description of the impaired lakes, wetlands and streams addressed in this TMDL. Watersheds, land use, water quality conditions, and sources of chloride are discussed.
Lakes and Wetlands
The Impaired Lake and Wetland Characterization in the TCMA table presents the impaired lakes and wetlands and general characteristics of each waterbody and watershed, including watershed area, percent impervious, lake area, mean depth, and volume. Percent impervious was derived using the National Land Cover Database (NLCD) from 2011 and is discussed further in the Land Use section
Impaired Lake and Wetland Characterization in the TCMA
Link to this table
| Waterbody Name | Watershed Area (ac) | % Impervious (NLCD, 2011)* | Lake Area (ac) | Mean Depth (ft) | Volume (ac-ft) |
|---|---|---|---|---|---|
| Battle Creek Lake | 4,326 | 33% | 93 | 4 | 372 |
| Brownie Lake | 452 | 53% | 18 | 22 | 404 |
| Carver Lake | 2,242 | 31% | 48 | 15 | 720 |
| Como Lake | 1,850 | 36% | 69 | 6 | 414 |
| Diamond Lake | 744 | 45% | 51 | 3 | 57 |
| Kasota Pond North | 10 | 45% | 1.4 | n/a | n/a |
| Kasota Pond West | 6 | 69% | 0.9 | n/a | n/a |
| Kohlman Lake | 7,533 | 33% | 82 | 4 | 328 |
| Little Johanna Lake | 1,703 | 50% | 17 | 10 | 170 |
| Loring Pond (South Bay)** | 34 | 17% | 7 | 7.5 | 52.5 |
| Mallard Marsh | 16 | 43% | 2.9 | n/a | n/a |
| Parkers Lake | 1,064 | 41% | 93 | 11 | 1,023 |
| Peavey Lake | 776 | 15% | 9.7 | n/a | n/a |
| Pike Lake | 5,735 | 43% | 36 | 7 | 252 |
| Powderhorn Lake | 332 | 45% | 12 | 4 | 73 |
| Silver Lake | 655 | 38% | 71 | 6 | 426 |
| South Long Lake | 114,785 | 12% | 186 | 16 | 2,976 |
| Spring Lake | 39 | 25% | 3 | 9.5 | 28.5 |
| Sweeney Lake | 2,439 | 41% | 69 | 12 | 828 |
| Tanners Lake | 1,732 | 31% | 69 | 19 | 1,311 |
| Thompson Lake | 178 | 53% | 7 | 8 | 56 |
| Valentine Lake | 2,404 | 32% | 55 | 4 | 220 |
| Wirth Lake | 426 | 13% | 37 | 11 | 407 |
Streams
The Impaired Stream Characterization in the TCMA table resents the impaired streams and watershed area and percent impervious cover of the watershed.
Impaired Stream Characterization in the TCMA
Link to this table
| Waterbody Name | Watershed Area (ac) | % Impervious (2011)* |
|---|---|---|
| Bass Creek | 5,434 | 30.9% |
| Bassett Creek | 25,209 | 33.8% |
| Battle Creek | 7,246 | 32.6% |
| Elm Creek | 66,382 | 9.7% |
| Judicial Ditch 2 | 1,587 | 20.6% |
| Minnehaha Creek | 109,151 | 14.4% |
| Raven Stream | 42,750 | 2.0% |
| Raven Stream, East Branch | 14,751 | 4.5% |
| Rush Creek, South Fork | 13,844 | 4.7% |
| Sand Creek (includes AUIDs: 07020012-513 and 07020012-662) | 175,578 | 2.0% |
| Unnamed creek (Headwaters to Medicine Lk) | 6,447 | 37.6% |
| Unnamed creek (Unnamed ditch to wetland) | 793 | 37.6% |
| Unnamed Stream (Unnamed lk 62-0205-00 to Little Lk Johanna) | 1,627 | 51.6% |
-* Source: 2011 NLCD
Subwatersheds
Watershed maps for each impaired waterbody are included in Appendix A-1.
Land Use
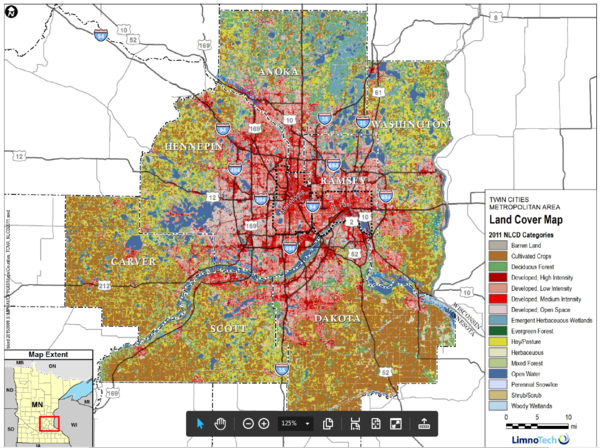
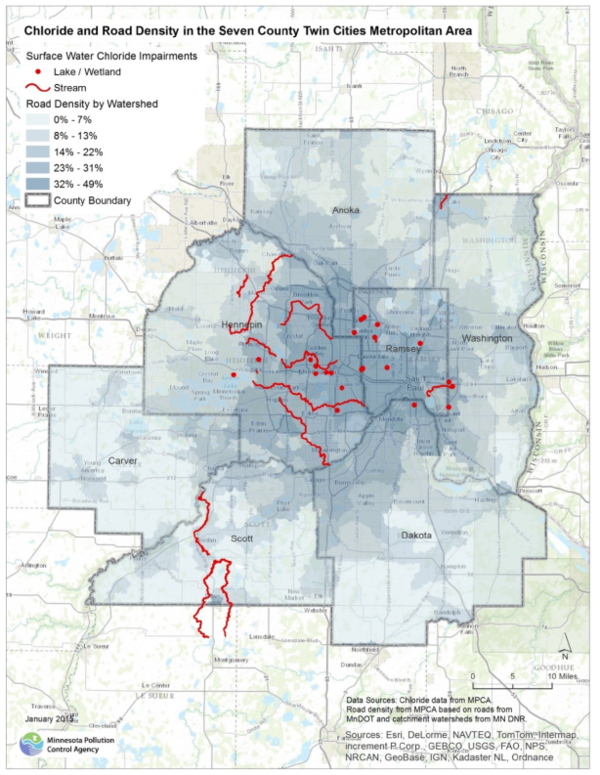
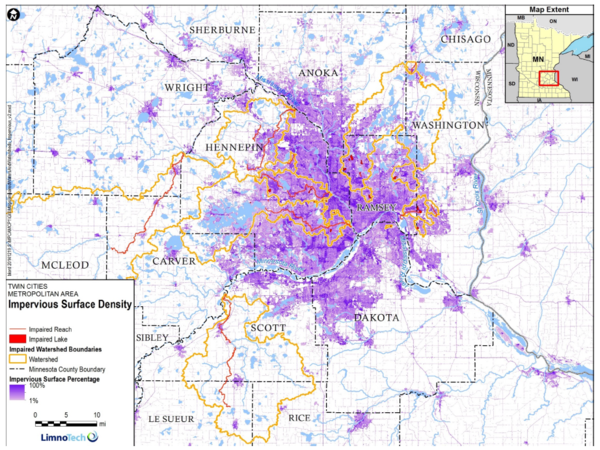
The land use in the TCMA is largely urban in the core of Minneapolis and St. Paul with a transition to rural and agricultural moving outward through the suburbs. This land use pattern can be seen in the Land Use in the TCMA map which is based on the NLCD from 2011, the most recent national land cover product. This data is based on 2011 Landsat satellite data. Road densities by watershed are presented in the Chloride Impairments and Road Density in the TCMA map based on road density information provided by the Minnesota Department of Transportation (MnDOT) and watershed catchments developed by Minnesota Department of Natural Resources (DNR). The NLCD also includes a layer for percent impervious (Xian et al., 2011 ). The impervious layer is comprised of 30m x 30m pixels each with a percent impervious value. The pixels for each drainage area are averaged to calculate a percent impervious for each impaired watershed. The percent impervious for the TCMA is shown in the Percent Impervious in the TCMA map below. Similar to the land use pattern, both road densities and percent impervious are shown to decline moving outward from the TCMA core through the suburbs. The percent impervious for each impaired watershed is listed above in the Impaired Lake and Wetland Characterization in the TCMA table and the Impaired Stream Characterization in the TCMA table.
Current and Historic Chloride Concentrations
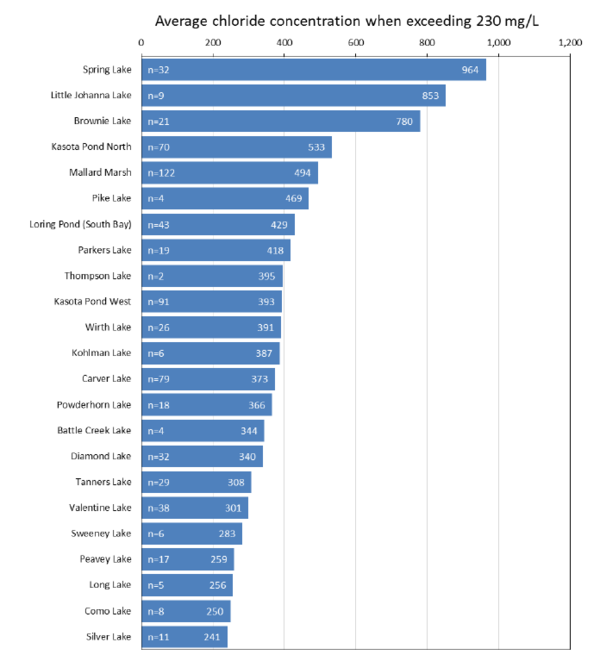
Ambient chloride data for each impaired waterbody were compiled and assessed to understand current and historic water quality. A summary of the assessment is presented in Appendix A-1. As stated in the TCMA Chloride TMDL - Applicable Water Quality Standards and Numeric Water Quality Targets Section, the chronic chloride standard of 230 mg/L has been applied as the numeric WQT for this TMDL. The impaired lakes, wetlands, and streams were compared in terms of the concentrations of chloride measured and ranked from highest concentrations to lowest. These rankings are presented in Figure 5 and Figure 6. These figures are not a direct reflection of the 303(d) listing assessment; rather they are intended to make a relative comparison of the extent of impairment across impaired waters. The values presented in these figures were calculated by first identifying the maximum chloride concentration measured in a waterbody on individual sampling days, and then averaging all the individual sampling day maximums that exceed the target of 230 mg/L for the period from 2003-2013. These figures indicate the variability in one waterbody or watershed to the next in terms of the severity of the impairment. This information may be used to target priority areas for reductions in chloride loads. Table 5 and Table 6 show the number of days with samples exceeding the chronic and acute standard within the last 10 years for lakes and streams, respectively. More information about the chloride trends in the TCMA can be found in section 2.3 of the TCMA Chloride Management Plan.
Number of days with lake and wetland samples exceeding the chronic and acute criterion in the TCMA, 2003-2013
Link to this table
| Lake | Number of Individual Days with Samples | Number of Days with Samples Exceeding 230 mg/L Chronic Criterion | Number of Days with Samples Exceeding 860 mg/L Acute Criterion |
|---|---|---|---|
| Battle Creek Lake | 81 | 4 | 0 |
| Brownie Lake | 27 | 21 | 5 |
| Carver Lake | 138 | 79 | 0 |
| Como Lake | 84 | 8 | 0 |
| Diamond Lake | 117 | 32 | 1 |
| Kasota Pond North | 91 | 70 | 8 |
| Kasota Pond West | 91 | 91 | 0 |
| Kohlman Lake | 80 | 6 | 1 |
| Little Johanna Lake | 9 | 9 | 5 |
| Loring Pond (South Bay) | 65 | 43 | 3 |
| Mallard Marsh | 122 | 122 | 0 |
| Parkers Lake | 30 | 19 | 0 |
| Peavey Lake | 20 | 17 | 0 |
| Pike Lake | 9 | 4 | 0 |
| Powderhorn Lake | 67 | 18 | 0 |
| Silver Lake | 78 | 11 | 0 |
| South Long Lake | 149 | 5 | 0 |
| Spring Lake | 32 | 32 | 20 |
| Sweeney Lake | 44 | 6 | 0 |
| Tanners Lake | 128 | 29 | 0 |
| Thompson Lake | 18 | 2 | 0 |
| Valentine Lake | 76 | 38 | 0 |
| Wirth | 68 | 17 | 0 |
Number of days with stream samples exceeding the chronic and acute criterion in the TCMA, 2003-2013
Link to this table
| Stream | Number of Individual Days with Samples | Number of Days with Samples Exceeding 230 mg/L Chronic Criterion | Number of Days with Samples Exceeding 860 mg/L Acute Criterion |
|---|---|---|---|
| Bass Creek | 26 | 8 | 2 |
| Bassett Creek | 273 | 35 | 0 |
| Battle Creek | 366 | 39 | 10 |
| Elm Creek | 209 | 20 | 14 |
| Judicial Ditch 2 | 45 | 9 | 0 |
| Minnehaha Creek | 1,281 | 242 | 12 |
| Nine Mile Creek | 304 | 40 | 1 |
| Raven Stream | 48 | 11 | 0 |
| Raven Stream, East Branch | 39 | 7 | 0 |
| Rush Creek, South Fork | 87 | 14 | 0 |
| Sand Creek (includes AUIDs: 07020012-513 and 07020012-662) | 389 | 19 | 0 |
| Shingle Creek | 330 | 66 | 15 |
| Unnamed creek (Headwaters to Medicine Lk) | 27 | 8 | 0 |
| Unnamed creek (Unnamed ditch to wetland) | 35 | 33 | 0 |
| Unnamed Stream (Unnamed lk 62-0205-00 to Little Lk Johanna) | 6 | 3 | 1 |
Chloride Source Summary
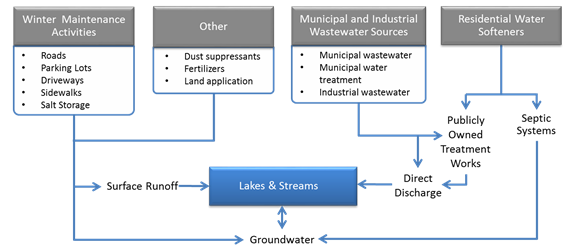
Chloride enters the TCMA lakes, streams, wetlands, and groundwater from a variety of sources. A conceptual model diagram of the primary anthropogenic sources is shown in the Conceptual model of anthropogenic sources of chloride and pathways chart below. A study of chloride fate and transport in the TCMA estimated that approximately 22%-30% of the chloride applied in the TCMA was exported out of the TCMA via streamflow in the Mississippi, Minnesota, and St. Croix Rivers (Stefan et al., 2008). Therefore, 70%-78% of the applied percentage retained in the TCMA suggests that chloride may continue to accumulate locally and eventually make its way to the deep aquifers. This implies that, on average, chloride concentrations in the TCMA waterbodies are increasing with time. If the chloride loading remains steady, the concentrations will level out when equilibrium develops between loadings and transport out of the TCMA. By the same token, if loadings are reduced sufficiently and persistently, the chloride concentrations in TCMA waterbodies will begin to decrease and will continue to decrease until a new equilibrium is reached. Each of the sources in the Conceptual model of anthropogenic sources of chloride and pathways below is briefly described below.chloride was estimated to remain in the TCMA soils, lakes, wetlands, and groundwater. Since chloride does not break down, this potentially high
Permitted Sources
Municipal Separate Storm Sewer System (MS4) Winter Maintenance Activities
Winter maintenance activities include snow and ice removal. Application of deicing and anti-icing chemicals, primarily salt, is common. Salt is applied to a variety of surfaces such as roads, parking lots, driveways, and sidewalks. The chemical properties of sodium chloride, most commonly salt, make it effective at melting ice, but these properties also result in chloride dissolving in water and being transported with snow melt and stormwater runoff to lakes, streams and wetlands. The dissolved chloride moves with the melted snow and ice, during melting events, and ends up in the local water resources. Because salt is typically applied on impervious surfaces during frozen ground conditions, the snow melt and stormwater runoff carrying the chloride has little opportunity to infiltrate and the majority will flow overland into local surface waters. However, chloride laden runoff that does infiltrate will enter shallow groundwater eventually and either flow via subsurface flow into local surface waters or into deep aquifers. Runoff from salt storage facilities is another potential source of salt. Chloride sources related to runoff from winter maintenance activities are largely covered under the MS4 permitting program. The St. Anthony Falls Laboratory at the University of Minnesota (UMN) developed an inventory of road salt uses in the TCMA for the MnDOT (Sander et al., 2007). The inventory estimated the total amount of road salt used for winter maintenance activities in the TCMA to be 349,000 tons per 17 year. Estimates of use by various entities included: cities ~ 33%; MnDOT ~ 23%; counties ~ 20%; commercial operators ~ 19%; and packaged ~ 5%.
Roads
The TCMA is estimated to have over 26,000 lane miles of roadways (Sander et al., 2007). Based on salt purchasing records and number of lane miles for the MnDOT, counties, and cities in the TCMA, the application rates range from 3 – 35 tons of road salt per lane mile per year (Wenck, 2009). These TCMA application rate estimates are consistent with national estimates of 10 to 30 tons per lane mile per winter season (Mullaney, 2009).
A survey of municipal winter maintenance professionals in the TCMA, found that typical application rates range from 100 to 600 lbs. of salt applied per lane mile per event, which is consistent with previous evaluations of road salt application rates (LimnoTech, 2013). However, rates can be much higher on hills, near intersections, and other ice problem areas. Higher speed roadways will typically have higher salt application rates. Some events may require multiple passes of salt application and increase the application rate per event.
A list of MS4 permittees within each impaired watershed area is included in TCMA Chloride TMDL - Impaired and High Risk Waterbodies by Location
Parking Lots, Driveways, and Sidewalks
MS4s also provide winter maintenance on parking lots, driveways, and sidewalks. Estimates of application rates for this source are shown in more detail in the Parking Lots, Driveways, and Sidewalks – Non-permitted Runoff from Winter Maintenance Activities section below.
Municipal and Industrial Wastewater Sources
Municipal wastewater, backwash from municipal water treatment facilities, and industrial facilities with waste streams may contain chloride. The concentration of chloride present in the waste stream will vary for every facility and is dependent on the source of chloride. The major source of chloride to municipal wastewater treatment plants (WWTP) is from residential water softeners (>90% in some municipalities). Industrial facilities may discharge directly to surface waters following treatment, or may discharge to a sanitary sewer system which transports the wastewater to a WWTP for further treatment prior to discharge to surface water. A range of industrial facilities discharge directly to waters impaired by chloride. These include food processing facilities, manufacturing, pipeline terminals, biofuel facilities, and groundwater treatment systems. Discharge of chloride from municipal and industrial wastewater sources are covered by individual or general permits. Monitoring data for theWWTP are not widely available at this point in time. However, chloride concentrations in the WWTP effluent for three WWTPs in the Sand Creek impaired watershed average from 521 mg/L to 618 mg/L.
A list of National Pollutant Discharge Elimination System (NPDES) wastewater dischargers and chloride allocations within each impaired watershed area is included in Appendix A-3 and Appendix A-4, respectively. They include both individual permits (denoted by NPDES permit numbers with an MN00 prefix) and general permits (denoted by an MNG prefix). The MNG25 general permit covers untreated noncontact cooling water discharges. The MNG255 general permit covers treated noncontact cooling water discharges. The MNG64 general permit covers water treatment facility filter backwash discharges. Individual industrial permits include discharges of noncontact cooling water, geothermal cooling water, reverse osmosis reject water, industrial process water and industrial stormwater.
Non-permitted Sources
Non-permitted sources refer to sources outside of the jurisdiction of permitted MS4s. These include runoff from winter maintenance activities outside of permitted MS4s, residential water softeners, agricultural runoff, natural sources, and others. Brief descriptions of these sources are provided below.
Parking Lots, Driveways, and Sidewalks – Non-permitted Runoff from Winter Maintenance Activities
Commercial sources of deicing salt can vary greatly between different watersheds and includes salt applied to parking lots, driveways, and sidewalks on commercial property. The land owner or tenant may conduct winter maintenance activities, or winter maintenance may be contracted with private winter maintenance providers. After evaluating all available literature sources, it is estimated that between 5% and 45% of the total deicing salt used is from commercial sources. The amount of chloride coming from commercial sources is variable, and is dependent on the characteristics of the watershed, including the amount of impervious area. To provide more accurate and Minnesota specific estimates of the amount of chloride coming from that source, small commercial applicator rates have been quantified by the MPCA (Fortin, 2012a). Application rates of salt on parking lots are estimated to range from 0.1 to 1 ton per acre per event, and typically 6.4 tons per acre per year. For sidewalks, the application rate is estimated to range from 8 to 25 lbs per 1,000 square feet per event (0.2 to 0.5 tons per acre per event).
Residential winter maintenance salt use has been estimated from purchasing records. Packaged deicer for home and commercial use is estimated to account for 5% of the total in the TCMA, while bulk deicing salt applied by commercial snow and ice control companies accounted for 19% of the total salt used in the TCMA (Sander et al. 2007).
More area specific residential and commercial estimates of chloride usage can be determined on a watershed basis by digitizing all of the residential and commercial impervious surfaces and multiplying by the application rates. This will also identify specific areas within the watershed to target training and education efforts. While this will provide a range, a more accurate chloride usage value could be obtained by talking with each individual residential and commercial chloride user to determine how much salt they use during each event and summing up these values over the individual watershed.
Residential Water Softeners
Hardness is a measure of the calcium and magnesium carbonate concentration in water. The use of water softeners is common in areas where the water supply is considered to be “hard”. Most water softeners use chloride ions to replace calcium and magnesium ions. Chloride from this salt is delivered to the environment either through discharge to a septic system or by delivery to a WWTP. Septic systems become more prevalent in the rural areas outside of the TCMA urban core. The chloride that comes from septic systems enters either the shallow groundwater or local streams through subsurface flow. Chloride loading from any individual home water softener is dependent on many variables and is specific to the individual homeowner’s water chemistry, water use, hardness preferences and softener efficiency. At this time the exact chloride loading from residential water softeners is not available. However, where the primary source of household water is hard (as it is throughout the metro) and it is not softened by municipal water utility, residential water softeners are the primary source of chloride to the WWTPs. The Sand Creek watershed is an example of this; chloride concentrations in theWWTP effluent for three WWTPs located in the watershed average from 521 mg/L to 618 mg/L.
Agriculture
Agricultural crop land may be a source of chloride to lakes and streams. Agricultural land uses increase in the areas outside the urban core of the TCMA. Fertilizers and biosolids from food processing and publicly owned treatment works contain chloride. The application of fertilizers and biosolids on crop land can result in chlorides being transported to lakes and streams through surface runoff as well as infiltration into shallow groundwater and subsequent recharge of lakes and streams. Potassium chloride (KCl) is the most commonly used fertilizer containing chloride. While not currently suspected to be a significant source of chloride, estimates of the amount of chloride in land-applied fertilizers and biosolids in the TCMA are not available. An on-going evaluation by North Dakota State University – Department of Agriculture and Biosystems Engineering indicates that chloride concentrations from agricultural drainage can range from 8.6 mg/L to 37.4 mg/L [the final results of this study have not been published].
Natural Background Sources of Chloride
Chloride occurs naturally in soil, rock, and mineral formations. Chloride is naturally present in Minnesota’s groundwater due to the natural weathering of these formations. Glacial deposits from eroded igneous rocks and clay minerals with chloride ions attached are potential sources in the TCMA. Natural background levels of chloride in surface runoff and groundwater vary depending on the geology. The natural background concentration in small streams in the TCMA has been estimated to be 18.7 mg/L (Stefan et al., 2008). A natural background concentration for lakes has not been estimated; however, the natural background load from surface runoff to lakes was assumed to be at a concentration of 18.7 mg/L as well. This background concentration characterizes runoff that is not impacted by current or historical applications of other anthropogenic sources of chloride. Concentrations of chloride in precipitation are estimated to be 0.1 mg/L to 0.2 mg/L (Chapra et al., 2009).
Other Potential Sources
Sources of chloride to the TCMA lakes and streams other than those discussed above exist but are considered to be small. One such source of chloride is the use of dust suppressants on gravel roads and parking areas. Chloride is a common constituent found at high concentrations in dust suppressants. Landfill leachate has also been shown to contain elevated levels of chloride (Mullaney et al., 2009). The use of aluminum chloride for treatment of lake sediments, or ferric chloride for treatment of stormwater are also sources of chloride, and should be avoided in waters and watersheds with chloride impairments.
This page was last edited on 23 November 2022, at 15:57.
