Difference between revisions of "Rainfall frequency maps"
m |
m |
||
| Line 5: | Line 5: | ||
*[http://www.nws.noaa.gov/oh/hdsc/FAQ.html Frequently Asked Questions about Atlas 14] | *[http://www.nws.noaa.gov/oh/hdsc/FAQ.html Frequently Asked Questions about Atlas 14] | ||
| − | To see information on frequency-volume relationships, see | + | To see information on frequency-volume relationships, see [http://stormwater.pca.state.mn.us/index.php/Rainfall_volume-frequency_maps this page] or [http://stormwater.pca.state.mn.us/images/a/a8/Issue_paper_B_-_precipitation_frequency_analysis_and_use.pdf Issue Paper B]. |
[[file:Atlas 14 MSP airport.png|400px|left|thumb|alt=MSP airport Atlas 14 graphs|<font size=3>'''Minneapolis-St. Paul International Airport'''</font size>]] | [[file:Atlas 14 MSP airport.png|400px|left|thumb|alt=MSP airport Atlas 14 graphs|<font size=3>'''Minneapolis-St. Paul International Airport'''</font size>]] | ||
Revision as of 15:15, 28 December 2015
Information: Precipitation frequency information (Atlas 14) has been updated by the National Oceanic and Atmospheric Administration (NOAA). We recommend using Atlas 14.
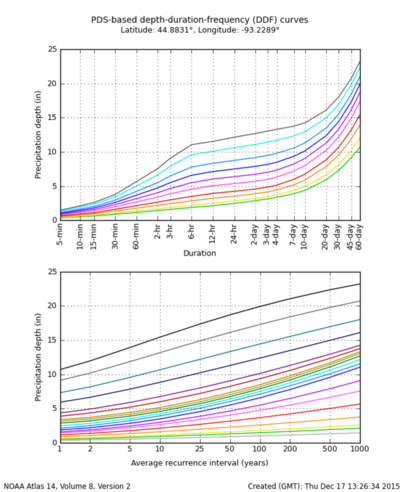
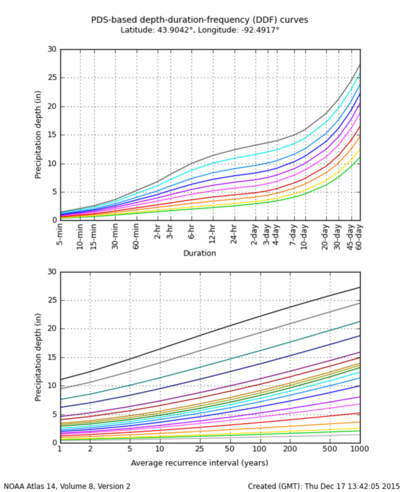
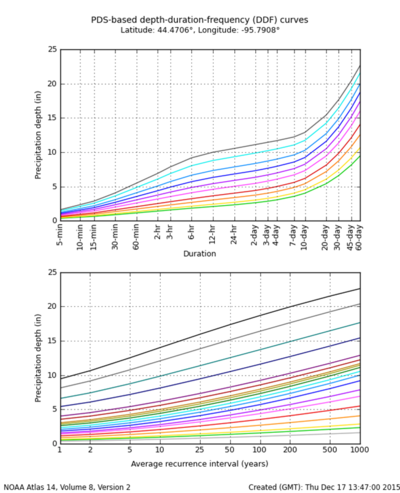
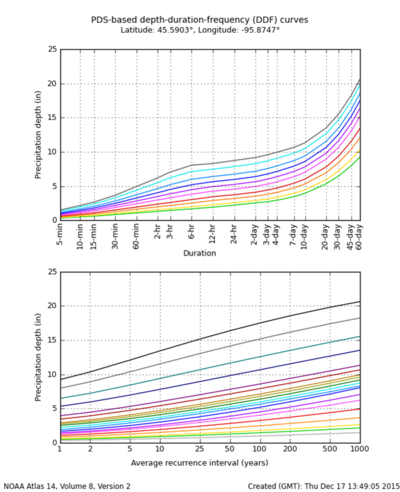
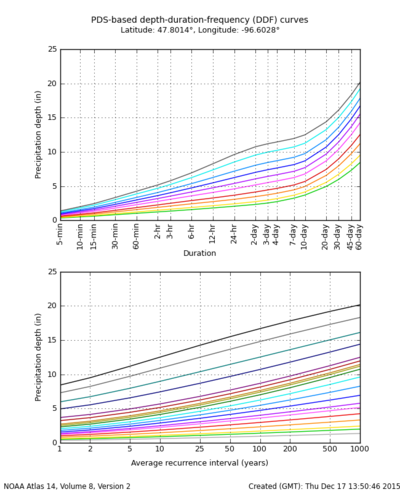
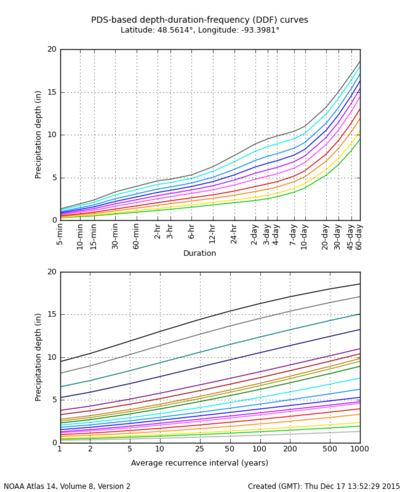
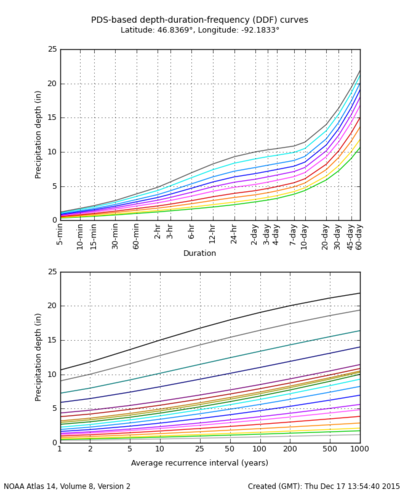
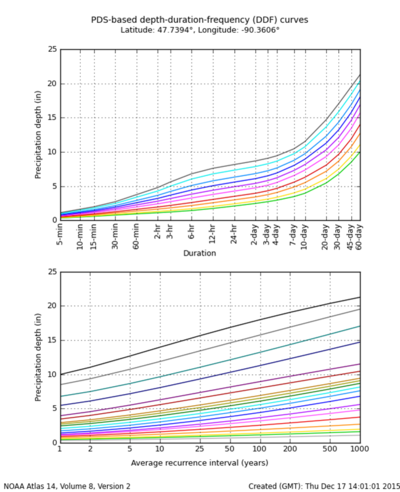
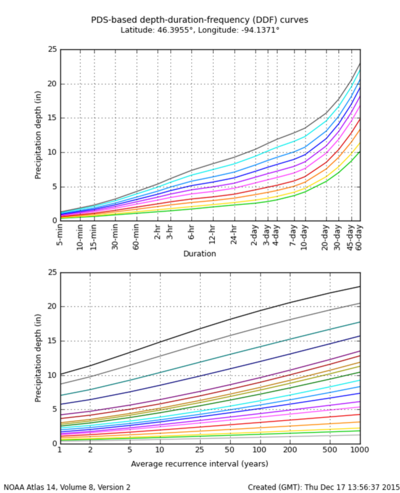
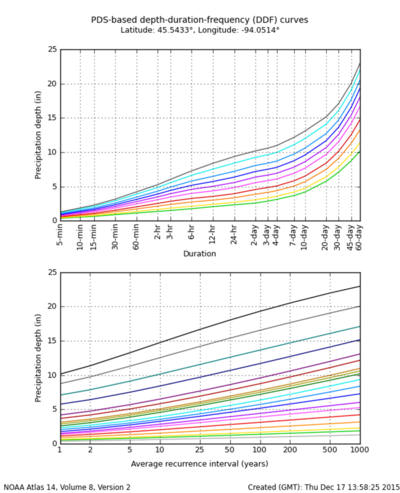
NOAA's Atlas 14, Volume 8 precipitation frequency information can be found on NOAA's precipitation frequency data server. Rainfall frequency maps from Technical Paper 40 have been moved to this page. Although we recommend going to the NOAA site for rainfall information, we've provided rainfall frequency plots for several locations in Minnesota. To see a comparison of Atlas 14 and TP-40, link here. For additional information on Atlas 14 and comparisons with TP-40, see the following pages.
To see information on frequency-volume relationships, see this page or Issue Paper B.
