
Difference between revisions of "Site assessment, preparation, design considerations and recommendations for vegetation in stormwater management"
| Line 195: | Line 195: | ||
In general and in terms of supporting most plants, optimal growth and development occurs when soil moisture content is between approximately 40-50% of AWC and FC. Wilting begins to occur at <40% AWC when the roots’ moisture extraction from the soil pores is inhibited as water potential increases in the roots relative to the surrounding soil. However, it is important to understand that vegetation growth and development can be arrested or mortality can occur both when soil moisture is limited (below PWP) and excessive (in saturated conditions). | In general and in terms of supporting most plants, optimal growth and development occurs when soil moisture content is between approximately 40-50% of AWC and FC. Wilting begins to occur at <40% AWC when the roots’ moisture extraction from the soil pores is inhibited as water potential increases in the roots relative to the surrounding soil. However, it is important to understand that vegetation growth and development can be arrested or mortality can occur both when soil moisture is limited (below PWP) and excessive (in saturated conditions). | ||
| + | |||
| + | {{:Soil water storage properties}} | ||
Revision as of 21:45, 12 January 2023
In development
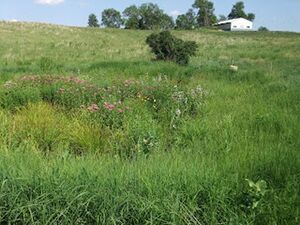
Conducting a site assessment and inventory of existing conditions related to vegetation on a proposed best management practice (BMP) site or development site where stormwater bmps will be implemented is an essential step in a successful stormwater management project. The process and results of conducting an assessment and inventory impact the design and function of the stormwater project. Taking the time to complete a review of existing conditions early in a project can also identify challenges or obstacles that can increase the success and decrease the risk of the project.
There two areas of consideration when conducting a site assessment specifically for vegetation.
- Conducting an assessment of existing vegetation
- Assessing soil health and function (effect of vegetation on soil health)
Contents
Conducting assessment of existing vegetation
Assessing existing vegetation provides clues to understanding vegetation growth patterns, keys to underlying hydraulic conditions, insight into historic vegetation cover, and many more useful tools in the development of BMP design. Assessments can be completed after an inventory of existing vegetation has taken place. Often inventory and analysis provides helpful information that influences decisions and increases the likelihood of a successful project.
Completing an assessment of existing vegetation depends upon the size and conditions of the site you are assessing. To aid in the design of a vegetated stormwater feature, you will want to understand the following basic information about your site.
- What vegetation was historically found on site?
- What vegetation is currently found on the site?
These two questions will guide you in future decision-making processes and help reduce risk and increase the likelihood of long-term success.
What vegetation was historically found on site?
In the process of designing a BMP, depending upon the size, condition, and location, it is often helpful to have a reference, or index, plant community to guide plant selection using a vegetative baseline. Reference plant communities, either on-site or from nearby sites, provides a baseline indication of what vegetation or seed could be suitable for use. These baseline indices provide insight into site conditions that could impact the BMP function or design.
Below are several tools that designers can use in the inventory and analysis stages of a project to help determine reference points for determining what vegetation might have occurred naturally on a given project site. Each is discussed briefly below.
- Marschner Map of Original Vegetation
- Minnesota Historical Aerial Photographs Online (MHAPO)
- Mississippi River Commission Maps
- Other Historic Vegetation Resources
Marschner Map of Original Vegetation
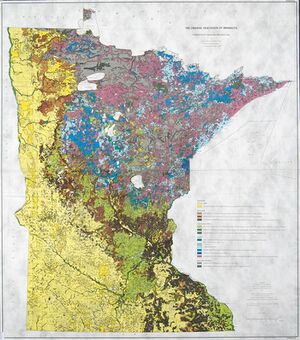
To restore a native vegetated state or plant community, it is helpful to start with a reference point or vegetation baseline that can be used as a guide in a restoration process. The presence of native vegetation on your site provides both a reference plant community as well as an indication of higher functioning biological and ecological systems. A common vegetative reference point for high-functioning ecosystems in the continental United States is that time prior to European settlement. The Marschner Map of Original Vegetation was developed from notes on pre-settlement vegetation in a Minnesota land survey completed between 1846 and 1848. These maps depict ecological communities encountered by surveyors and can be a useful tool in creating a reference vegetation community for a BMP.
To review Minnesota’s Marschner Maps or to learn more about them visit Minnesota Land Use and Cover: Historic.
Historic Aerial Photography
Another resource to help determine historic vegetation is online aerial images. Even if specific vegetative species cannot be determined from an aerial photo, it may be helpful to understand what type of plant communities were present before current day conditions. Historic imagery can give you context clues, such as whether the project site was historically a woodland, prairie, or oak savanna. Aerial imagery can also hint at hydraulic conditions, as wetlands are often easily identifiable. Below are links to historical aerial imagery.
- MHAPO (Minnesota Historical Aerial Photographs Online)
- Historical Airphoto Information, Minnesota DNR
Mississippi River Commission Maps
The Mississippi River Commission Maps show the channel of the Mississippi River and adjacent area, including 10-foot contours and river cross-sectional depth increments, as derived from a special survey completed by the US Army Corps of Engineers in the late 1800’s. These historic hand-drawn maps offer both the channel and floodplain characteristics as well as vegetative cover, land ownership, and built features such as road, railroads, and buildings. Depending upon the location of the proposed BMPs, these maps can be useful tools to see how landscape has changed over time, what land uses may have occurred on the site during that period, and where remnant vegetation may be present from that time period.
Other Historic Vegetation Resources
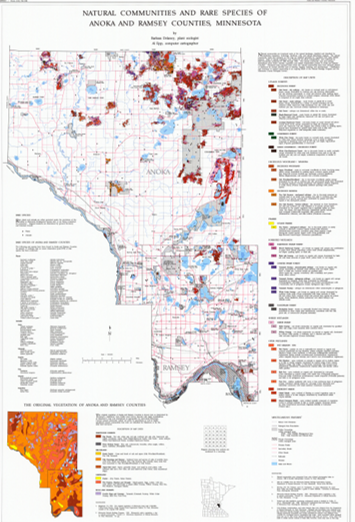
The Minnesota County Biological Survey (MCBS) Native Plant Communities and Rare Species dataset provides mapped areas of natural vegetation and general locations of existing rare and endangered species. Maps are available by county, and completed for most of the state in PDF and GIS shapefile formats. These provide a spatial resource for assessing what high-quality natural areas may be present on your site as well what adjacent areas may help inform your restoration goals.
PLS Bearing Trees: The original Public Land Survey (PLS) for Minnesota was roughly completed between 1847 and 1908, organizing the land for sale and use. During this survey, the bearing trees were blazed and marked to be able to locate the survey corners if the wood or stone corners were lost or moved. These tree species were only captured at the corners of sections and quarter-sections, so broad translation of these as indicators of pre-settlement ecological communities should be performed with caution. Alternately, these can be used in combination with other vegetative maps such as the MCBS Native Plant Communities or Marschner Map to understand what types of trees were present and may be suitable for use.
What vegetation is currently on site?
Vegetation existing on a project site can play a significant role in the design and function of a BMP. High quality vegetation, specific vegetation communities, and key individual species may have local or national protections and potentially shift the location or design of the project. In the same manner, invasive species found within a project site may impact the function or vegetation design within a site. Additional management or restoration measures may need to be taken to increase the likely hood of vegetation establishment and success. Vegetation on site can be broken into three categories in the site assessment process:
- Native Vegetation
- Key Plant Species
- Undesirable Plants
Native Vegetation
Native Plant Communities
The Minnesota DNR defines native plant communities as, “a group of plants that interact with each other and with their environment in ways not greatly altered by modern human activity or by introduced organisms ... classified and described by considering vegetation, hydrology, landforms, soils, and natural disturbance regimes.” (MnDNR). These groups of plants form recognizable communities classified by characteristic plant species or characteristic environmental features. These plant communities developed in response to natural environmental conditions, so are often best adapted to the environmental and hydrologic conditions in site-specific BMPs.
Understanding and classifying the vegetation on your site can be a useful tool in the design of your BMP. It provides you with a list of common plant species found within a given plant community to serve as a reference in BMP vegetation selection.
To learn more about native plant communities review the DNRs classifications below.
- Minnesota's Native Plant Communities, Minnesota DNR
- Native Plant Community Classification, Minnesota DNR
Wetlands
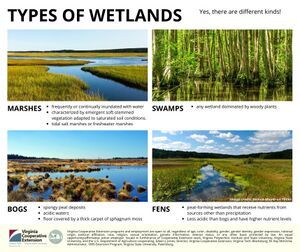
Minnesota supports a variety of wetland types, each with greatly varying characteristics. Wetland types include shallow open water, bogs, shrub swamplands, wet meadows, floodplain forests, and many more. Wetland types and wetland delineation can vary depending on the regulatory jurisdiction. However, generally speaking wetlands are identified by soils that develop in wet conditions, the presence of water (hydrology), and the presence of water loving vegetation.
Wetlands are an important part of our ecosystem and provide a variety of benefits:
- Water Quality: Wetlands filter and absorb pollutants from surface runoff thereby protecting the water quality of downstream lakes, streams, and rivers.
- Flood Control: Wetlands slow down and retain runoff from precipitation events. Wetlands serve as holding areas and can reduce flooding and soil erosion downstream.
- Groundwater Recharge/Discharge: Some wetlands recharge groundwater by allowing surface water slowly filter into groundwater storage reserves. Other wetlands discharge groundwater to the surface and can help maintain flows in nearby rivers and streams.
- Provide Habitat: Wetland vegetation provides habitat and forage for many insects and animals
- Education, Recreation, and Commercial Benefits: Some wetlands offer opportunities for education, recreation, and can even support the production of commercial products.
Regulation is in place to protect and prevent the loss of existing wetlands so that they can continue to be a public value. Wetlands are protected by federal, state, and local regulations. Because of this regulation, it is important to have a trained wetland delineator review your site thoroughly to determine if a wetland exists on your site as early in the design process as possible.
Additional information regarding the wetland delineation process, permitting, and regulatory requirements can be found here at the following websites.
- Wetlands, Minnesota DNR
- DNR Regulations
- Delineation & Jurisdictional Determination Guidance
- NWI Wetland Finder: Minnesota Department of Natural Resources
Key Species
Tree Survey
Tree surveys provide information on what mature trees are on the site. Mature trees are often required to be mitigated as part of site development. Check your local codes for the required information to be included in a tree survey. Typical information includes the tree’s trunk diameter (DBH), species, health, location, and any comments on condition or quality based on field observations. If repeat surveys are to be completed, a permanent metal tag with unique ID is often affixed to the tree to provide consistent numbering and identification. A tree survey should be completed by an arborist, ecologist, landscape architect, land surveyor, or other qualified person able to key the tree to the species level in the field.
Heritage Trees
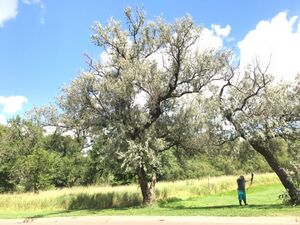
Heritage trees are very large, unique, or old trees that have cultural or ecological value. Trees may be considered for heritage status based on age, rarity, size, aesthetic, ecological, or historical value. Depending upon your location, governing bodies may have ordinances governing what can be permitted and built around a heritage tree.
To learn more about Minnesota’s heritage or landmark tree programs follow the links below:
- Heritage Tree Program - Minneapolis Park & Recreation Board
- Minnesota's native big tree registry | Minnesota DNR
- Landmark Tree Program | Saint Paul Minnesota
Threatened and Endangered Species
State and federal laws exist to protect endangered or threatened species throughout the state. Before beginning a design process, it is important to engage local and state natural resource managers and review the site for any potential impacts a construction project may have on threatened or endangered animals. A review of the DNR's Natural Heritage Information System (NHIS) will provide information related to rare plants, animals, and native plant communities that have been identified within a particular area.
Additional information about threatened or endangered species regulation can be found at the following online resources. Minnesota's endangered, threatened, and special concern species, Minnesota DNR
Natural Heritage Information System Desirable Plants
Plants native to Minnesota are adapted to our soil and climate and are often easier to grow than non-native species. Native plants, if placed within the correct habitat, produce a significant number of ecological benefits while reducing the amount of maintenance needed on a project. Below are links to plants you may want to keep if found within a project site.
- Plants of Minnesota, Minnesota DNR
- Native plants, UMN Extension
- A guide to aquatic plants, Minnesota DNR
Undesirable Plants
Tree Removal & Mitigation
Each jurisdiction has different regulations regarding tree protection and mitigation of removed trees during a construction project. It is important to review local ordinances to identify if tree preservation plan or mitigation requirements exist for your project area. A detailed tree preservation plan can help minimize compliance cost, protect valuable trees, and ensure your project conforms to local tree mitigation ordinances. A tree preservation and mitigation plan typically involves the following elements.
- Tree Inventory: Species identification, location, health, and size of existing trees on site. This is typically a plan figure with an associated table.
- Tree Preservation and Removal Plan: This is typically a figure showing tree protection measures (construction fence, trunk guards, etc.) for existing trees to be preserved. It should also identify trees to be removed as a result of the proposed construction or restoration. See Protection of existing trees on construction sites.
- Mitigation Plan: Tree mitigation is the act of compensating for the removal of existing healthy trees by planting a proportional number of replacement trees. Many jurisdictions have mitigation requirements based on the species and number of trees to be removed as a result of a construction project. Siting design elements and grading in ways that limits the removal of trees, especially hardwood species, can often reduce the need for replacement tree stock.
It is important to review your project location’s municipal code documents early in the design process to ensure that you are able to meet all permit requirements.
Invasive Species
In the process of completing a vegetation site assessment, it is important to understand the amount and type of invasive species pressure that may occur on or around the site. Early identification of invasive species can save you time, money, and increase the likelihood of project success. Invasive species spread rapidly, especially when a site is disturbed due to construction, and can out-compete native species and reduce quality of the BMP.
To learn more about invasive species in Minnesota visit the links below:
- Invasive terrestrial plants - Minnesota Department of Natural Resources
- State prohibited noxious weeds - Minnesota Department of Health
- Identify invasive and non-native species - University of Minnesota
- Invasive plants - Board of Water and Soil Resources
- Minnesota Invasive Species Advisory Council
- Invasive Plant Species in Minnesota – Minnesota Wildflowers
Soil heath and function (Effect of vegetation on soil health)
Planting soil quality and characteristics has a direct effect on the vegetative success within a BMP and the greater landscape ecosystem. Nutrient content, air content, texture, and other physical and chemical factors have a great ability to help or hinder plant growth and development. Review the following when considering soil suitability for your project as well as thinking about what plants would be suitable for selected soils.
Ability for soil to support vegetative growth
Planting soil or topsoil provides plants with the nutritional support for growth and development. Soil-based nutrients, specifically nitrogen, phosphorus, and potassium, and other trace elements, provide building blocks for growing plants. Understanding the soil’s capacity to support vegetative growth is a critical step in providing for the long-term needs of plants.
For detailed discussions of soil topics, including soil characteristics, sampling, and testing, see Information on soil.
Nutrients
Plants require 18 soil-available nutrients for successful growth and development. These nutrients are categorized as either macronutrients or micronutrients. Macronutrients are those used by plants in large quantity and include carbon (C), hydrogen (H), oxygen (O), nitrogen (N), phosphorus (P), potassium (K), calcium (Ca), magnesium (Mg), and sulfur (S). Micronutrients are required by plants in lesser quantity and include boron (B), copper (Cu), iron (Fe), manganese (Mn), zinc (Zn), molybdenum (Mo), chlorine (Cl), cobalt (Co), and nickel (Ni).
The presence of three key nutrients, nitrogen (N), phosphorus (P), and potassium (K), make up the fundamental building blocks of soil nutrients necessary for vegetative growth, development, and overall health. As such, these are the three elements most often supplied by fertilizer, where the “N-P-K Ratio” or “NPK Ratio” is the percentage, by volume, of each of these elements. This link provides a summary of each micronutrient and macronutrient, the plant uptake form or compound, identification of nutrient deficiencies in plants, and soil mobility of each nutrient.
pH
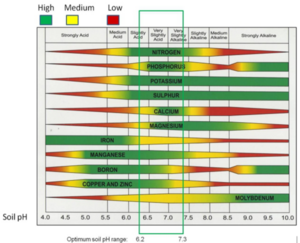
pH is the measure of acidity or basicity in soil. Soils generally should be close to neutral (pH = 7.0) for the largest number of plant species requirements, although some are better suited for more acid or basic environments. A soil testing laboratory can provide you with a soil’s pH. A composite soil sample for each type of soil to be used or reused on site should be taken and tested for pH prior to use.
Bulk density
Bulk density is an indicator of soil compaction, as measured by the weight of the dry soil divided by the total soil volume. As soil compaction increases, the total soil water holding capacity and root-available moisture decreases. Compacted soils have more dry weight than uncompacted soils, thus having a higher soil bulk density. High bulk density soils are generally unable to support vegetative growth as they restrict root growth due to inhibited gas and water exchange between the soil rooting space and the atmosphere. See the General relationship of soil bulk density to root growth based on soil texture table for soil bulk density thresholds for optimal soil root development.
General relationship of soil bulk density to root growth based on soil texture
Link to this table
| Soil texture | Ideal bulk densities (g/cm3) | Bulk densities that may affect plantgrowth (g/cm3) | Bulk densities that restrict root growth (g/cm3) |
|---|---|---|---|
| sands, loamy sands | <1.60 | 1.69 | >1.80 |
| sandy loams, loams | <1.40 | 1.63 | >1.80 |
| sandy clay loams, loams, clay loams | <1.40 | 1.60 | >1.75 |
| silts, silt loams | <1.30 | 1.60 | >1.75 |
| silt loams, silty clay loams | <1.40 | 1.55 | >1.65 |
| sandy clays, silty clays, clay loams with 35-45% clay | <1.10 | 1.49 | >1.58 |
| clays (>45% clay) | <1.10 | 1.39 | >1.47 |
Microbial function in rhizosphere (fungi, algae, bacteria, protozoa)
Organic soils are living environments for a variety of microbes and microorganisms. Soil microbes include fungi, algae, bacteria, viruses, and protozoa, all providing differing functions but all contributing to positive or negative soil health. Some beneficial functions associated with soil microorganism include nitrogen-fixing, residue and plant material decomposition, nutrient cycling for plant availability, and phosphorus solubilization. These processes enhance the quality, quantity, and gas exchange of soil organic layer.
Soil testing (existing topsoil vs borrow)
All topsoil for use in your project should be tested prior to installation to determine its value and acceptability as a growth media. The following laboratories are a few that provide soil testing to assist you in obtaining the information you need to determine the quality of your soil. Refer to each lab’s website to see which tests are offered, as not all provide comprehensive soil testing for every soil quality listed hereafter.
- University of Minnesota Soil Testing Laboratory
- Crop Services International
- International Ag Labs
- Soil Food Web Certified Lab-Techs international listing, see map here
You may test either salvaged topsoil from your site or a prepared mix from a soil supplier. It is important to verify that salvaged topsoil is acceptable for reuse with content and quality within acceptable thresholds. For stockpiled soils, soil samples should be taken at varying depths from stockpile’s surface to base of stockpile to ensure uniform quality of the sourced soil.
Soil health indicators as they may relate to vegetation establishment and long-term planting success
![image of soil texture triangle]](/images/thumb/7/79/Soil_texture_triangle.jpg/300px-Soil_texture_triangle.jpg)
The indicators of soil health can vary greatly across different topsoil types, parent materials, and environmental conditions. It is important to consider the soil’s capacity for what you are intending to plant when you are evaluating your topsoil. Testing your soil for the following indicators will provide you with a good foundation to evaluate your soil’s ability to grow and sustain vegetation. Additional soil health indicators not listed below should be considered if they will assist in evaluating more specialized soil conditions.
Soil texture/composition/structure
There are 12 major soil texture classifications as defined by the United States Department of Agriculture. Soil texture classifications are based on the relative content, by volume, of three classes of soil particle grain sizes – sands, silts, and clays. Plant-available soil moisture is held and retained in the pore space between the individual soil particles so it is important to understand the soil water characteristics provided by the soil structure. An assessment of grain size and soil texture should be performed with a sieve analysis to assess for soil structure. A separate analysis of organic material should accompany the test for the soil texture as this is not included in the sieve analysis.
One additional way soil structure can be classified is in terms of larger soil particle aggregations. These larger aggregations of soil particles are termed “peds”. These larger peds form the soil structural unit. Retaining ped structure in the soil can assist in preserving soil biology, atmospheric gas exchange, drainage characteristics of the native soil, as well as reducing compaction relative to soils with a uniform soil texture. This page provides a summary of soil texture and structure as part of a larger discussion of soil physical properties and processes.
In general, loams or silt loams are preferred soil textures for general planting applications, whereas sandy loams and loamy sands are preferred for stormwater management vegetation growth media.
For more information, see Soil classification
Moisture content water holding capacity
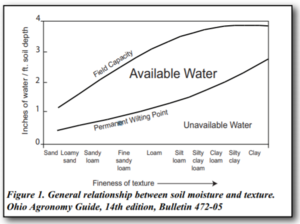
Soil moisture content is critical to supporting vegetation, specifically that moisture which is root-available for use in plant growth and development. The available water holding capacity (AWC) in the soil root zone is the volumetric difference between field capacity (FC) and the permanent wilting point (PWP). This page provides a summary of the soil hydrologic properties and processes, including soil moisture content terms used hereafter.
Soil moisture AWC’s vary by soil type.
In general and in terms of supporting most plants, optimal growth and development occurs when soil moisture content is between approximately 40-50% of AWC and FC. Wilting begins to occur at <40% AWC when the roots’ moisture extraction from the soil pores is inhibited as water potential increases in the roots relative to the surrounding soil. However, it is important to understand that vegetation growth and development can be arrested or mortality can occur both when soil moisture is limited (below PWP) and excessive (in saturated conditions).
Recommended values for porosity, field capacity and wilting point for different soils.1
Link to this table.
| Soil | Hydrologic soil group | Porosity 2 (volume/volume) | Field capacity (volume/volume) | Wilting point (volume/volume) | Porosity minus field capacity (volume/volume)3 | Field capacity minus wilting point (volume/volume)4 |
|---|---|---|---|---|---|---|
| Sand | A (GM, SW, or SP) | 0.43 | 0.17 | 0.025 to 0.09 | 0.26 | 0.11 |
| Loamy sand | A (GM, SW, or SP) | 0.44 | 0.09 | 0.04 | 0.35 | 0.05 |
| Sandy loam | A (GM, SW, or SP) | 0.45 | 0.14 | 0.05 | 0.31 | 0.09 |
| Loam | B (ML or OL) | 0.47 | 0.25 to 0.32 | 0.09 to 0.15 | 0.19 | 0.16 |
| Silt loam | B (ML or OL) | 0.50 | 0.28 | 0.11 | 0.22 | 0.17 |
| Sandy clay loam | C | 0.4 | 0.07 | |||
| Clay loam | D | 0.46 | 0.32 | 0.15 | 0.14 | 0.17 |
| Silty clay loam | D | 0.47 to 0.51 | 0.30 to 0.37 | 0.17 to 0.22 | 0.16 | 0.14 |
| Sandy clay | D | 0.43 | 0.11 | |||
| Silty clay | D | 0.47 | 0.05 | |||
| Clay | D | 0.47 | 0.32 | 0.20 | 0.15 | 0.12 |
1Sources of information include Saxton and Rawls (2006), Cornell University, USDA-NIFA, Minnesota Stormwater Manual. (See References for trees)
2Soil saturation is assumed to be equal to the porosity.
3This value may be used to represent the volume of water that will drain from a bioretention media.
4This value may be used to estimate the amount of water available for evapotranspiration
