Difference between revisions of "Quick Guide: MPCA Estimator tab"
| (4 intermediate revisions by the same user not shown) | |||
| Line 84: | Line 84: | ||
In the adjacent image showing adjusted loads, street sweeping in a residential area led to a lower emc and impervious disconnection in a commercial area led to a lower runoff coefficient. Both actions led to pollutant reductions. | In the adjacent image showing adjusted loads, street sweeping in a residential area led to a lower emc and impervious disconnection in a commercial area led to a lower runoff coefficient. Both actions led to pollutant reductions. | ||
| − | STEP 9. Calculate pollutant reductions associated with structural BMPs. Enter the acres treated by a particular type of BMP. The area treated by a BMP cannot exceed the total acreage within a specific land use. Cumulative acreage for multiple BMPs can exceed the total acreage within a land use and this condition triggers a message stating the treated acres exceed the total acres for the land use. In the adjacent image showing acreages for structural BMPs, biofiltration, | + | STEP 9. Calculate pollutant reductions associated with structural BMPs. Enter the acres treated by a particular type of BMP. The area treated by a BMP cannot exceed the total acreage within a specific land use. Cumulative acreage for multiple BMPs can exceed the total acreage within a land use and this condition triggers a message stating the treated acres exceed the total acres for the land use. In the adjacent image showing acreages for structural BMPs, <span title="a bioretention practice having an underdrain. All water entering the practice is filtered through engineered media and filtered water is returned to the storm sewer system."> [https://stormwater.pca.state.mn.us/index.php?title=Bioretention '''biofiltration''']</span>, <span title="are configured as shallow, linear channels. They typically have vegetative cover such as turf or native perennial grasses"> [https://stormwater.pca.state.mn.us/index.php?title=Dry_swale_(Grass_swale) '''swale''']</span>, and wet basins (<span title="a stormwater retention basin that includes a combination of permanent pool storage and extended detention storage above the permanent pool to provide additional water quality or rate control"> [https://stormwater.pca.state.mn.us/index.php?title=Stormwater_ponds '''wet pond''']</span>) are structural BMPs that reduce pollutant loads. |
==View the results== | ==View the results== | ||
| − | STEP 10. Click on the Summary sheet worksheet to see results for the entire area of interest. Information on this sheet includes initial load (pounds), load reductions in pounds and in percent decrease from the initial load, final pollutant export (lb/ac/yr), and pollutant reductions for each type of structural BMP. | + | STEP 10. Click on the Summary sheet worksheet to see results for the entire area of interest. Information on this sheet includes initial load (pounds), load reductions in pounds and in percent decrease from the initial load, final pollutant <span title="An amount of pollutant, usually expressed in mass per unit area per unit time, transported off-site, most often with stormwater runoff"> '''export'''</span> (lb/ac/yr), and pollutant reductions for each type of structural BMP. |
==Entering information into the TMDL Annual Reporting form== | ==Entering information into the TMDL Annual Reporting form== | ||
| − | If the results are being used for TMDL compliance, | + | If the results are being used for TMDL compliance, input the calculated reductions (choose pounds reduced or percent load reduced) to Category 1 in the Cumulative Reductions tab of the Annual Report form for that reporting year and TMDL. See the adjacent image for an example. |
[[File:QGestimator3.png|thumb|left|alt=estimator|Step 8]] | [[File:QGestimator3.png|thumb|left|alt=estimator|Step 8]] | ||
| + | |||
| + | [[Category:Level 3 - Models and modeling/Specific models/MPCA Simple Estimator]] | ||
Latest revision as of 17:52, 8 December 2022
The MPCA Simple estimator is an Excel-based tool that utilizes the Simple Method to estimate total suspended solid and/or total phosphorus loads and load reductions associated with implementation of best management practices (BMPs). The spreadsheet includes the following features.
|
This page provides a quick guide to using Version 3.0 of the Minnesota Pollution Control Agency (MPCA) Simple Estimator. For detailed guidance, Link to full guidance on the Estimator.
The Estimator worksheet presents an easy-to-use calculator to compute the pollutant load reduction for total phosphorus (TP) and total suspended solids (TSS). Results from the estimator can be used in the Cumulative reductions tab of the total maximum daily load (TMDL) Annual Report form.
Useful links
- Download updated MPCA Estimator here: File:MPCA simple estimator version 3.0.xlsx
- Link to full guidance on the TMDL Form
- Link to full guidance on the Estimator
- Recommendations and guidance for utilizing the MPCA Simple Estimator to meet TMDL permit requirements
- Case study for using the MPCA Simple Estimator to meet TMDL permit requirements
Contents
Open the Estimator and read the Information worksheet
The information worksheet provides some basic information about the Estimator and includes links that may be useful.
Gather BMP information
STEP 1: Define the boundaries of your area.
STEP 2: Identify structural and non-structural best management practices (BMPs) and identify other activities that affect pollutant loading (e.g. changes in land use).
STEP 3: Determine the number of worksheets you will need. We recommend using a separate worksheet for the following.
- Each subwatershed in the area of interest
- Different contributing drainage areas to BMPs in a treatment train
- Areas that have uniques features compared to other areas within the area of interest
Link here for more information
Input data to Estimator
The following steps apply to each worksheet being used.
STEP 4. Enter site information at the top of the worksheet. If entering a TMDL name, select from the dropdown menu.
STEP 5. Calculate and enter the acreage for each applicable land use within the TMDL watershed (Column D, rows 8 through 23). Note a default acreage of 0.000001 is entered for each land use, since an acreage of 0 leads to calculation errors.
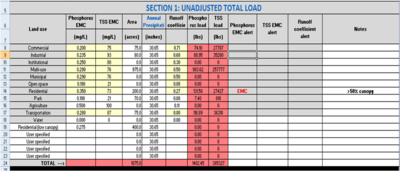
In the adjacent image showing unadjusted loads, acreages have been entered for the following land uses.
- Residential with <25% tree canopy coverage
- Residential with >50% tree canopy coverage
- Industrial
- Commercial
- Park
- Transportation
- Mixed (multi-use)
Note that two residential areas have been identified based on tree canopy coverage.
STEP 6. Determine the Annual Rainfall (Column E, rows 8 through 23). The default is 30.65 inches (Minneapolis-St. Paul International airport).
STEP 7. Determine if the default event mean concentration (EMC; columns B and C, rows 8 through 23) and runoff coefficient (column F, rows 8 through 23) are appropriate for your situation
Note the emc was adjusted for one of these residential areas, which triggered a message that the emc had been changed.
Once acreages are entered for land uses, a total load is auto-calculated for the pollutant of concern. The resulting loads for this subwatershed are 1402.45 pounds of phosphorus and 385327 pounds of TSS.
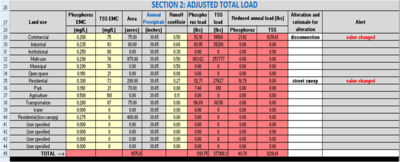
STEP 8. Calculate adjusted pollutant loads. In this section of a calculation worksheet, the user can adjust loads through the following.
- Adjust an emc. Non-structural practices such as street sweeping will decrease the emc, while other practices, such as land use changes, may increase loading by increasing the emc.
- Adjust the runoff coefficient. Disconnecting impervious surfaces will decrease the runoff coefficient (decrease pollutant loading), while increasing impervious surfaces will increase the runoff coefficient (increased pollutant loading).
In the adjacent image showing adjusted loads, street sweeping in a residential area led to a lower emc and impervious disconnection in a commercial area led to a lower runoff coefficient. Both actions led to pollutant reductions.
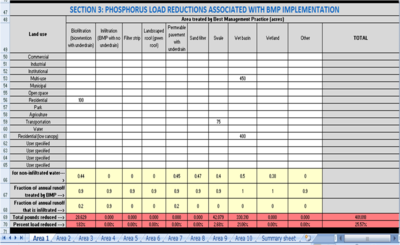
STEP 9. Calculate pollutant reductions associated with structural BMPs. Enter the acres treated by a particular type of BMP. The area treated by a BMP cannot exceed the total acreage within a specific land use. Cumulative acreage for multiple BMPs can exceed the total acreage within a land use and this condition triggers a message stating the treated acres exceed the total acres for the land use. In the adjacent image showing acreages for structural BMPs, biofiltration, swale, and wet basins ( wet pond) are structural BMPs that reduce pollutant loads.
View the results
STEP 10. Click on the Summary sheet worksheet to see results for the entire area of interest. Information on this sheet includes initial load (pounds), load reductions in pounds and in percent decrease from the initial load, final pollutant export (lb/ac/yr), and pollutant reductions for each type of structural BMP.
Entering information into the TMDL Annual Reporting form
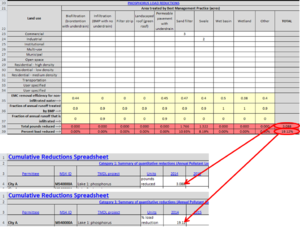
If the results are being used for TMDL compliance, input the calculated reductions (choose pounds reduced or percent load reduced) to Category 1 in the Cumulative Reductions tab of the Annual Report form for that reporting year and TMDL. See the adjacent image for an example.
This page was last edited on 8 December 2022, at 17:52.


