Difference between revisions of "Overview of basic stormwater concepts"
m (→Geology) |
m |
||
| Line 215: | Line 215: | ||
====Shallow bedrock==== | ====Shallow bedrock==== | ||
| − | In many portions of the state, bedrock occurs at or near the surface. The “red rocks” of the southwest, igneous intrusions along the St. Croix River and North Shore, and scattered sedimentary outcrops all around the state present some challenges in stormwater management because of their proximity to the surface. Among those difficulties are a lack of soil depth for use of infiltration techniques, structural impairment to best management practice (BMP) installation and steep slopes. The stormwater management implications of shallow bedrock affect infiltration, ponding depths, and the use of underground practices. Details can be obtained from the Minnesota Geological Survey (MGS) or a reliable local source, such as the county or a local well driller. | + | In many portions of the state, bedrock occurs at or near the surface. The “red rocks” of the southwest, igneous intrusions along the St. Croix River and North Shore, and scattered sedimentary outcrops all around the state present some challenges in stormwater management because of their proximity to the surface. Among those difficulties are a lack of soil depth for use of infiltration techniques, structural impairment to best management practice (BMP) installation and steep slopes. The stormwater management implications of shallow bedrock affect infiltration, ponding depths, and the use of underground practices. Details can be obtained from the Minnesota Geological Survey (MGS) or a reliable local source, such as the county or a local well driller. |
[[File:Minnesota bedrock outcrops.jpg|thumb|300|map showing the location of bedrock outcrops in Minnesota|Map showing the location of bedrock outcrops in Minnesota]] | [[File:Minnesota bedrock outcrops.jpg|thumb|300|map showing the location of bedrock outcrops in Minnesota|Map showing the location of bedrock outcrops in Minnesota]] | ||
| Line 229: | Line 229: | ||
====Soils==== | ====Soils==== | ||
| − | One of the first steps in the selection of BMPs is an assessment of the type of soils present on a site and the inherent ability of those soils to soak-up water. Soils are extremely variable throughout the state, but fortunately good information on local soil conditions is usually available. Details on surficial soils (generally to a depth of about six feet) are contained in county soil surveys, which are available from the U.S. Department of Agriculture’s Natural Resource Conservation Service (NRCS). Soil surveys for much of the state have been digitized to make electronic use practical | + | One of the first steps in the selection of BMPs is an assessment of the type of soils present on a site and the inherent ability of those soils to soak-up water. Soils are extremely variable throughout the state, but fortunately good information on local soil conditions is usually available. Details on surficial soils (generally to a depth of about six feet) are contained in county soil surveys, which are available from the U.S. Department of Agriculture’s Natural Resource Conservation Service (NRCS). Soil surveys for much of the state have been digitized to make electronic use practical. Note, however, that these surveys are not accurate enough to determine site specific characteristics suitable for many BMP applications, so a detailed site analysis is recommended. The primary reason for this is that soils can vary substantially with depth, and the county soil surveys depict only surficial mapped units. |
====Limited infiltration capacity==== | ====Limited infiltration capacity==== | ||
| − | Soils with low infiltration capacity are found throughout the state. On a local scale the absence of good soils that can absorb runoff (i.e., infiltrate) can be a major detriment to good stormwater management. Stormwater management limitations in areas with “tight” soils generally preclude large-scale infiltration and ground water recharge (infiltration that passes into the ground water system). These soils will typically be categorized under Hydrologic Soil Group (HSG) D and have other characteristics | + | Soils with low infiltration capacity are found throughout the state. On a local scale the absence of good soils that can absorb runoff (i.e., infiltrate) can be a major detriment to good stormwater management. Stormwater management limitations in areas with “tight” soils generally preclude large-scale infiltration and ground water recharge (infiltration that passes into the ground water system). These soils will typically be categorized under Hydrologic Soil Group (HSG) D and have other characteristics. The infiltration rates noted in this table are conservative estimates of long-term, sustainable infiltration rates that have been documented in Minnesota. They are based on in-situ measurement within existing infiltration practices in Minnesota, rather than national numbers or rates based on laboratory columns. |
| − | <p>Use of HSG C or D soils for BMPs that rely on infiltration is generally not recommended unless a pre-development condition is trying to be simulated. That is, these soils can certainly be used in a system that relies only on a small amount of infiltration similar to the small amount that inherently exists on site. If a manager wants to match pre-development volume for all soils, it is apparent that D soils will continue to yield low infiltration | + | <p>Use of HSG C or D soils for BMPs that rely on infiltration is generally not recommended unless a pre-development condition is trying to be simulated. That is, these soils can certainly be used in a system that relies only on a small amount of infiltration similar to the small amount that inherently exists on site. If a manager wants to match pre-development volume for all soils, it is apparent that D soils will continue to yield low infiltration.</p> |
====Rapidly infiltrating soils==== | ====Rapidly infiltrating soils==== | ||
| − | On the opposite side of the infiltration spectrum are those soils that rapidly infiltrate water from the surface. Soils with large percentages of sand and separate from the water table transmit water very quickly and might work extremely well for infiltration practices provided precautions are taken to protect the ground water from the introduction of polluting materials. The level of treatment in sandy soils is quite variable. Although the sands can act similar to a sand filter for particulate material, soluble pollutants generally move through the soil quite rapidly and unattenuated. | + | On the opposite side of the infiltration spectrum are those soils that rapidly infiltrate water from the surface. Soils with large percentages of sand and separate from the water table transmit water very quickly and might work extremely well for infiltration practices provided precautions are taken to protect the ground water from the introduction of polluting materials. The level of treatment in sandy soils is quite variable. Although the sands can act similar to a sand filter for particulate material, soluble pollutants generally move through the soil quite rapidly and unattenuated. An example of a large-scale sandy soil condition is the Anoka Sand Plain. Similar large expanses of sandy soils exist elsewhere in Minnesota and should be recognized when planning a BMP strategy. |
====Topography==== | ====Topography==== | ||
| − | The elevation and topographical changes evident in Minnesota also present variable challenges to local stormwater managers. For example, the steep slopes along the North Shore and along many major river banks requires a far different approach than those practices where a deep soil cover exists on a flat plain or slowly rolling hills. | + | The elevation and topographical changes evident in Minnesota also present variable challenges to local stormwater managers. For example, the steep slopes along the North Shore and along many major river banks requires a far different approach than those practices where a deep soil cover exists on a flat plain or slowly rolling hills. Local attention is required when information on slope, topography and physiographic character is part of the stormwater management deliberation. |
===Cultural features=== | ===Cultural features=== | ||
| − | Most of the cultural variation in the state relates to | + | Most of the cultural variation in the state relates to differences in land use that have resulted as the state developed over the past 100+ years. Although the major focus of this Manual is on urbanized land uses, many urbanizing type activities, such as road building, transcend a single land use and apply throughout the state. Also in many cases urbanization occurs on land that was previously altered by agricultural, silvicultural, or pre-development activity. |
==How this manual will help== | ==How this manual will help== | ||
The citizens of Minnesota long ago realized the potential for worsening water quality as the state grew. The solution they discovered was not to stop growth, but rather to plan for how it happens and to institute protective actions to prevent many of the negative impacts. It is virtually impossible to prevent all negative impacts, but there is a realistic expectation that efforts to minimize the impact should occur. This is the basis for the stormwater regulatory program in place in the state. | The citizens of Minnesota long ago realized the potential for worsening water quality as the state grew. The solution they discovered was not to stop growth, but rather to plan for how it happens and to institute protective actions to prevent many of the negative impacts. It is virtually impossible to prevent all negative impacts, but there is a realistic expectation that efforts to minimize the impact should occur. This is the basis for the stormwater regulatory program in place in the state. | ||
<p>There are also many new and ever-evolving ways to manage the runoff and eliminate some of the pollution associated with it. These best management practices are proven effective measures that are readily available in both structural and non-structural ways. There are no “best” solutions that apply universally to all situations across the state. There are best solutions that can be chosen for specific applications to solve specific problems, hence the name best management practice.</p> | <p>There are also many new and ever-evolving ways to manage the runoff and eliminate some of the pollution associated with it. These best management practices are proven effective measures that are readily available in both structural and non-structural ways. There are no “best” solutions that apply universally to all situations across the state. There are best solutions that can be chosen for specific applications to solve specific problems, hence the name best management practice.</p> | ||
| − | <p>The Minnesota Stormwater Manual provides insight for Minnesota stormwater managers on the nature of the stormwater problem in the state, as well as guidance on how to manage it using many available tools. We | + | <p>The Minnesota Stormwater Manual provides insight for Minnesota stormwater managers on the nature of the stormwater problem in the state, as well as guidance on how to manage it using many available tools. We can protect our valuable receiving waters through a reasonable set of practices applied equitably across the state. This is a major objective of this Manual.</p> |
==References== | ==References== | ||
*Alexander, E.C. Jr. and Y. Gao, 2002. Copyrighted map of Minnesota Karst Lands. | *Alexander, E.C. Jr. and Y. Gao, 2002. Copyrighted map of Minnesota Karst Lands. | ||
*Conservation Toronto and Region, 2001. [http://www.ene.gov.on.ca/envision/water/stormwaterpph.htm The Storm Water Pollution Prevention Handbook]. Copublished with the Ontario Ministry of the Environment. | *Conservation Toronto and Region, 2001. [http://www.ene.gov.on.ca/envision/water/stormwaterpph.htm The Storm Water Pollution Prevention Handbook]. Copublished with the Ontario Ministry of the Environment. | ||
| − | * | + | *[http://www.georgiastormwater.com Stormwater Management Manual Georgia (State of)], 2001. |
*Granger, R.J., D.M. Gray, and G.E. Dick, 1984. Snowmelt Infiltration to Frozen Soils. Canadian Journal of Earth Science, 21:669-677. | *Granger, R.J., D.M. Gray, and G.E. Dick, 1984. Snowmelt Infiltration to Frozen Soils. Canadian Journal of Earth Science, 21:669-677. | ||
*Great Lakes Association. Percent Bedrock Outcrop of Landtype Associations of Northern Minnesota Map. | *Great Lakes Association. Percent Bedrock Outcrop of Landtype Associations of Northern Minnesota Map. | ||
*Minnesota State Climatology Office and Minnesota Department of Natural Resources. 2003. Normal Annual Precipitation. | *Minnesota State Climatology Office and Minnesota Department of Natural Resources. 2003. Normal Annual Precipitation. | ||
| − | *Natural Resource Conservation Service. 2005. Status of Soil Survey Digitizing (SSURGO) Minnesota. | + | *[http://www.nrcs.usda.gov/wps/portal/nrcs/site/national/home/ Natural Resource Conservation Service]. 2005. Status of Soil Survey Digitizing (SSURGO) Minnesota. |
*Schueler, T.R., 1987. Controlling Urban Runoff: A Practical Manual for Planning and Designing Urban Best Management Practices. Metropolitan Washington Council of Governments, Washington, D.C. | *Schueler, T.R., 1987. Controlling Urban Runoff: A Practical Manual for Planning and Designing Urban Best Management Practices. Metropolitan Washington Council of Governments, Washington, D.C. | ||
| − | *U.S. Weather Bureau (D.M. Hershfield), 1961. Rainfall Frequency Atlas of the United States for Durations from 30 Minutes to 24 Hours and Return Periods from 1 to 100 Years. USWB Technical Publication 40 (TP 40). | + | *[http://www.erh.noaa.gov/er/hq/Tp40s.htm U.S. Weather Bureau] (D.M. Hershfield), 1961. Rainfall Frequency Atlas of the United States for Durations from 30 Minutes to 24 Hours and Return Periods from 1 to 100 Years. USWB Technical Publication 40 (TP 40). |
Revision as of 20:10, 26 December 2012
This page defines the reasons stormwater management is important in the state and introduces the general stormwater management principles that are used throughout the Manual website. The unique framework and stormwater management approach needed in Minnesota to address the variation in physical conditions that might affect surface water management are discussed.
Contents
Stormwater education
The material contained in the Minnesota Stormwater Manual, and especially the background material presented on this page, can be used to educate public officials and citizens on the necessity to plan adequately for stormwater. Although the average Minnesotan is very water-savvy, there is a continual need to keep our youth and those desiring to learn better served.
Minnesota is fortunate to have many educational programs available to its citizens. Such efforts as the University of Minnesota Extension, Project NEMO, [Watershed Partners], and all of the Phase II education programs developed by [MS4] communities are but a few of the many available. Because this list is far too long to include in this document, the reader is referred to Minnesota Sustainable Communities Network “Next Step” to obtain a comprehensive list of education programs and contacts.
What is stormwater?
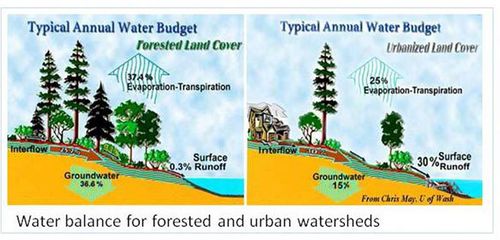
Stormwater is an all-inclusive term that refers to any of the water running off of the land’s surface after a rainfall or snowmelt event. Prior to development, stormwater is a small component of the annual water balance. However, as development increases, the paving of pervious surfaces (that is, surfaces able to soak water into the ground) with new roads, shopping centers, driveways and rooftops all adds up to mean less water soaks into the ground and more water runs off. In a forested watershed, the majority of precipitation infiltrates the soil and subsequently percolates deeper into groundwater or is evapotranspired back to the atmosphere. As urbanization occurs and the percentage of impervious surface increases, an increasing amount of precipitation runs off the landscape and eventually is discharged to receiving waters. The actual percent of water consumed by the different hydrologic processes varies depending upon location within Minnesota. although general information exists on regional precipitation, infiltration, evapotranspiration in Minnesota, local information should be obtained from an appropriate source knowledgeable about local water data.
The Center for Watershed Protection has helped document the adverse impact that increased imperviousness (that is, water not able to soak into the ground) has on the health of receiving streams. Further information is contained on its Web site. Similar impacts occur when the watersheds surrounding lakes experience an increase in impervious cover, although in both stream and lake cases this simplistic explanation is only part of the problem. Other factors such as morphology, landscape setting, inherent soils and geology, and land use history could be equally as important.
It is important to note that the Minnesota Stormwater Manual has an urban or developing/developed area focus. This is not meant to ignore or minimize the impact that agricultural or silvicultural activities can have on our receiving waters. Rather, the Manual focuses on the transition from rural and open space to urban uses, and on the management of stormwater from the increased impervious surfaces that result. Readers are referred to the Minnesota Pollution Control Agency, the Minnesota Department of Natural Resources, or the Minnesota Department of Agriculture for further information on agricultural and silvicultural activities.
Why stormwater matters
The passage of the Federal Clean Water Act (CWA) in the 1970s initiated a change in the view of pollution in the U.S. No longer was it acceptable to pollute our country’s water resources. The initial focus of implementing the provisions of the CWA was logically on point sources of pollution, or those discharges coming from the end of an industrial or municipal wastewater pipe. Progress in addressing these discharges was made rapidly, although vigilance is still required to assure continued protection.
In the 1990s the United States Environmental Protection Agency (USEPA) began to apply requirements of the CWA to stormwater runoff. Owners and operators of certain storm drainage systems are now required to comply with design, construction, and maintenance requirements set by the MPCA for the State of Minnesota. Manual users are also encouraged to check the Center for Watershed Protection for much more information on the behavior of stormwater and links to many additional sources of information.
Physical Changes to the Drainage System
The changes in the landscape that occur during the transition from rural and open space to urbanized land use have a profound effect on the movement of water off of the land. The problems associated with urbanization originate in the changes in landscape, the increased volume of runoff, and the quickened manner in which it moves. Urban development within a watershed has a number of direct impacts on downstream waters and waterways, including changes to stream flow behavior and stream geometry, degradation of aquatic habitat, and extreme water level fluctuation. The cumulative impact of these changes should be recognized as a stormwater management approach is assembled.
Changes to Stream Flow
Urban development alters the hydrology (rate and volume) of watersheds and streams by disrupting the natural water cycle (Georgia Stormwater Manual, 2001). The changes in streams draining altered watersheds are very apparent as they respond to the altered hydrology during this transition. Although similar changes can occur from intensive agricultural or silvicultural activities, the Manual focuses on the impacts of changes associated with development. Notable responses include:
- Increased Runoff Volumes: Land surface changes can dramatically increase the total volume of runoff generated in a developed watershed through compaction of soils and introduction of impervious surfaces.
- Increased Peak Runoff Discharges: Rainfall quickly runs off impervious surfaces instead of being released gradually as in more natural landscapes. Increased peak discharges for a developed watershed can be two- to five- times higher than those for an undisturbed watershed. Control programs that may address runoff rates do not fully address many of the problems associated with stormwater runoff.
- Greater Runoff Velocities: Impervious surfaces and compacted soils, as well as improvements to the drainage system such as storm drains, pipes, and ditches, increase the speed at which rainfall runs off land surfaces within a watershed.
- Shorter Times of Concentration: As runoff velocities increase, it takes less time for water to run off the land and reach a stream or other waterbody.
- Increased Frequency of Bank-full and Near Bank-full Events: Increased runoff volumes and peak flows increase the frequency and duration of smaller bank-full and near bank-full events, which are the primary channel forming events.
- Increased Flooding: Increased runoff volumes and peaks also increase the frequency, duration and severity of out-of-bank flooding.
- Lower Dry Weather Flows (Baseflow): Reduced infiltration of stormwater runoff could cause streams to have less baseflow through shallow ground water inflow during dry weather periods and reduces the amount of rainfall recharging ground water aquifers.
Changes to Stream Geomorphology
The changes in the rate and volume of runoff from developed watersheds directly affect the morphology, or physical shape and character, of urban streams, rivers, and often ravines and ephemeral (intermittent) drainageways. Some of the impacts due to urban development include (adapted from the Georgia Stormwater Manual, 2001):
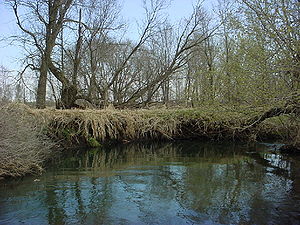
- Stream Widening and Bank Erosion: Stream channels widen to accommodate and convey the increased runoff and higher stream flows from developed areas. More frequent small and moderate runoff events undercut and scour the lower parts of the streambank, causing the steeper banks to slump and collapse during larger storms.
- Higher Flow Velocities: Increased streambank erosion rates can cause a stream to widen many times its original size due to post-development runoff.
- Stream Downcutting: Another way that streams accommodate higher flows is by downcutting their streambed. This causes instability in the stream profile, or elevation along a stream’s flow path, which increases velocity and triggers further channel erosion both upstream and downstream.
- Loss of Riparian Canopy: As streambanks are gradually undercut and slump into the channel, the vegetation (trees, shrubs, herbaceous plants) that had protected the banks are exposed at the roots. This leaves them more likely to be uprooted or eroded during major storms, further weakening bank structure.
- Changes in the Channel Bed Due to Sedimentation: Due to channel erosion and other sources upstream, sediments are deposited in the stream as sandbars and other features, covering the channel bed, or substrate, with shifting deposits of mud, silt and sand.
- Increase in the Floodplain Elevation: To accommodate the higher peak flow rate, a stream’s floodplain elevation typically increases following development in a watershed due to higher peak flows. This problem is compounded by building and filling in floodplain areas, which cause flood heights to rise even further. Property and structures that had not previously been subject to flooding may now be at risk.
Impacts to Aquatic Habitat
Perhaps the most significant impact that results from the physical change to urban streams occurs in the habitat value of streams. Impacts on habitat include (adapted from the Georgia Stormwater Manual, 2001):
- Degradation of Habitat Structure: Higher and faster flows due to development can scour channels and wash away entire biological communities. Streambank erosion and the loss of riparian vegetation reduce habitat for many fish species and other aquatic life, while sediment deposits can smother bottom-dwelling organisms and aquatic habitat.
- Loss of Pool-Riffle Structure: Streams draining undeveloped watersheds often contain pools of deeper, more slowly flowing water that alternate with “riffles” or shoals of shallower, faster flowing water. These pools and riffles provide valuable habitat for fish and aquatic insects. As a result of the increased flows and sediment loads from urban watersheds, the pools and riffles disappear and are replaced with more uniform, and often shallower, streambeds that provide less varied aquatic habitat.
- Reduced Baseflows: Reduced baseflows possibly due to increased impervious cover in a watershed and the loss of rainfall infiltration into the soil and water table adversely affect in-stream habitats, especially during periods of drought.
- Increased Stream Temperature: Runoff from warm impervious areas (e.g.. streets and parking lots), storage in impoundments, loss of riparian vegetation and shallow channels can all cause an increase in temperature in urban streams. Increased temperatures can reduce dissolved oxygen levels and disrupt the food chain. Certain aquatic species, such as trout, can only survive within a narrow temperature range.
- Decline in Abundance and Biodiversity: When there is a reduction in various habitats and habitat quality, both the number and the variety, or diversity, of organisms (e.g.. wetland plants, fish, and macroinvertebrates) are also reduced. Sensitive fish species and other life forms disappear and are replaced by those organisms that are better adapted to the poorer conditions. The diversity and composition of the benthic, or streambed, community have frequently been used to evaluate the quality of urban streams. Aquatic insects are a useful environmental indicator as they form the base of the stream food chain. Fish and other aquatic organisms are impacted not only by the habitat changes brought on by increased stormwater runoff quantity, but are often also adversely affected by water quality changes due to development and resultant land use activities in a watershed.
Water Quality Impacts
As impervious surfaces increase, more water flows off of urban surfaces and is delivered faster to receiving waters. The increased activity on these surfaces means that more polluting material is available, as well. Minimizing the mobilization of this material and its impact is the goal of good runoff management and the purpose of this Manual.
Sources of Pollution
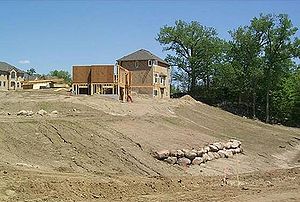
Diffuse sources of pollution, such as that resulting from construction, roadways, parking lots and farm fields, have been a focus for Minnesota water management because they surpass point sources in severity for many pollutants of concern. The conversion of rural and open space land to urban uses is the particular focus of this Manual.
The problems associated with the conversion of land emerge as the land surface changes from one that soaks water into the ground to one that inhibits this infiltration. What used to be a small portion of runoff from a rainfall or snowmelt event becomes a major source of runoff volume. Water that used to soak in collects and flows from these new surfaces with enough energy to erode soil that was formerly held in place with protective vegetative cover and strong roots. Streams generally depend on ground water supplies during dry periods of the year. When infiltration is reduced or eliminated, this ground water is no longer available to supply baseflow and support the life of the channel. For the same reason, deeper ground water aquifer units receive less recharge.
Quantity is not the only problem resulting from changing runoff patterns. The water that washes over these new urban surfaces picks up materials laying upon those surfaces. The sediment from construction erosion, the oil, grease and metals from many automobiles, the fertilizer and pesticides from lawns, and many more new pollutants can adversely impact the receiving waters. There are several nonpoint sources of pollution, each with a distinct set of pollutants of concern.
This table shows nonpoint sources and pollutants associated with them. Source: (Adapted from The Stormwater Pollution Prevention Handbook, Conservation Toronto and Region, 2001).
Link to this table.
| Pollution sources | Pollutants of concerna |
|---|---|
| Vehiclular traffic accounts for much of the build-up of contaminants on road surfaces and parking lots. Wear from tires, brake and clutch linings, engine oil and lubricant drippings, combustion products and corrosion, all account for build-up of sediment particles, metals, and oils and grease. Wear on road and parking surfaces also provides sediment and petroleum derivatives from asphalt. Spills from traffic accidents can occur on any street or highway. |
|
| Lawn and garden maintenance of all types of land uses including residential, industrial, institutional, parks, and road and utility right-of-ways accounts for additions of organic material from grass clippings, garden litter and fallen leaves. Fertilizers, herbicides and pesticides all can contribute to pollutant loads in runoff if not properly applied. |
|
| Air pollution fallout of suspended solids from traffic, industrial sources and wind erosion of soils builds up contaminants in soil and on urban surfaces. |
|
| Municipal maintenance activities including road repair and general maintenance (road surface treatment, salting, dust control, etc.). |
|
| Industrial and commercial activities can lead to contamination of runoff from loading and unloading areas, raw material and by-product storage, vehicle maintenance and spills. | Any raw material exposed to runoff |
| Illicit connections of sanitary services, roof/sump drains or industrial process water to storm sewers can cause contamination with organic wastes, nutrients, heavy metals and bacteria. |
|
| Improper disposal of household hazardous wastes can introduce waste oil and a multitude of toxic materials such as paint, solvents, auto fluids, and waste products to storm and sanitary sewers. Note that industrial and commercial hazardous materials are regulated under point source control programs. | Any household material deemed hazardous |
| Pet and wildlife feces and litter introduce organic contamination, nutrients and bacteria. |
|
| Construction activity can introduce heavy loads of sediment from direct runoff, construction vehicles and wind-eroded sediment. Sediment particles also: transport other pollutants that are attached to their surfaces including nutrients, trace metals and hydrocarbons; fills ditches and small streams and clogs storm sewers and pipes, causing flooding and property damage; and reduces the capacity of wetlands, reservoirs and lakes. Construction can also contribute construction debris, material spills and sanitary waste. |
|
| Combined sewer overflowsb (CSOs) and Sanitary Sewer Overflows (SSOs) contain a mixture of sanitary, commercial and often industrial waste, along with surface drainage. |
|
| Runoff from residential driveways and parking areas can contain driveway sealants, oil, salt, and car care products. |
|
aRepresentative list only; many additional pollutants can be associated with most of the activities listed
bCombined sewers are very limited in Minnesota, with only a few remnants still existing in the metropolitan area. However, the same concerns apply for sewage spills and accidental overflows.
Pollutant Impacts
The impacts of the various pollutants from nonpoint sources are felt to varying levels. It is important to recognize that the hydrologic balance of most receiving water depends on this runoff water. Simply diverting all of the flow around a water body might help reduce a pollution load, but it could also cause the water body to dry up.
The receiving water quality impacts from urban runoff vary depending upon the quality and quantity of the stormwater and the assimilative capacity, or its natural ability to absorb or accommodate certain pollutants without adverse effects, of the receiving waterbody (Conservation Toronto and Region, 2001). Depending on the chemical, biological and physical character of the waterbody, its assimilative capacity can be quite different and tolerance to pollutants may vary greatly. Some waterbodies are inherently more sensitive to types or classes of pollutants than others; for example, lakes are more sensitive to phosphorus than streams and trout streams are more sensitive to increased temperature than non-trout streams.
Potential water quality concerns resulting from stormwater include (among others):
- Beach closures and potential illness from bacteria/virus from fecal material in pet and wildlife litter and sanitary wastes;
- Nuisance algal growth in lakes and streams from nutrient enrichment (nitrogen and phosphorous compounds);
- Choking of aquatic life and elimination of suitable habitat from deposits of sediments, exacerbated if the sediments are also contaminated;
- Toxicity from ammonia, metals, organic compounds, pesticides and other contaminants, including potential endocrine disruption effects from certain organics and pesticides;
- Oxygen depletion potential or biochemical oxygen demand (BOD) of the water from biodegradable organic material, which can lead to oxygen deprivation of the organisms in the receiving water;
- Temperature changes due to an influx of water warmed by the ‘heat island’ effect of roads and buildings. Warm water can hold less dissolved oxygen than cold water, so this thermal pollution further reduces oxygen levels in depleted urban streams. Temperature changes can severely disrupt certain aquatic species, such as trout and stoneflies, which can survive only within a narrow temperature range;
- Aesthetic impacts from floatable matter and sediments (e.g., litter, grass clippings, sanitary items, and soil erosion); and
- Contamination of ground water with soluble organic chemicals, metals, nitrates and salt.
General principles for stormwater management
Awareness of the potential for pollution of Minnesota’s water is an important beginning, but action must follow. A performance based approach to action means that a management plan is put together focused on achieving or maintaining a certain goal. The methods used to achieve the goal are not entirely prescriptive. This allows the stormwater manager the flexibility to be innovative.
There are several principles consistent with integrated stormwater management and the treatment train approach that this Manual uses to promote proper runoff management. They are:
- Think watershed by evaluating where the water from your land comes from and where it will go when it leaves.
- Preventing the potential for a pollutant to be washed-off is always the first step in a treatment train approach to runoff management.
- Unless there is a good reason not to, such as a source of toxic material in the watershed, try to soak in as much water as possible - the treatment train starts here.
- Don’t forget that winter is a season in Minnesota and that all of that snow will eventually melt and need to be managed.
- A vegetative cover is always better than bare soil, and native vegetation is always better than decorative grass.
- The less active management a BMP requires to properly operate, the better.
- Simple is okay. Performance based means the outcome is important, not necessarily the complexity of the BMP(s).
- Thoughtful design and sound construction can reduce the level of maintenance required for effective operation and performance of BMPs.
- Proper maintenance will prolong the life and sustain an optimum level of pollution removal from a BMP.
- Each site in Minnesota requires its own unique characterization to best address its stormwater management needs and coordination with all affected parties is essential to success.
- Management designs should consider all impacts, including secondary environmental factors, health and human safety, maintenance, and financial burden.
Managing stormwater in Minnesota
Minnesota is a large and varied state. Physical elements such as climate, occurrence of water, ecology, geology, soils and topography, and cultural features such as land use vary dramatically from one end of the state to the other. Stormwater managers in Minnesota know that conditions in the state can complicate solutions that might be simple elsewhere in the country. The extreme weather conditions (cold and hot) and physiographic variability under which we operate makes it impossible to generalize a single accepted approach for the entire state under all conditions. Flexibility in approaching problems site by site is stressed in this Manual. The following section describes some of the statewide variability that can be addressed with variable techniques in the Manual. Appendix A contains a compilation of several additional graphics illustrating the differences in factors that can influence stormwater.
Climate
The climate of Minnesota is characteristic of a transition zone from the moist and temperate eastern U.S. to the dry and droughty western U.S. Minnesota’s large size also means that much variation can occur within the state in any given year. Add to that extremes in temperature, and the difficulty in trying to describe Minnesota’s climate can be appreciated. Although the temperature discussion is interesting, this Manual has been developed to address water, so other than the fact that we experience very cold winters, temperature will not be discussed.
The major factors to focus on for good statewide stormwater management are rainfall and snowfall (snowmelt). A complete picture of Minnesota stormwater runoff cannot be painted without a discussion of both. Issue Paper B in the Manual Sub-Committee series examined some questions associated with the frequency of precipitation in Minnesota. The discussion was oriented around which design events to use as a basis for unified sizing of stormwater facilities across the state.
Normal average annual Minnesota precipitation (rain plus snow) varies from less than 20 inches in the northwest to about 35 inches in the southeast. Normal average annual snowfall varies from about 40 to 64 inches and follows the same geographic distribution as overall precipitation.
Rainfall
The real impact of the precipitation that falls in the state is felt when it runs off either as rainfall or snowmelt. (see File:Issue paper B - precipitation frequency analysis and use.pdf) contains a substantial amount of discussion on the proper statistical representation of “design events” based on the relationship of precipitation to runoff. The discussion was intended to set the stage for selection of the unified sizing criteria. Much of the discussion with the Manual Sub-Committee concerned the use of the US Weather Bureau’s 1961 [Technical Publication 40], commonly known as “TP 40”. Even though this publication is generally considered out of date because it does not reflect recent climate changes, there is no acceptable substitute at this time (see File:Issue paper B - precipitation frequency analysis and use.pdf). Until such time as an acceptable replacement exists, graphics from TP-40 should be used in Minnesota. These include graphs showing the 1-year through 100-year, 24-hour rainfall events. This data is summarized in the following table.
Table illustrating rainfall ranges across Minnesota and the average rainfall in the Twin Cities for the 1, 2, 5, 10, 25, 50, and 100-year storm events.
| Event frequency | Minnesota range (inches) | Twin Cities approximate average |
|---|---|---|
| 1-year | 1.8 - 2.6 | 2.4 |
| 2-year | 2.1 - 2.9 | 2.75 |
| 5-year | 2.8-3.7 | 3.65 |
| 10-year | 3.3 - 4.4 | 4.2 |
| 25-year | 3.9 - 5.0 | 4.8 |
| 50-year | 4.4 - 5.6 | 5.3 |
| 100-year | 4.8 - 6.2 | 5.95 |
Snowmelt
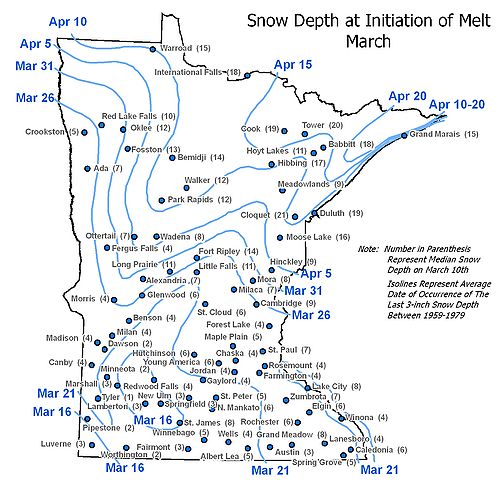
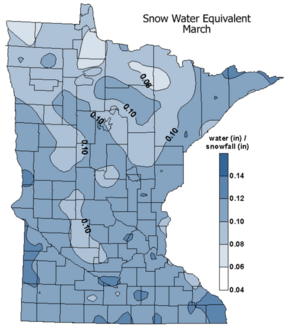
The determination of snowmelt volumes is more complicated that rainfall because it depends on two factors – snowfall depth and the amount of moisture (or the equivalent water moisture) in the snow. In addition, some of the melted water infiltrates the soil. The overall snowmelt volume is given by the following equation:
Sv = Sd * Sw - Iv
where
- Sv is the snowmelt volume(inches)
- Sd is the average snow pack depth at the time of the snowmelt period (inches)
- Sw is the typical snow pack water equivalent at time of melt
- Iv is the estimated infiltration volume likely during a 10 day melt period
Statewide maps can be established estimating the snow depth at the initiation of snowmelt, the snow water quivalent at the time of snowmelt, and snowmelt infiltration based on the soil moisture content.
Details regarding Minnesota climate in general can be obtained from the Minnesota Climatology Working Group.
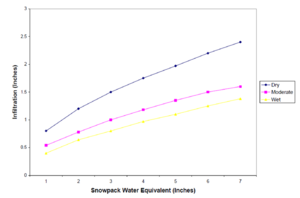
Of course not all of the meltwater runs off. Research indicates that some of the meltwater enters the ground as infiltration. This can be represented graphically, but graphics need local adjustment based on knowledge of ground conditions. These graphics should be considered an approximation of the amount of melt that will soak into the ground and hence be removed from the total runoff volume.
Physical features
Many of the physical features that influence the behavior of stormwater are not mapped at a level of sufficient enough detail for the state. This section will generally describe the features of importance and refer the user to sources of better information.
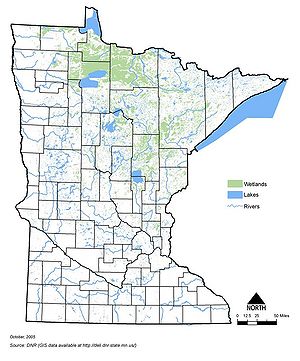
Minnesota waters
Due to the richness and variety of Minnesota’s water resources, several classes of waters have been identified for special protections through legislation or programs designed to protect these unique resources.
- Special Waters: Special Waters are designated in the Minnesota Construction General Permit, and include the following eight categories of receiving waters:
- Outstanding Resource Value Waters (ORVW): ORVWs are designated in Minnesota Rules Chapter 7050 and include the following categories:
- Waters within the Boundary Waters Canoe Area Wilderness [11], Voyageur’s National Park [12], and Department of Natural Resources designated scientific and natural areas [13]
- Wild, scenic, and recreational river segments [14]
- Lake Superior
- Portions of the Mississippi River from Lake Itasca to the southerly boundary of Morrison County
- Other waters of the state with high water quality, wilderness characteristics, unique scientific or ecological significance, exceptional recreational value, or other special qualities which warrant stringent protection from pollution [15][16]
- Other sensitive receiving waters: In addition to the Special Waters and ORVWs, there are several other classes of sensitive receiving waters, as defined by a variety of federal, state and local entities, that receive special protections and merit additional management attention. These other sensitive receiving waters can be broken down into five general classes:
Watersheds and ecoregions
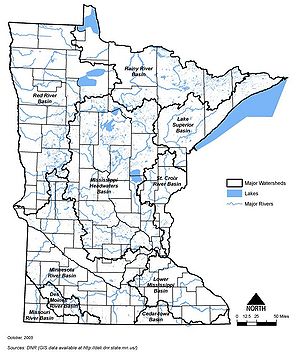
Watershed-based water management began in earnest in the state in the mid-1950s and has had several additional mandates put in place since then. Watershed districts, watershed management and watershed-based planning are all common terms within the state. There are eight major watershed basins across the state. Details on local watersheds are available from local sources, the [www.dnr.state.mn.us/watersheds/map.html Minnesota Department of Natural Resources] or the Minnesota Association of Watershed District’s “Where is my Watershed?” website.
The reality associated with so many watershed units occurring in the state is that a complex planning and regulatory framework exists for water management. Many of the sub-watersheds contained within the major watershed units have watershed management organizations that typically have some level of authority through a Watershed District or Watershed Management Organization. Information on the location and operations of these organizations can be obtained from the [www.bwsr.state.mn.us Board of Water and Soil Resources<]/p>
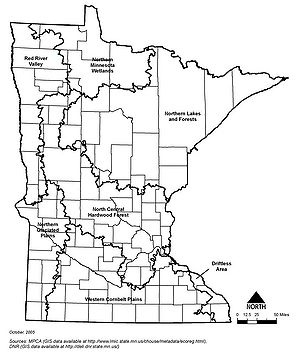
Another primary watershed mapping unit for Minnesota waters is based on MPCA’s ecoregion concept. These are geographic areas reflective of similar ecological character assembled to define causative factors for water behavior. There are seven ecoregions mapped for the state:
- Northern Minnesota Wetlands
- Red River Valley
- Northern Lakes and Forests
- Northern Glaciated Plains
- North Central Hardwood Forests*Western Corn Belt Plains
- Driftless Area
Although not universally true, waters within each ecoregion should generally be similar in character, when all other factors (like rainfall, land use, and land cover) are similar. MPCA uses these as basic planning units for setting water quality standards and evaluating water quality variation. Keeping in mind the watershed and ecoregion within which water is being managed is an important part in structuring an effective management approach for stormwater.
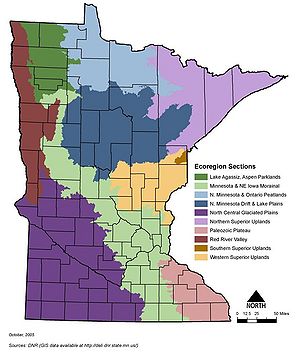
The variable ecology across the state can be presented in many different ways. One example is the concept of ecoregion sections developed by the DNR. The DNR's division of ecoregions is based largely on surficial geology and geologic landforms. As with any statewide map, data should be verified with local data when used as a consideration in stormwater design.
Geology
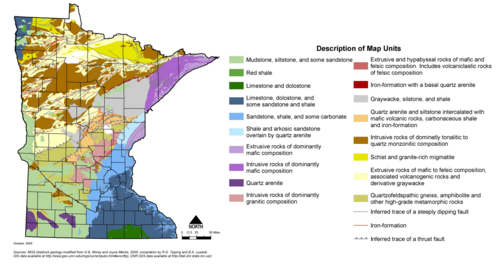
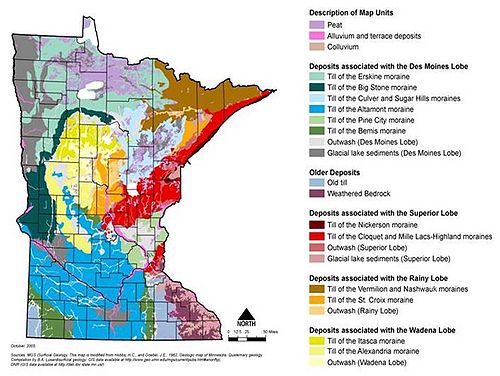
The geologic variability across Minnesota is reflective of billions of years of igneous and sedimentary history, plus geologically “recent” glaciation which is responsible for much of Minnesota’s vast natural beauty and abundance of water related resources. In most cases, the debris left behind by the glaciers provides a thick cover between the land surface and the buried surface of the underlying bedrock. In other cases, this glacial material either by-passed a location or has been eroded away, exposing bedrock to material (and possibly pollution) that comes from the land surface. Manual users are referred to the Minnesota Geological Survey (MGS) for details on the geology of the state.
Shallow bedrock
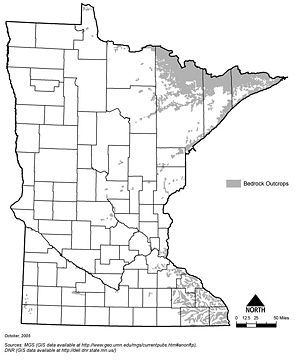
In many portions of the state, bedrock occurs at or near the surface. The “red rocks” of the southwest, igneous intrusions along the St. Croix River and North Shore, and scattered sedimentary outcrops all around the state present some challenges in stormwater management because of their proximity to the surface. Among those difficulties are a lack of soil depth for use of infiltration techniques, structural impairment to best management practice (BMP) installation and steep slopes. The stormwater management implications of shallow bedrock affect infiltration, ponding depths, and the use of underground practices. Details can be obtained from the Minnesota Geological Survey (MGS) or a reliable local source, such as the county or a local well driller.
Karst
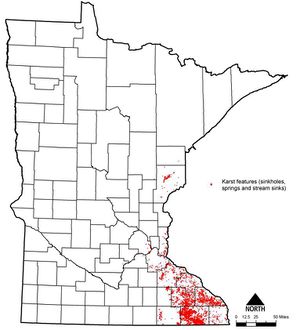
Carbonate and possibly other forms of bedrock can erode or dissolve in a manner that opens up pathways for movement of water into and through the rock. Such karst features, if sufficiently close to the land surface or to a ground water flow pathway, can present an opportunity for surface contaminants to enter the ground water system with very little or no treatment. This has important implications with respect to geotechnical testing, infiltration, pre-treatment and ponding of runoff.
Karst regions are predominantly found in the southeastern portion of the state. These areas have important implications with respect to geotechnical testing, infiltration, pretreatment and ponding of runoff. Caution must be used in interpreting the geographic depiction of “Karst lands”. Local data should be used when available rather than using a generalized statewide map.
In karst settings where active karstic conditions (within 50 feet of the surface) are known to exist, additional constraints and considerations need to be evaluated prior to implementing most structural BMPs. Of particular concern in karst settings is the formation of sinkholes as a result of hydraulic head build up and/or dissolution of rock present underneath or adjacent to BMPs. Concerns also exist for ground water flow interruption, interflow and recharge particularly as it relates to stormwater facility, location, and size and the relationship of ground water to surface water. Where karst conditions exist, there are no prescriptive rules of thumb or universally accepted management approaches because of the variability intrinsic to karst terrain. An adaptation of a familiar old saying is very appropriate: the only thing predictable about the behavior of water in a karst system is its unpredictability.
In general when underlying karst is known or even suspected to be present at the site, stormwater runoff should not be concentrated and discharged into known sinkholes, but should rather be dispersed, or soaked into the ground after adequate pre-treatment, or conveyed to a collection and transmission system away from the area. In other cases, it may be impossible to remove water from an area with sinkholes or away from karst geology, so common sense clean-up of the water and discharge into the karstic area is a reasonable management approach, especially if some filtering soil is available between the land surface and the karst formation.
Soils
One of the first steps in the selection of BMPs is an assessment of the type of soils present on a site and the inherent ability of those soils to soak-up water. Soils are extremely variable throughout the state, but fortunately good information on local soil conditions is usually available. Details on surficial soils (generally to a depth of about six feet) are contained in county soil surveys, which are available from the U.S. Department of Agriculture’s Natural Resource Conservation Service (NRCS). Soil surveys for much of the state have been digitized to make electronic use practical. Note, however, that these surveys are not accurate enough to determine site specific characteristics suitable for many BMP applications, so a detailed site analysis is recommended. The primary reason for this is that soils can vary substantially with depth, and the county soil surveys depict only surficial mapped units.
Limited infiltration capacity
Soils with low infiltration capacity are found throughout the state. On a local scale the absence of good soils that can absorb runoff (i.e., infiltrate) can be a major detriment to good stormwater management. Stormwater management limitations in areas with “tight” soils generally preclude large-scale infiltration and ground water recharge (infiltration that passes into the ground water system). These soils will typically be categorized under Hydrologic Soil Group (HSG) D and have other characteristics. The infiltration rates noted in this table are conservative estimates of long-term, sustainable infiltration rates that have been documented in Minnesota. They are based on in-situ measurement within existing infiltration practices in Minnesota, rather than national numbers or rates based on laboratory columns.
Use of HSG C or D soils for BMPs that rely on infiltration is generally not recommended unless a pre-development condition is trying to be simulated. That is, these soils can certainly be used in a system that relies only on a small amount of infiltration similar to the small amount that inherently exists on site. If a manager wants to match pre-development volume for all soils, it is apparent that D soils will continue to yield low infiltration.
Rapidly infiltrating soils
On the opposite side of the infiltration spectrum are those soils that rapidly infiltrate water from the surface. Soils with large percentages of sand and separate from the water table transmit water very quickly and might work extremely well for infiltration practices provided precautions are taken to protect the ground water from the introduction of polluting materials. The level of treatment in sandy soils is quite variable. Although the sands can act similar to a sand filter for particulate material, soluble pollutants generally move through the soil quite rapidly and unattenuated. An example of a large-scale sandy soil condition is the Anoka Sand Plain. Similar large expanses of sandy soils exist elsewhere in Minnesota and should be recognized when planning a BMP strategy.
Topography
The elevation and topographical changes evident in Minnesota also present variable challenges to local stormwater managers. For example, the steep slopes along the North Shore and along many major river banks requires a far different approach than those practices where a deep soil cover exists on a flat plain or slowly rolling hills. Local attention is required when information on slope, topography and physiographic character is part of the stormwater management deliberation.
Cultural features
Most of the cultural variation in the state relates to differences in land use that have resulted as the state developed over the past 100+ years. Although the major focus of this Manual is on urbanized land uses, many urbanizing type activities, such as road building, transcend a single land use and apply throughout the state. Also in many cases urbanization occurs on land that was previously altered by agricultural, silvicultural, or pre-development activity.
How this manual will help
The citizens of Minnesota long ago realized the potential for worsening water quality as the state grew. The solution they discovered was not to stop growth, but rather to plan for how it happens and to institute protective actions to prevent many of the negative impacts. It is virtually impossible to prevent all negative impacts, but there is a realistic expectation that efforts to minimize the impact should occur. This is the basis for the stormwater regulatory program in place in the state.
There are also many new and ever-evolving ways to manage the runoff and eliminate some of the pollution associated with it. These best management practices are proven effective measures that are readily available in both structural and non-structural ways. There are no “best” solutions that apply universally to all situations across the state. There are best solutions that can be chosen for specific applications to solve specific problems, hence the name best management practice.
The Minnesota Stormwater Manual provides insight for Minnesota stormwater managers on the nature of the stormwater problem in the state, as well as guidance on how to manage it using many available tools. We can protect our valuable receiving waters through a reasonable set of practices applied equitably across the state. This is a major objective of this Manual.
References
- Alexander, E.C. Jr. and Y. Gao, 2002. Copyrighted map of Minnesota Karst Lands.
- Conservation Toronto and Region, 2001. The Storm Water Pollution Prevention Handbook. Copublished with the Ontario Ministry of the Environment.
- Stormwater Management Manual Georgia (State of), 2001.
- Granger, R.J., D.M. Gray, and G.E. Dick, 1984. Snowmelt Infiltration to Frozen Soils. Canadian Journal of Earth Science, 21:669-677.
- Great Lakes Association. Percent Bedrock Outcrop of Landtype Associations of Northern Minnesota Map.
- Minnesota State Climatology Office and Minnesota Department of Natural Resources. 2003. Normal Annual Precipitation.
- Natural Resource Conservation Service. 2005. Status of Soil Survey Digitizing (SSURGO) Minnesota.
- Schueler, T.R., 1987. Controlling Urban Runoff: A Practical Manual for Planning and Designing Urban Best Management Practices. Metropolitan Washington Council of Governments, Washington, D.C.
- U.S. Weather Bureau (D.M. Hershfield), 1961. Rainfall Frequency Atlas of the United States for Durations from 30 Minutes to 24 Hours and Return Periods from 1 to 100 Years. USWB Technical Publication 40 (TP 40).
