Difference between revisions of "Rainfall volume-frequency maps"
m |
m |
||
| Line 1: | Line 1: | ||
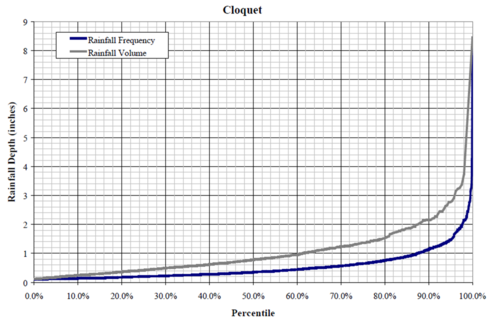
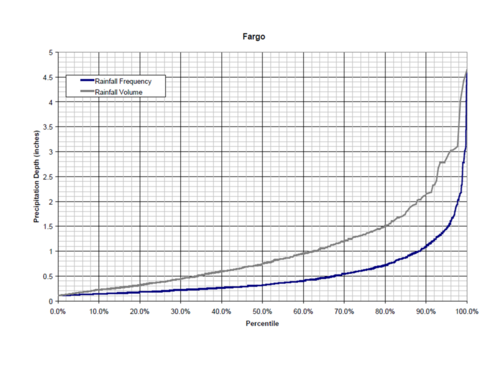
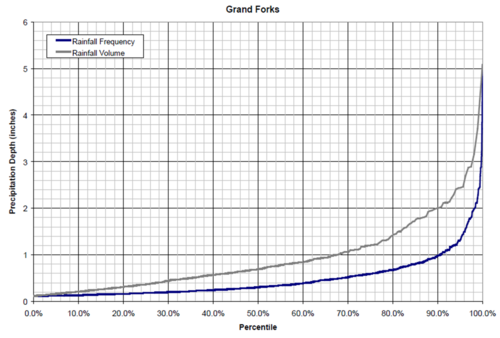
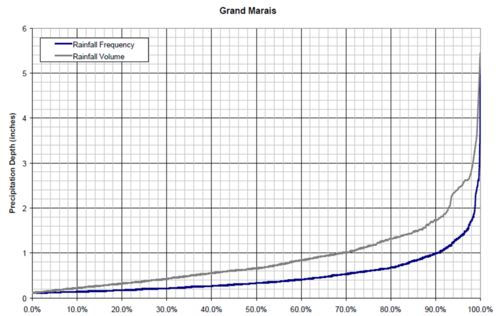
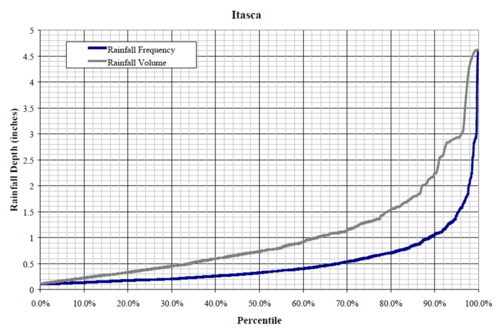
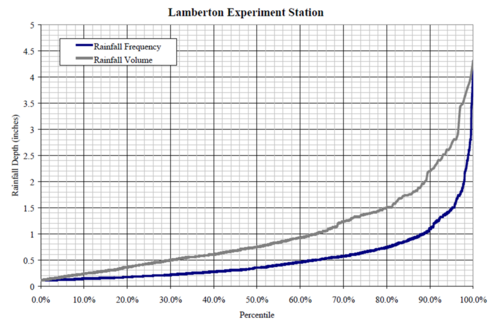
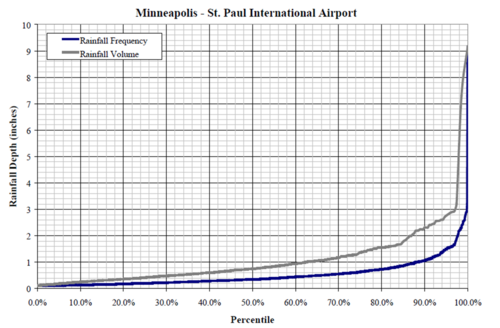
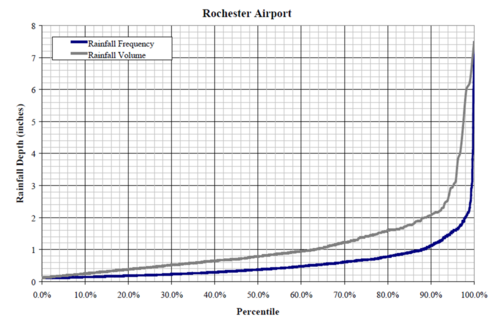
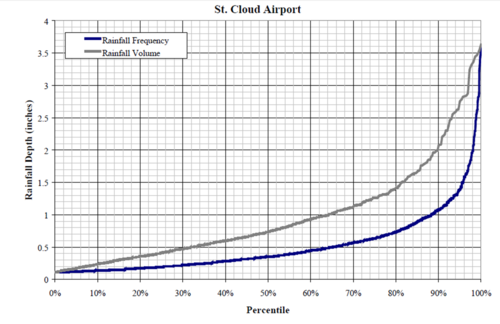
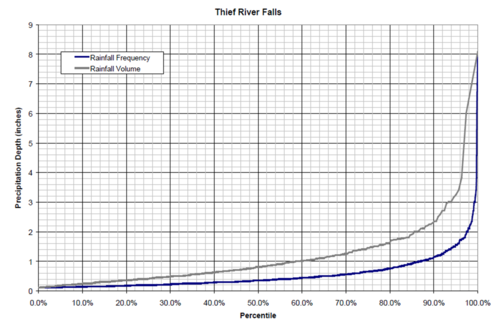
In the development of rainfall frequency and volume data for Minnesota, the Minnesota Stormwater Manual Sub-Committee conducted an analysis of rainfall distribution for several locations in Minnesota. The methodology and results of this analysis are described in [http://stormwater.pca.state.mn.us/images/a/a8/Issue_paper_B_-_precipitation_frequency_analysis_and_use.pdf Issue Paper B]. Frequency-volume graphs were developed for several locations in the state and are illustrated below. | In the development of rainfall frequency and volume data for Minnesota, the Minnesota Stormwater Manual Sub-Committee conducted an analysis of rainfall distribution for several locations in Minnesota. The methodology and results of this analysis are described in [http://stormwater.pca.state.mn.us/images/a/a8/Issue_paper_B_-_precipitation_frequency_analysis_and_use.pdf Issue Paper B]. Frequency-volume graphs were developed for several locations in the state and are illustrated below. | ||
| + | |||
| + | In viewing these graphs, note that the volume represents the percent volume captured for a particular size storm and not the cumulative volume. For example, consider a BMP designed to capture the first inch of precipitation. A 1 inch storm captures about 90 percent of all rainfall events at Minneapolis-St. Paul International Airport. Storms up to 1 inch represent about 60 percent of the total volume. However, for storms exceeding 1 inch in depth, the first inch will be captured by the BMP. Thus, the annual volume captured by the BMP is much greater than 60 percent. For a B soil, the annual volume captured by the BMP will be about 90 percent. | ||
[[File:Cloquet rainfall frequencies.png|500px|alt=map showing rainfall frequency and volume percentiles as a function of precipitation depth for Cloquet|Map showing rainfall frequency and volume percentiles as a function of precipitation depth for Cloquet]] | [[File:Cloquet rainfall frequencies.png|500px|alt=map showing rainfall frequency and volume percentiles as a function of precipitation depth for Cloquet|Map showing rainfall frequency and volume percentiles as a function of precipitation depth for Cloquet]] | ||
Revision as of 15:22, 28 December 2015
In the development of rainfall frequency and volume data for Minnesota, the Minnesota Stormwater Manual Sub-Committee conducted an analysis of rainfall distribution for several locations in Minnesota. The methodology and results of this analysis are described in Issue Paper B. Frequency-volume graphs were developed for several locations in the state and are illustrated below.
In viewing these graphs, note that the volume represents the percent volume captured for a particular size storm and not the cumulative volume. For example, consider a BMP designed to capture the first inch of precipitation. A 1 inch storm captures about 90 percent of all rainfall events at Minneapolis-St. Paul International Airport. Storms up to 1 inch represent about 60 percent of the total volume. However, for storms exceeding 1 inch in depth, the first inch will be captured by the BMP. Thus, the annual volume captured by the BMP is much greater than 60 percent. For a B soil, the annual volume captured by the BMP will be about 90 percent.
