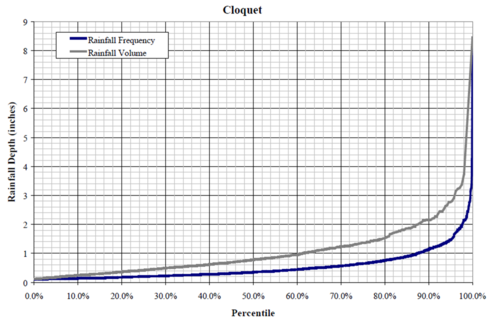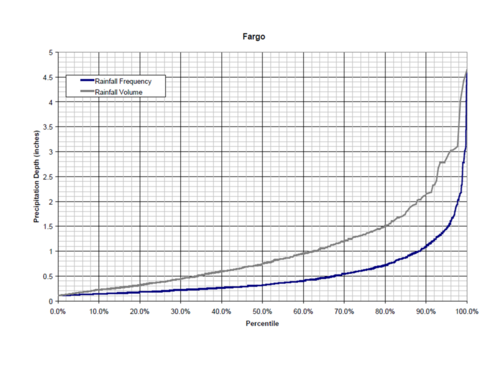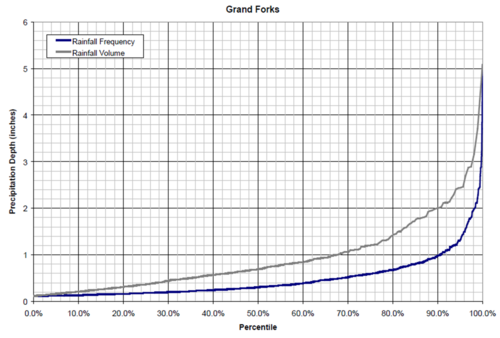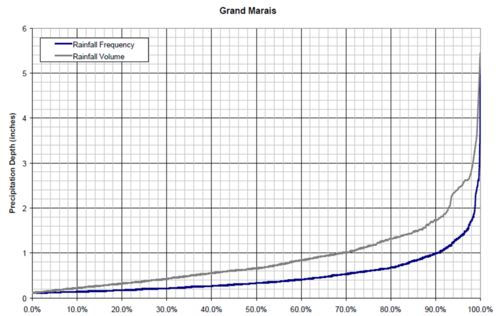
Rainfall volume-frequency maps
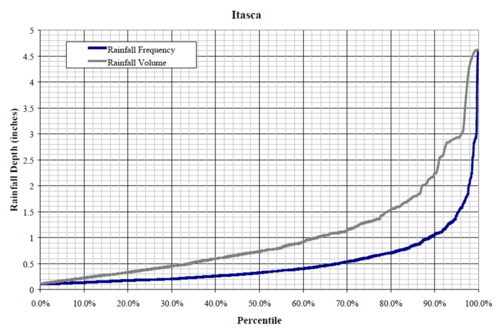
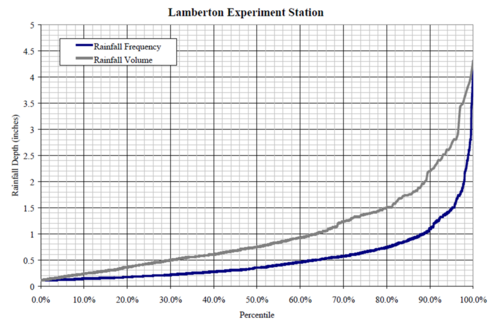
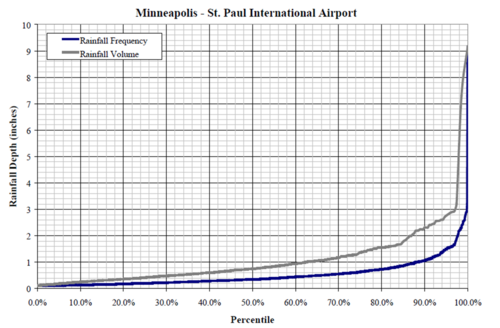
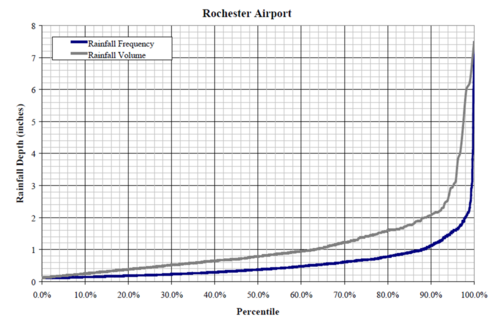
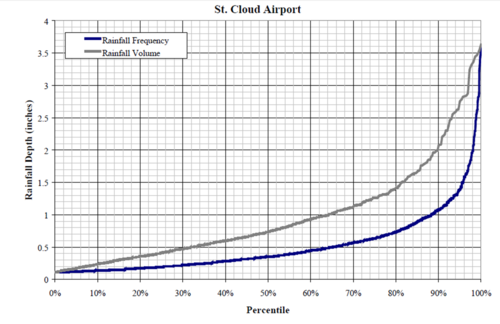
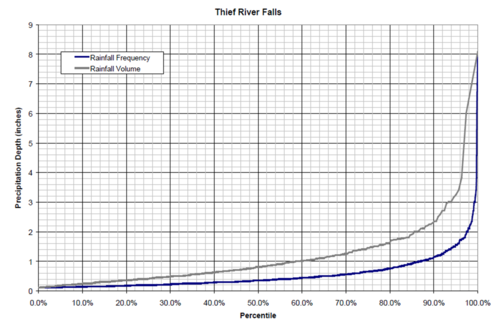
In the development of rainfall frequency and volume data for Minnesota, the Minnesota Stormwater Manual Sub-Committee conducted an analysis of rainfall distribution for several locations in Minnesota. The methodology and results of this analysis are described in Issue Paper B. Frequency-volume graphs were developed for several locations in the state and are illustrated below.
In viewing these graphs, note that the volume represents the percent volume captured for a particular size storm and not the cumulative volume. For example, consider a BMP designed to capture the first inch of precipitation. A 1 inch storm captures about 90 percent of all rainfall events at Minneapolis-St. Paul International Airport. Storms up to 1 inch represent about 60 percent of the total volume. However, for storms exceeding 1 inch in depth, the first inch will be captured by the BMP. Thus, the annual volume captured by the BMP is much greater than 60 percent. For a B soil, the annual volume captured by the BMP will be about 90 percent. The table below summarizes annual volume captured by a BMP at the Minneapolis-St. Paul International Airport for different soil types.
Annual volume, expressed as a percent of annual runoff, treated by a BMP as a function of soil and Water Quality Volume. See footnote1 for how these were determined.
Link to this table
| Soil | Water quality volume (VWQ) (inches) | ||||
|---|---|---|---|---|---|
| 0.5 | 0.75 | 1.00 | 1.25 | 1.50 | |
| A (GW) | 84 | 92 | 96 | 98 | 99 |
| A (SP) | 75 | 86 | 92 | 95 | 97 |
| B (SM) | 68 | 81 | 89 | 93 | 95 |
| B (MH) | 65 | 78 | 86 | 91 | 94 |
| C | 63 | 76 | 85 | 90 | 93 |
1Values were determined using the MIDS calculator. BMPs were sized to exactly meet the water quality volume for a 2 acre site with 1 acre of impervious, 1 acre of forested land, and annual rainfall of 31.9 inches.
This page was last edited on 19 December 2022, at 22:19.
