m
m
Line 3: Line 3:
 
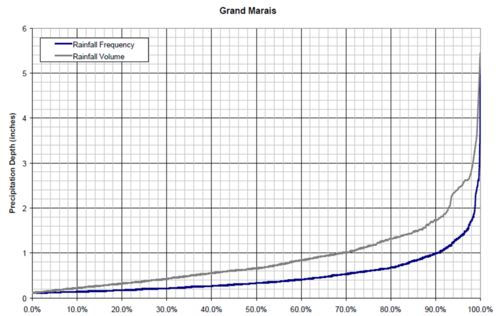
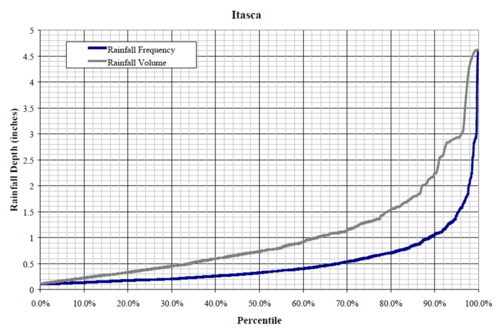
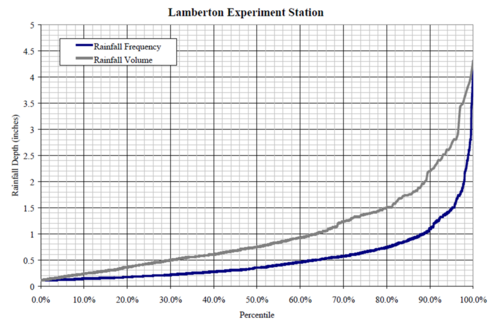
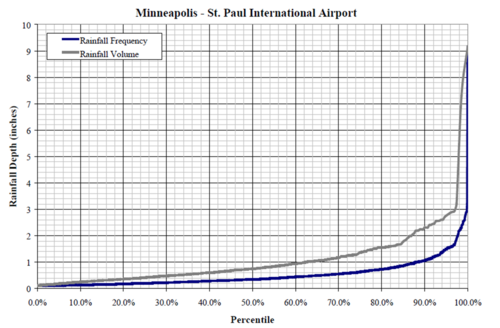
*rainfall frequency and volume percentiles as a function of precipitation depth for ten locations in Minnesota
 
*rainfall frequency and volume percentiles as a function of precipitation depth for ten locations in Minnesota
  
<br>
+
{{alert|To view the title of an image hold the mouse over the image.  To  view the image click on the image. Most views show higher resolution depictions of the image.|alert-info}}
  
 
[[File:1 year 24 hour rainfall.jpg|300 px|alt=map showing 1-year 24-hour rainfall distribution across Minnesota|map showing 1-year 24-hour rainfall distribution across Minnesota]]
 
[[File:1 year 24 hour rainfall.jpg|300 px|alt=map showing 1-year 24-hour rainfall distribution across Minnesota|map showing 1-year 24-hour rainfall distribution across Minnesota]]

Revision as of 19:09, 18 December 2012

This page provides:

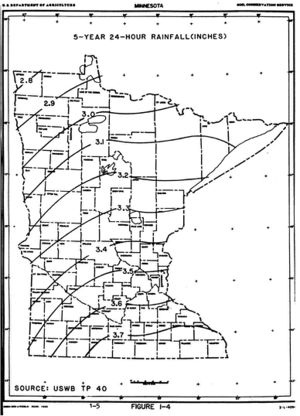
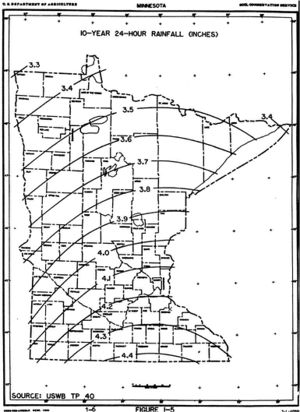
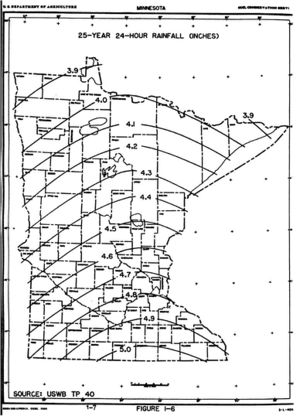
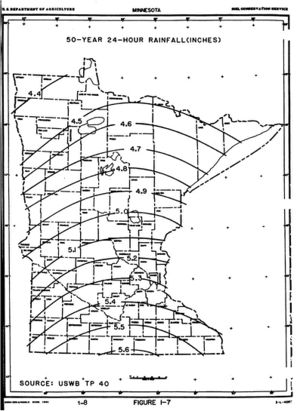
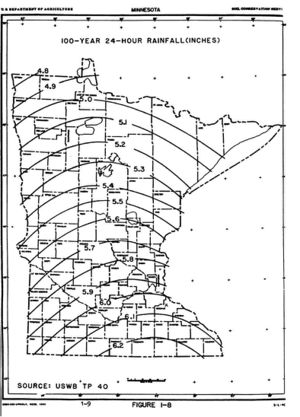
  • rainfall frequency curves for the 1, 2, 5, 10, 25, 50, and 100 year 24-hour rainfall events for Minnesota. The source of the data is Technical Paper 40 (National Oceanic and Atmospheric Administration)
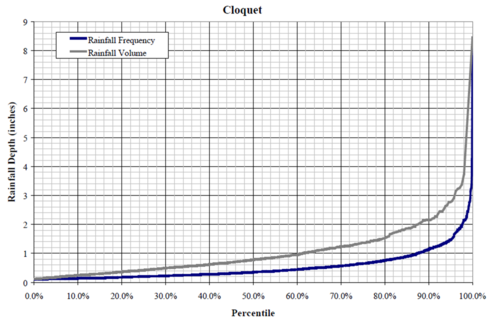
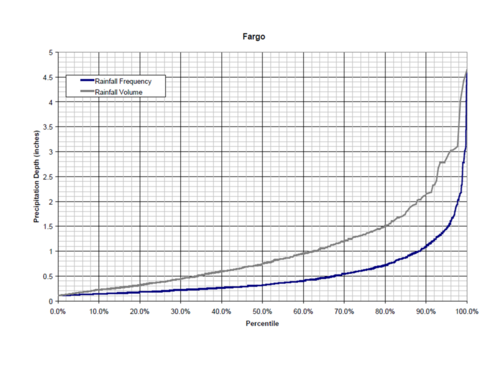
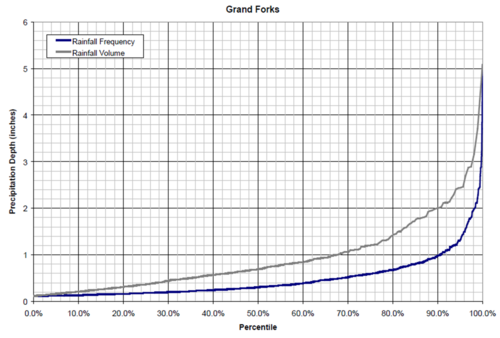
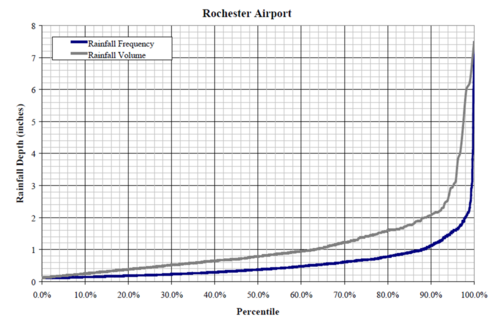
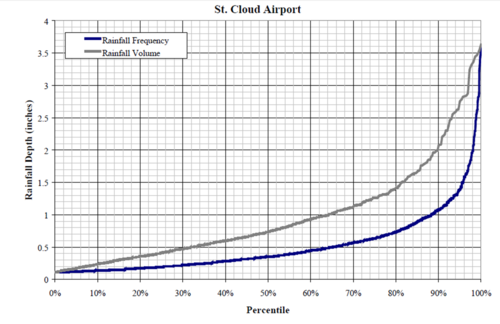
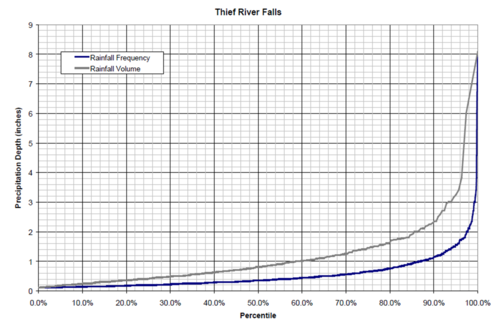
  • rainfall frequency and volume percentiles as a function of precipitation depth for ten locations in Minnesota
Information: To view the title of an image hold the mouse over the image. To view the image click on the image. Most views show higher resolution depictions of the image.
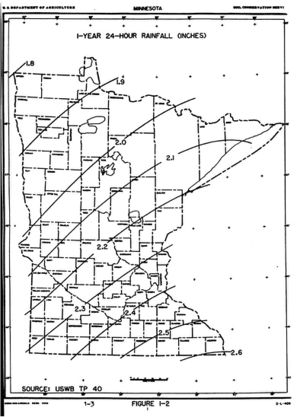
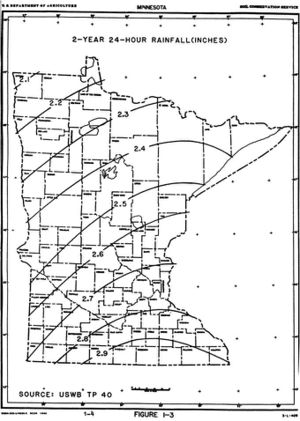
map showing 1-year 24-hour rainfall distribution across Minnesota map showing 2-year 24-hour rainfall distribution across Minnesota map showing 5-year 24-hour rainfall distribution across Minnesota map showing 10-year 24-hour rainfall distribution across Minnesota map showing 25-year 24-hour rainfall distribution across Minnesota map showing 50-year 24-hour rainfall distribution across Minnesota map showing 100-year 24-hour rainfall distribution across Minnesota map showing rainfall frequency and volume percentiles as a function of precipitation depth for Cloquet map showing rainfall frequency and volume percentiles as a function of precipitation depth for Fargo map showing rainfall frequency and volume percentiles as a function of precipitation depth for Grand Forks map showing rainfall frequency and volume percentiles as a function of precipitation depth for Grand Marais map showing rainfall frequency and volume percentiles as a function of precipitation depth for Itasca map showing rainfall frequency and volume percentiles as a function of precipitation depth for Lamberton map showing rainfall frequency and volume percentiles as a function of precipitation depth for Minneapolis and St. Paul map showing rainfall frequency and volume percentiles as a function of precipitation depth for Rochester map showing rainfall frequency and volume percentiles as a function of precipitation depth for St. Cloud map showing rainfall frequency and volume percentiles as a function of precipitation depth for Thief River Falls