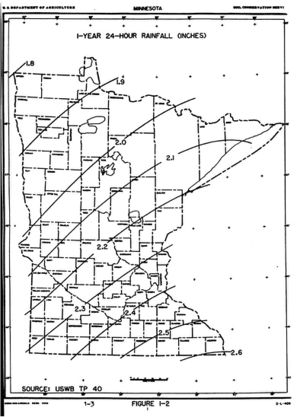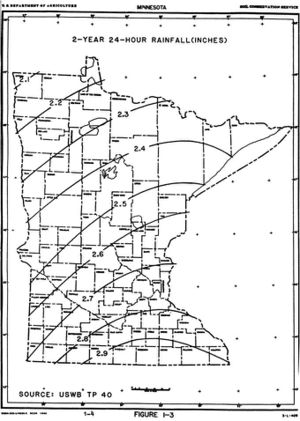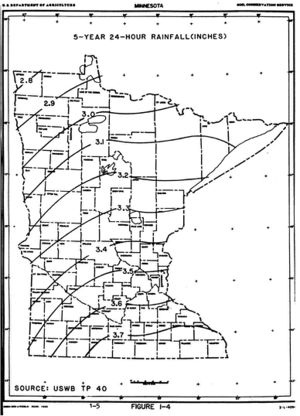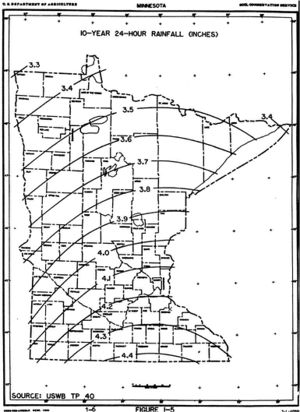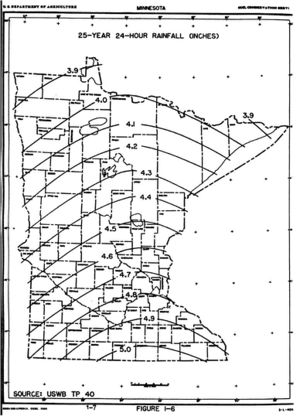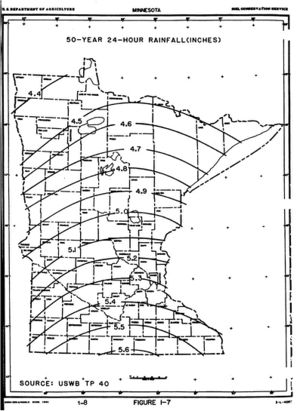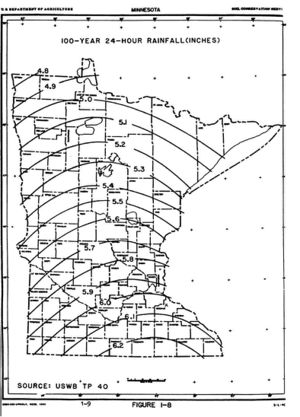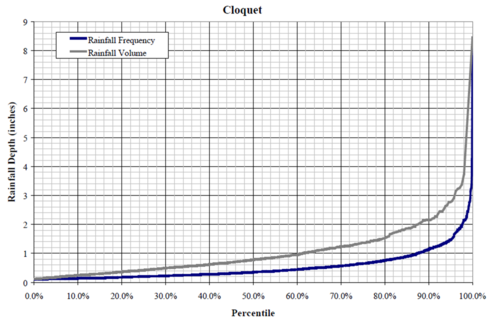
This page provides:
- rainfall frequency curves for the 1, 2, 5, 10, 25, 50, and 100 year 24-hour rainfall events for Minnesota. The source of the data is Technical Paper 40 (National Oceanic and Atmospheric Administration)
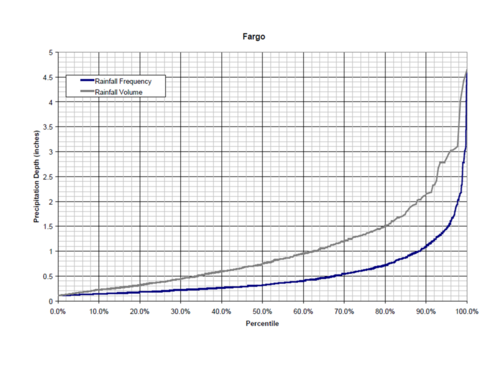
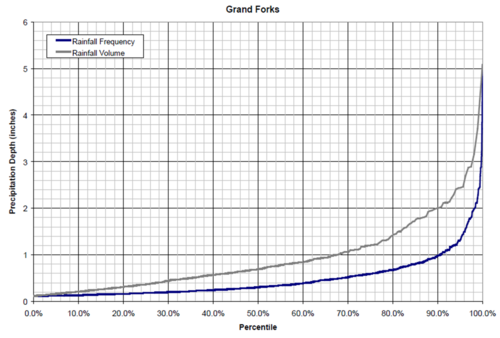
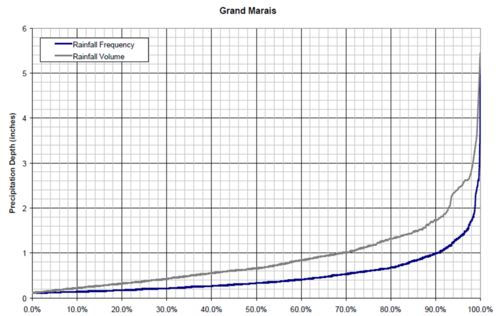
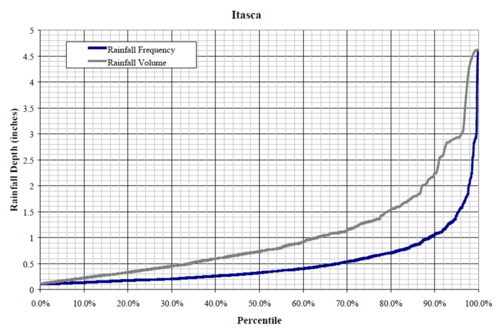
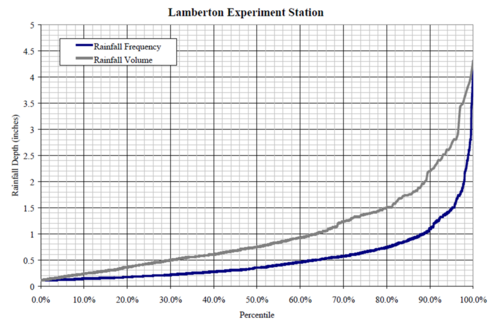
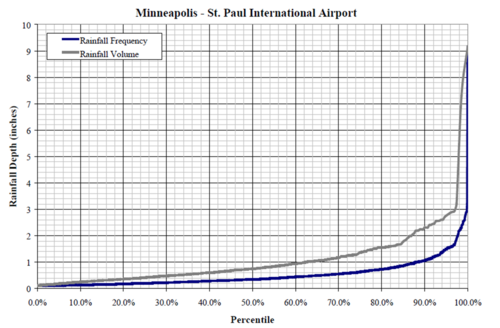
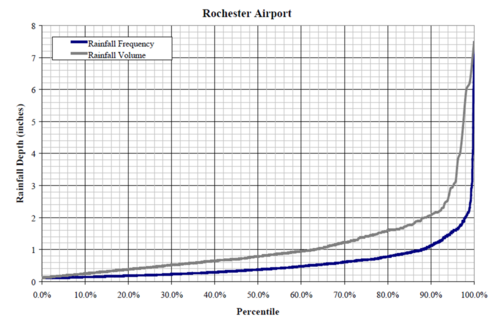
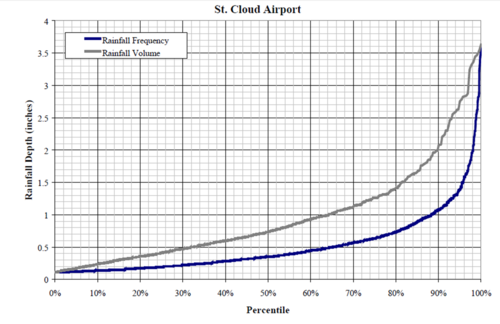
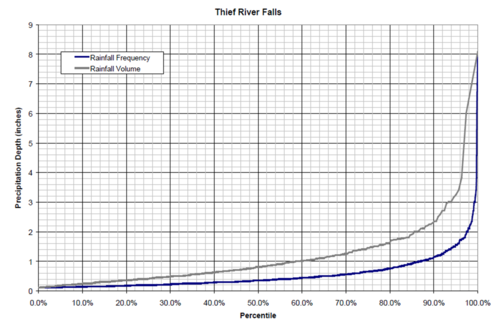
- rainfall frequency and volume percentiles as a function of precipitation depth for ten locations in Minnesota
Information: To view the title of an image hold the mouse over the image. To view the image click on the image. Most views show higher resolution depictions of the image.
