Calculating credits for iron enhanced sand filter
| Recommended pollutant removal efficiencies, in percent, for iron enhanced sand filters. Note that the values given for metals and hydrocarbons are the same as those for non-enhanced sand filters. Though iron enhanced systems may have increased removal efficiencies for these chemicals, there is insufficient data in the literature. Sources. TSS=total suspended solids; TP=total phosphorus; PP=particulate phosphorus; DP=dissolved phosphorus; TN=total nitrogen | |||||||
| TSS | TP | PP | DP | TN | Metals | Bacteria | Hydrocarbons |
| 85 | 741 | 85 | 601 | 35 | 50 | 80 | 80 |
| 1Assumes Tier 2 iron enhanced sand filter. If the sand filter is Tier 1, then DP removal is 40% and TP removal is 65% | |||||||
Credit refers to the quantity of stormwater or pollutant reduction achieved either by an individual best management practice (BMP) or cumulatively with multiple BMPs. Stormwater credits are a tool for local stormwater authorities who are interested in
- providing incentives to site developers to encourage the preservation of natural areas and the reduction of the volume of stormwater runoff being conveyed to a best management practice (BMP);
- complying with permit requirements, including antidegradation (see Construction permit; Municipal (MS4) permit);
- meeting the MIDS performance goal; or
- meeting or complying with water quality objectives, including total maximum daily load (TMDL) wasteload allocations (WLAs).
This page provides a discussion of how enhanced sand filter practices can achieve stormwater credits.
Overview
For a detailed overview of iron-enhanced sand filters, see the Overview section for iron enhanced sand filters.
Volume credits
Volume credits are not applicable to iron enhanced sand filters.
TSS credits
TSS credits for enhanced sand filters are the same as those for sand filters and are described on the page discussing credits for sand filters.
Phosphorus
The primary advantage of iron-enhanced filtration is that it removes dissolved constituents including phosphate, color and some metals by chemical binding.
Iron-enhanced sand filters can be used as a retrofit to existing BMPs or in new construction. If the iron-filtration bed remains oxygenated, iron will be retained in the bed. Iron-filtration beds that are persistently deoxygenated risk iron loss or migration and clogging.
Credit summary
Three design levels were created for sand filters. These are described below. NOTE: PP=particulate phosphorus, DP=dissolved phosphorus, TP=total phosphorus
- Level 1: TSS removal = 75%, PP removal = 41%
- Provides less than full water quality volume treatment, or
- Pretreatment less than 25% of water quality volume, or
- Filter bed is less than 5% of contributing drainage area
- Level 2: TSS removal = 85%, PP removal = 47%
- Provides full water quality volume treatment, and
- Pretreatment 25% or more of water quality volume, and
- Filter bed > 5% of contributing drainage area
- Level 3: TSS removal = 90%, PP removal = 50%
- Exceeds water quality volume by more than 50%, and
- Pretreatment 25% or more of water quality volume, and
- Filter bed > 10% of contributing drainage area
For each of these design levels, the PP credit was calculated as 55 percent of the TSS credit, based on an assumption that PP is 55 percent of TP and there is no preferential retention of P based on particle size. For the above conditions, dissolved phosphorus removal is zero (0). Two tiers for crediting dissolved phosphorus exist and conditions needed to meet the criteria are described.
- Tier 1: Amendment added and meets the following; DP removal = 40%
- Iron enhanced system, and
- Iron 5-8% by weight, high purity iron (90%+ elemental iron) with little or no toxic impurities (e.g., copper, cadmium, lead, etc.), and reactive with phosphate, and
- Inspect IESFs at least once annually, with more frequent inspections (monthly or quarterly) during the first 1-2 years if needed to ensure construction was successful (see Assessing the performance of iron enhanced sand filter), and
- Annually or as needed remove vegetation and accumulated sediment (as needed, typically after a storm greater than 1 in of precipitation), and
- Rake surface with a steel-tipped rake to break up oxidized iron clumps or crust that may form, and
- System designed to allow drying (e.g. exposed to sunlight and access to air through drain tile)
- Level spreader, modified pond inlets, or other method or design for spreading water across the system, and
- Enhanced pretreatment designed to remove organic material (see Pretreatment Practice Selection Tool to identify practices effective at removing debris and solids), and
- Designed to be offline such that flows beyond the water quality volume flows are diverted around the system, and
- Inspection and maintenance agreement established that identifies the entity responsible for inspection and maintenance.
- Tier 2: Determined from water quality monitoring. See Assessing the performance of iron enhanced sand filter.
The default is no amendment.
Total phosphorus reduction
Annual total phosphorus (TP) reductions were divided into two components: particulate phosphorus (PP) and dissolved phosphorus (DP). Filtering systems were assumed to provide zero DP reduction without the incorporation of iron in the filter media. It was also assumed that of TP, 55 percent is PP and 45 percent is DP. Using these assumptions the TP removal can be described by
\( R_{TP} = 0.55R_{PP} + 0.45R_{DP} \)
where
- R is the removal efficiency for each of the phosphorus constituents.
The removal efficiency for RPP is based on the annual TP reductions provided by each of the filtering BMPs without the inclusion of iron in the filter media. It was assumed that all removal of phosphorus in these systems is provided through the removal of particulate phosphorus. Therefore, the RTP reductions can be converted to RPP using the above equation by setting RDP to 0.
Total P and particulate P removal from BMPs without iron in the filter media.
Link to this table
| BMPs without iron | RTP (%) | RPP (%) |
|---|---|---|
| Stormwater pond | 501 | 65 |
| Sand filter | 451 | 85 |
1 Source (CWP and CSN, 2008)
Once iron is added to the media, RDP, can be broken down into the product of the DP removal effectiveness of iron-enhanced sand and the fraction of the annual runoff that passes through the sand filter. This assumes that the volume of annual runoff that bypasses the sand filter and the BMP through an overflow structure receives no treatment of the dissolved portion of the phosphorus loading. Thus, RDP can be represented by
\(R_{DP} = R_{FE}V_F / V_T\)
where
- RFe is the removal efficiency of an iron-enhanced sand filter (40% or 60% depending on design level);
- VF is the annual volume of runoff filtered, in cubic feet; and
- VT is the total annual volume of runoff, in cubic feet.
The ratio of VF to VT will be called F, which is the fraction of the total annual runoff volume that is filtered by the sand filter. Therefore, the equation for total phosphorus removal can be rewritten as
\(R_{TP} = 0.55R_{PP} + 0.27F\)
To calculate the total phosphorus removal efficiency for each BMP, F, or the fraction of annual runoff that passes through the sand filter, must be calculated. This calculation is made in a two-step process.
- Step 1: Calculate the treatment volume of the BMP based on design parameters. The treatment volume represents the amount of water that the BMP is capable of holding at any one time.
- Step 2: Use modeling results (i.e., from P8 modeling) to convert the treatment volume into a percent annual runoff volume filtered.
The assumption of 55 percent particulate phosphorus and 45 percent dissolved phosphorus is likely inaccurate for certain land uses, such as industrial, transportation, and some commercial areas. Studies indicate particulate phosphorus comprises a greater percent of total phosphorus in these land uses. It may therefore be appropriate to modify the above equation with locally derived ratios for particulate and dissolved phosphorus. For more information on fractionation of phosphorus in stormwater runoff, link here.
Treatment volume calculation
The treatment volumes of the various BMPs are defined as the amount of water that can be stored by the BMP above the filter media at any given time. All of this water is able to pass through and be treated by the filter media. Iron-enhanced sand filters should be designed to drain in 48 hours, so the filter media should be designed to discharge the entire treatment volume below the outflow in no more than 48 hours (24 hours if the BMP drains into a trout stream). The limiting factor in the discharge rate of the sand filter can be the saturated hydraulic conductivity (k) of the sand media, the surface area of the sand filter, or the capacity of the underlying underdrain. The designer must consider these factors when determining the volume of potential treatment. The treatment volume calculations for each of the filter BMPs are described below.
Iron enhanced sand filter basin
The treatment volume capacity of the iron enhanced sand filter basin in given by
\(V_T = D(A_S+A_M) / 2\)
where
- VT is the treatment volume capacity of the sand filter (cubic feet);
- AS is the surface area of the sand filter at the basin overflow (square feet);
- AM is the surface area of filter media (square feet); and
- D is the depth of water between overflow outlet structure and the sand filter media (feet).
Iron enhanced sand filter bench in wet ponds
The treatment volume capacity of the iron enhanced sand filter bench in given by
\(V_T = D_O(A_N+A_O) / 2\)
where
- VT is the treatment volume capacity of the filter bench (cubic feet);
- AN is the surface area of the pond at the normal water level (square feet);
- AO is the surface area of the pond at overflow outlet structure elevation (square feet); and
- DO is the depth of water between the outflow structure elevation and the normal water level (feet).
The designer must make sure that the final treatment volume is able to drain through the filter media and out the underdrain within the required drawdown time. If this criterion is not met, the designer should redesign the system to meet the requirement.
Percent annual runoff volume filtered
Once the treatment volume is calculated for the BMP, this value is converted to the fraction of annual runoff volume treated (F) using the treatment volume capacity (VT) of the iron-enhanced sand filter, tributary watershed size, soils and imperviousness of the watershed. Below is a description of the methods employed to determine the fraction of runoff treated.
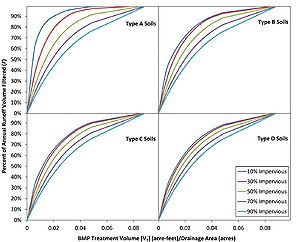
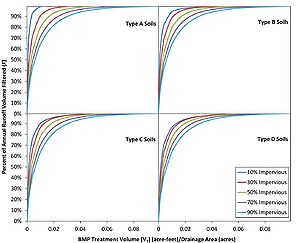
The P8 model was used to calculate runoff from several hypothetical 10‑acre development scenarios with varying levels of imperviousness and different soil types. Twenty hypothetical watersheds were included in the P8 modeling analysis, including type A, B, C and D soils with 10, 20, 50, 70, or 90 percent imperviousness. Through the use of look up tables created from P8 modeling results, treatment volumes were converted into a percent annual volume filtered.
Watershed runoff volumes from pervious areas were computed in P8 using the SCS Curve Number method. Pervious curve numbers were selected for each hypothetical watershed based on soil type and an assumption that the pervious areas within the hypothetical development would be open space areas in fair to good condition. References on SCS curve numbers provide a range of curve numbers that would apply to pervious areas in fair to good condition. Pervious curve numbers of 39, 65, 74, and 80 were used for hydrologic soil groups A, B, C, and D, respectively.
Depression storage represents the initial loss caused by such things as surface ponding, surface wetting, and interception. As previously discussed, the P8 model utilizes the SCS Curve Number method to estimate runoff from pervious areas. For impervious areas, runoff begins once the cumulative storm rainfall exceeds the specified impervious depression storage, with the runoff rate equal to the rainfall intensity. An impervious depression storage value of 0.06 inches was used for the P8 simulation.
The P8 model requires hourly precipitation and daily temperature data; long-term data was used so that watersheds and BMPs can be evaluated for varying hydrologic conditions. The hourly precipitation and average daily temperature data were obtained from the National Weather Service site at the Minneapolis-St. Paul International Airport. The simulation period used for the P8 analysis was January 1, 1955 through December 31, 2004 (50 years).
For the P8 analysis, the 50-year hourly dataset was modified to exclude the July 23-24, 1987 “super storm” event, in which 10 inches of rainfall fell in 6 hours. This storm event was excluded because of its extreme nature and the resulting skew on the pollutant loading and removal predictions. Excluding the July 23-24, 1987 “super storm”, the average annual precipitation throughout the 50-year period used for the P8 modeling was 27.7 inches.
Infiltration basins were used to simulate the amount of water treated by each BMP. Infiltration basins were sized for a range of treatment volumes with depths of 1.5 feet and infiltration rates of 5.3 inches per hour to simulate flow through a sand media as reported by Rawls et al. 1998. Infiltration basins were modeled using each of the drainage characteristic combinations of soils type and impervious surfaces. The final results from the modeling were total runoff volume reductions based on the size of the basin and infiltration rate. This runoff reduction was converted to percent annual reduction based on the total inflow into the system and the total overflow. The percent annual reduction represents the annual percent runoff volume that passes through the BMP and is treated. Modeled results are shown in the figures to the right. The figures can be used to determine the annual runoff volume filters (F) using the BMPs treatment volume (VT):total drainage area ratio. The calculated runoff volume filtered (F) can then be plugged into the equation to calculate RTP. Results are divided by watershed soil type and percent impervious surfaces.
Credit calculation example
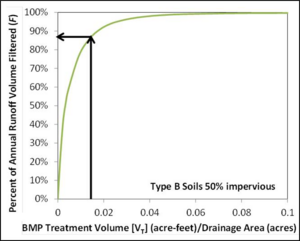
A 2 acre site with 50 percent impervious and hydrologic soil group B soils is routed to an iron-enhanced sand filter basin. The depth between the overflow structure and the sand filter bed (D) is 1.5 feet. The area of the sand filter at the overflow structure (AS) is 1,000 square feet and the surface area of the sand filter (AM) is 800 square feet. VT is calculated to be 1350 cubic feet or 0.031 acre-feet.
\( V_T = 1.5(1000 + 800) / 2 = 1350\)
The ratio between the BMP treatment volume (VT) and the drainage area then becomes 0.0155 feet (1350 ft3/2 acres * 43560 ft2/1 acre). This value can be used for a watershed with HSG B soils and 50 percent impervious to get a percent of annual runoff volume filtered (F) of 88 percent. Using this value in the following equation
\(R_{TP} = 0.55R_{PP} + 0.27F = (0.55)(0.85) + (0.27)(0.88) = 0.71\)
results in an annual TP removal rate (RTP) of 71 percent.
References
- Rawls, W.J., D. Gimenez, and R. Grossman. 1998. Use of Soil Texture, Bulk Density, and Slope of the Water Retention Curve to Predict Saturated Hydraulic Conductivity. Transactions of the ASAE. Vol. 41(4):983-988.
Related pages
- Iron enhanced sand filter
- Overview for iron enhanced sand filter
- Types of iron enhanced sand filter
- Design criteria for iron enhanced sand filter
- Assessing the performance of iron enhanced sand filter
- Operation and maintenance of iron enhanced sand filter
- Calculating credits for iron enhanced sand filter
- References for iron enhanced sand filter
- Supporting material for iron enhanced sand filter
- Calculating credits
- Calculating credits for bioretention
- Calculating credits for infiltration basin
- Calculating credits for infiltration trench
- Calculating credits for permeable pavement
- Calculating credits for green roofs
- Calculating credits for sand filter
- Calculating credits for stormwater ponds
- Calculating credits for stormwater wetlands
- Calculating credits for iron enhanced sand filter
- Calculating credits for swale
- Calculating credits for tree trenches and tree boxes
- Calculating credits for stormwater and rainwater harvest and use/reuse
This page was last edited on 23 December 2022, at 01:28.


