Guidance for calculator to estimate chloride loading to groundwater from infiltration
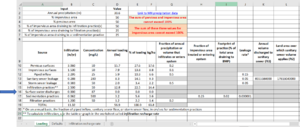
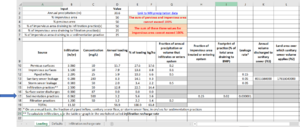
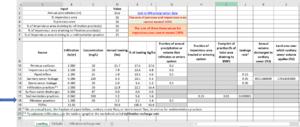
Link to the chloride loading calculator - File:Chloride groundwater loading calculator.xlsx
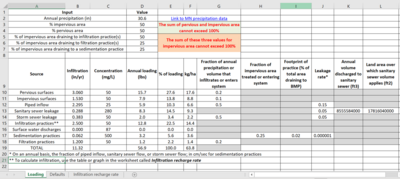
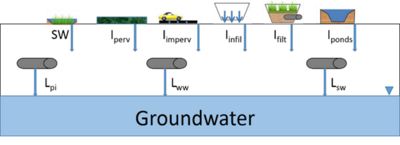
This page provides guidance for using an Excel spreadsheet designed to estimate chloride loading to shallow groundwater from nine different sources. The calculator allows the user to adjust inputs for each source and produces an estimate, in pounds per acre or kilograms per hectare, from each source and cumulatively for all sources. The nine sources, described in greater detail below, include the following.
- Infiltration through pervious surfaces
- Infiltration through impervious surfaces
- Leakage from water supply infrastructure, called piped inflow in the calculator
- Leakage from the sanitary sewer system
- Leakage from the storm sewer system
- Infiltration from stormwater infiltration practices
- Contributions from surface water
- Seepage from constructed stormwater ponds
- Infiltration from stormwater filtration practices
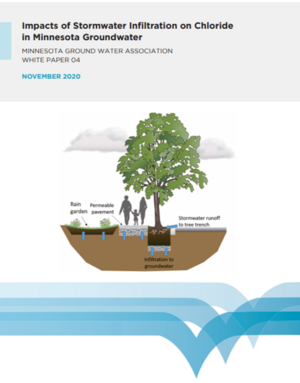
The Excel spreadsheet was developed to accompany a white paper prepared for the Minnesota Groundwater Association on the effects of stormwater infiltration on chloride loading to groundwater. The white paper is titled Impacts of Stormwater Infiltration on Chloride in Minnesota Groundwater. The white paper provides additional information on the nine sources of chloride loading mentioned above, including a literature review that provides information needed to estimate annual chloride loads to groundwater. The reader should consult the white paper for additional information regarding loading from these nine sources.
This page provides guidance on using the spreadsheet. The spreadsheet is designed as a predictive tool and should not be used to specifically quantify chloride loads to groundwater unless detailed information exists for the inputs in the spreadsheet.
Contents
- 1 General information and limitations of the calculator
- 2 Structure of the spreadsheet
- 2.1 Rows 1-7: General inputs
- 2.2 Accounting for impervious, pervious, and surface water
- 2.3 Row 10: Loading from pervious surfaces
- 2.4 Row 11: Loading from impervious surfaces
- 2.5 Row 12: Loading from piped inflow
- 2.6 Row 13: Loading from sanitary sewer leakage
- 2.7 Row 14: Loading from storm sewer leakage
- 2.8 Row 15: Loading from stormwater infiltration practices
- 2.9 Row 16: Loading from surface water discharges
- 2.10 Row 17: Loading from sedimentation practices
- 2.11 Row 18: Loading from filtration practices
- 3 Examples
General information and limitations of the calculator
The user should be aware of the following.
- When you open the calculator there are default values for all inputs. Each of these inputs must be evaluated for the conditions being considered.
- The spreadsheet does not contain protected cells. Consequently, it is possible to delete formulas and default values. There is a protected worksheet providing a summary of the default formulas and inputs in case the user changes a default value and wishes to refer to the original value.
- All calculations in the spreadsheet are made on a 1 acre basis. This is why the spreadsheet includes fractions or percentages rather than areas. Inputting areas into cells will invalidate the results.
Structure of the spreadsheet
Rows 1-7: General inputs
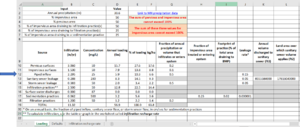
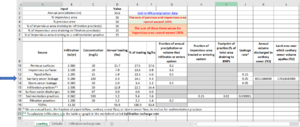
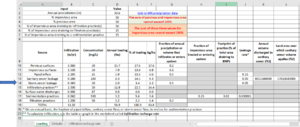
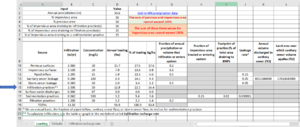
Cells A1 through D7 are for general inputs into the calculator.
- Row A: Headers for the inputs
- Row B: Annual precipitation, in inches. The user inputs annual precipitation in Cell D2. Cell E2 contains a link to precipitation data for select Minnesota cities. The default is 30.6 inches, corresponding to annual precipitation at the Minneapolis-St. Paul International airport at the time the spreadsheet was created.
- Row C: Percent of the area over which loading is being calculated that is impervious. The user enters impervious area, as a percent of the total area, in cell C4. This represents total impervious area (i.e. directly connected and disconnected impervious area) such as streets, sidewalks, parking lots, roofs, and so on. It includes pervious areas that are part of a stormwater treatment practice (e.g. swales and filter strips). It does not include compacted pervious areas. The value may range from 0 (no impervious surface) to 100 (the entire area consists of impervious surface).
- Row D: Percent of the area over which loading is being calculated that is pervious. The user enters pervious area, as a percent of the total area, in cell D4. This represents total pervious area, including lawns, gardens, wooded areas, cropped areas, etc. It does not include pervious portions of stormwater practices such as swales, filter strips, and bioretention practices as these areas are included in the impervious area draining to the stormwater practice. The estimate of pervious area does not consider the condition of the pervious area (e.g. compacted) or the underlying soil (e.g. sand, clay, etc.). The value may range from 0 (no pervious surface) to 100 (the entire area consists of pervious surface).
- Row E: Percent of the impervious area draining to infiltration practice(s). Infiltration practices are practices with no underdrain and that are designed to capture and infiltrate a specified amount of stormwater runoff. The user enters the value in cell E4. The value may range from 0 (no infiltration practices) to 100 (all runoff from impervious surfaces drains to infiltration practices).
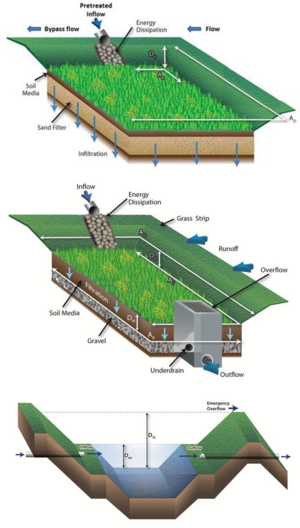
- Row F: Percent of the impervious area draining to filtration practice(s). Filtration practices include practices having an underdrain, filter strips not designed for infiltration, and swales not designed for infiltration. The user enters the value in cell F4. The value may range from 0 (no filtration practices) to 100 (all runoff from impervious surfaces drains to filtration practices).
- Row G: Percent of impervious area draining to a sedimentation practice. Sedimentation practices include constructed stormwater ponds and constructed stormwater wetlands. They do not include proprietary practices that settles solids, such as hydrodynamic devices and sumps. The value may range from 0 (no sedimentation practices) to 100 (all runoff from impervious surfaces drains to sedimentation practices).
The following conditions apply to the inputs in these cells.
- The sum of impervious and pervious surface cannot exceed 100 percent.
- If surface water is included in the loading calculation, the percent area covered by surface water must be subtracted from the sum of pervious and impervious surface. For example, if a lake covers 10 percent of the area being considered, the pervious and impervious surface together must comprise 90 percent of the area.
- The sum of pervious surface, impervious surface, and surface water must equal 100 percent.
- The sum of the impervious area draining to infiltration, filtration, and sedimentation practices cannot exceed 100 percent.
Accounting for impervious, pervious, and surface water
Deciding if an area is impervious, pervious, or surface water is not always clear in more complicated runoff routing scenarios. Below are some recommendations, but the user will have to decide the appropriate accounting.
- Impervious surface is routed to a pervious surface not specifically designed as a stormwater treatment practice. An example is roof runoff routed to a lawn or garden. The recommendation is to consider the impervious and pervious surfaces as impervious surface being routed to a filtration practice.
- Impervious surfaces routed directly to surface water. If there is leakage through the bottom and sides of the surface water body, assume the water body acts like a sedimentation practice and include it in the calculations for sedimentation practices. If the water body does not interact with groundwater, do not include the area draining to the water body in the calculations.
- Include the area of a stormwater practice in the impervious area draining to the practice. For example, if 1 acre of impervious surface drains to a bioretention practice, and the area of the bioretention practice is 5000 ft2, the impervious area draining to the practice is 1 acre plus 5000 ft2, or 48560 ft2.
Row 10: Loading from pervious surfaces
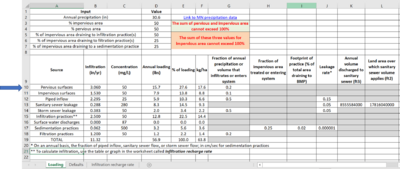
This term includes chloride loading from areas such as lawns, gardens, wooded areas, and cropped areas that do not receive runoff from impervious surfaces. It does not include loading from pervious areas in stormwater practices, such as a swale of filter strip.
Cell B10 has a default formula for estimating annual recharge, in inches, through pervious surfaces. Recharge, Rpervious, is given by
Rpervious=P∗FPp
where
- P = annual precipitation (inches) and
- FPp = is the fraction of annual precipitation falling on pervious surfaces that infiltrates through the soil, vadose zone, and into groundwater.
The default for FPp in cell G10 is 0.2 (i.e. 20% of annual precipitation falling on pervious surfaces recharges groundwater). The user may change the value for FPp. Recharge, calculated in cell B10, is given by
cellD4∗0.01∗cellG10∗D2
where the 0.01 corrects for cell D4 (percent pervious) being expressed as a percent and cell D2 is precipitation (P).
FPp is often known. For example, USGS studies often publish this information as part of hydrologic studies in a watershed. If annual recharge through pervious surfaces is known, it may be input directly into cell B10.
The default chloride concentration in recharge water is 50 mg/L. This is based on monitoring data collected by the Minnesota Pollution Control Agency from shallow groundwater in urban areas. The user can adjust this value based on local data. For example, concentrations may be higher in high volume transportation areas and lower in park areas where deicer is not applied.
Row 11: Loading from impervious surfaces
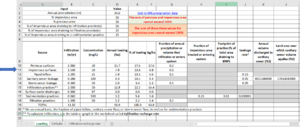
There is always some infiltration through areas considered to be impervious. This is due to cracks or other conduits through which water can move vertically into the underlying soil. The calculation for annual recharge, in inches, is the same as for pervious surfaces. This calculation is in Cell B11. Recharge, Rimpervious in inches per year, is given by
Rimpervious=P∗FPi
where
- P = annual precipitation (inches) and
- FPi = is the fraction of annual precipitation that infiltrates through impervious surfaces.
The default for FPi in cell G10 is 0.10. The user may change the value for FPi. Recharge, calculated in cell B11, is given by
cellD4∗0.01∗G11∗D2
where the 0.01 corrects for cell D4 (percent pervious) being expressed as a percent and cell D2 is annual precipitation (P).
Infiltration through impervious surfaces decreases the amount of runoff from impervious surfaces. If FPi is small, the user may choose to not correct for this decrease in impervious surface runoff. However, as FPi increases, users should subtract the fraction (i.e. percent) of impervious surface in cell D3 and cells D5 through D7, as appropriate.
Row 12: Loading from piped inflow
This input includes leakage from water distribution systems. There is always some leakage from these systems since they are under pressure.
The default annual infiltration rate (Rpiped) is based on the following equation
Rpiped=P∗Fprecipitation∗Lpiped
where
- P is the annual precipitation (inches),
- Fprecipitation is the fraction of precipitation volume that is piped to the area being considered, and
- Lpiped is the leakage rate from the piped infrastructure, as a fraction of total piped inflow.
The term Fprecipitation is used because most literature expresses the volume of piped inflow as a percentage of precipitation. For example, studies suggest that a typical volume of piped inflow is about 50% the value of annual precipitation volume. Leakage represents an annual average value. For example, if 15% of the annual piped inflow is lost through leakage, the value for F is 0.15. The terms Fprecipitation and L are thus unitless.
Alternatively, if the user knows the annual volume of piped inflow and the area over which the piped infrastructure exists, the following equation can be substituted in cell B12
Rpiped=Vpiped∗Apiped∗Lpiped
where
- Vpiped is the annual volume of piped inflow in ft3 and
- Apiped is the area over which the piped infrastructure exists, in ft2.
For example, if the leakage rate is 0.15, the annual piped inflow is 1000 ft3, and the area with piped inflow is 100 ft2, the annual recharge rate (Rpiped) equals 0.15 * 1000 / 10 or 1.5 inches per year.
Row 13: Loading from sanitary sewer leakage
This input includes leakage from sanitary sewer infrastructure. There is always some leakage from these systems, particularly in older systems. Leakage rates can be relatively low for newer systems, well maintained systems, and when there is groundwater inflow into the system. The default value in cell B13 for annual recharge, Rsanitary, in inches, is given by
Rsanitary=Vsanitary∗Asanitary∗Lsanitary
where
- Vsanitary is the annual volume, in ft3, transported in the sanitary sewer system, excluding any groundwater inflow or other significant sources other than sewerage,
- Asanitary is the land area, in ft2 over which the sanitary sewer system exists (i.e. the area over which leakage occurs), and
- Lsanitary is the fraction of annual volume that leaks.
The default values for these are based on data obtained from the Metropolitan Council and therefore apply to the Twin Cities Metro Area. Users may enter different values for these inputs or input a recharge value in cell B13. Replacing the defaults will delete the original values.
The default chloride concentration, cell C13, is 280 mg/L, which is based on data for the Twin Cities Metro Area. The user can change this value if local data exist.
Row 14: Loading from storm sewer leakage
This input includes leakage from storm sewer infrastructure. There is always some leakage from these systems, particularly in older systems. Leakage rates can be relatively low for newer systems, well maintained systems, and when there is groundwater inflow into the system. The default value in cell B14 for annual recharge, Rstormsewer, in inches, is given by
Rstormsewer=Fprecipitation∗P∗Lstormsewer
where
- Fprecipitation is the fraction of annual precipitation that enters the storm sewer system,
- P is annual precipitation, in inches, and
- Lstormsewer is the fraction of annual volume in the storm sewer system that leaks out.
The fraction of annual precipitation that enters the storm sewer system, Fprecipitation, can be approximated as the percent of impervious surface that is not infiltrated. For example, if an area has 50 percent impervious surface and half of this drains to infiltration practices, Fprecipitation is 0.25 (i.e. 0.5 X 0.5). This is an approximation, since some volume is lost to infiltration through filtration practices and sedimentation practices. If the leakage rate is 0.05 or less, correcting for these volume losses is probably unnecessary. However, if the leakage rate is higher and filtration practices capture a large percentage of annual runoff, the user should consider correcting for the volume lost to infiltration from filtration practices. For example, if runoff from an area that is 80 percent impervious is all treated by filtration practices, Fprecipitation would be estimated to be 0.64 since 80 percent of the runoff is captured by filtration practices and 80 percent of this treated water is routed back to the storm sewer system (i.e. 20 percent of captured water infiltrates; 0.64 = 0.8 X 0.8).
The user may change the default values for leakage and the fraction of annual precipitation that enters the storm sewer system. The user may also input a recharge value directly into cell B14. Changing the defaults will delete the default values or formulas.
The default chloride concentration in cell C14 is 50 mg/L. The user may change this value.
Row 15: Loading from stormwater infiltration practices
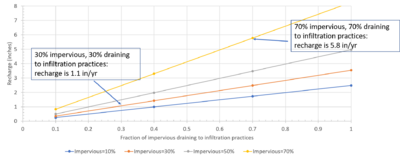
The spreadsheet was designed to estimate the contribution from this term, which includes chloride loading from stormwater infiltration practices. There are no calculations involved in this input. The user can determine the recharge value from tabled or graphical values in the spreadsheet called Infiltration recharge rate, or the user may enter data available locally. To determine the value from tabled or graphical values in the spreadsheet, the user must know the percent impervious surface and the fraction of impervious surface draining to infiltration practices. An example is shown in the adjacent figure for two situations.
- 30 percent impervious and 30 percent draining to infiltration practices, giving a recharge rate of about 1.1 inches per year
- 70 percent impervious and 70 percent draining to infiltration practices, giving a recharge rate of about 5.8 inches per year
Note that the 10 of annual runoff bypassing infiltration practices is not routed back to the storm sewer system. This runoff would contribute to leakage from the storm sewer system. However, as stated above, this is likely to be insignificant if leakage rates from storm sewer systems is 0.05 or less. The user may choose to correct for this in the storm sewer leakage term.
The default chloride concentration in cell C15 is 50 mg/L. The user may change this value.
Row 16: Loading from surface water discharges
Loading from surface water occurs only if there is leakage from the surface water to underlying groundwater or if groundwater passes through a surface water having significantly higher chloride concentrations than in groundwater. We assume inputs from surface waters were 0 since these two conditions are not common and because surface water generally comprises a small percent of the land area. The user can input values in cells B16 and C16 if desired. However, in a case where surface water is leaking to groundwater, we recommend the surface water be included in the calculations for sedimentation practices since the surface water acts like a sedimentation practice, capturing stormwater runoff and slowly leaking some volume to underlying groundwater.
Row 17: Loading from sedimentation practices
Sedimentation practices primarily consist of ponds constructed to capture and treat stormwater runoff, but they may include constructed wetlands and natural water bodies that act as sedimentation practices. There is always leakage from these practices. Annual recharge, Rsedimentation in inches, is given by
Rsedimentation=Fimpervious∗Pfootprint∗Lpond
where
- Fimpervious is the fraction of impervious area draining to the sedimentation practices,
- Pfootprint is the area of the sedimentation practices divided by the area of impervious surface draining to the pond (i.e. the fraction of fraction of Fimpervious taken up by the sedimentation practices), and
- Lpond is the leakage or seepage rate, in centimeters per second, through the sedimentation practices.
Note the calculation in cell B17 converts the units for leakage into inches per year. Default values are 0.25 for Fimpervious, 0.02 for Pfootprint, and 0.000001 cm/s for Lpond. The value of 0.02 for Pfootprint is a recommended value for pond design. The leakage rate is typical of sedimentation practices. Note that the calculation is very sensitive to the leakage rate (e.g. a leakage rate of 0.0000001 cm/s would decrease chloride loading by an order of magnitude).
Users may change any of the inputs or enter a recharge value directly in cell B17. These would delete default values.
The default chloride concentration is 500 mg/L. This is based on literature values from urban areas. Chloride tends to accumulate at the bottom of basins, leading to elevated concentrations at the basin bottom.
Row 18: Loading from filtration practices

Although filtration practices such as bioretention, sand filters, filter strips, and swales are not designed to infiltrate water, there is always some infiltration in these practices. As with infiltration practices, the user can determine the recharge value from tabled or graphical values in the spreadsheet called Infiltration recharge rate. This value is then adjusted in cell D18 for the actual infiltration by multiplying the recharge value in cell B18 by the fraction of water that infiltrates (cell G18). To determine the value for cell B18 from tabled or graphical values in the spreadsheet, the user must know the percent impervious surface and the fraction of impervious surface draining to filtration practices. An example is shown in the adjacent figure for two situations.
- 30 percent impervious and 30 percent draining to filtration practices, giving a recharge rate of about 1.1 inches per year
- 70 percent impervious and 70 percent draining to filtration practices, giving a recharge rate of about 5.8 inches per year
The value in cell G18 varies significantly depending on the type of practice. The default value is 0.2, which represents estimated infiltration below a bioretention practice. This value is much lower for other filtration practices. We recommend values of 0.10 for swales and vegetated filter strips, and 0.0 for sand filters. If there are multiple types of filtration practices in the area of concern, an average infiltration fraction can be calculated based on the distribution of these types of practices. For example, if filtration practices include equal areas treated by biofiltration, swales, and sand filters, the infiltration fraction would be 0.1 ((0.2 + 0.1 + 0.0)/3).
The default chloride concentration is 50 mg/L.
Examples
Below are three examples for using the chloride loading spreadsheet.
Example 1
Assume default inputs are correct with the following exceptions.
- 30 percent impervious
- 70 percent pervious
- 25 percent of the area drains to infiltration practices and 75 percent drains to filtration practices
The user changes the following values in the spreadsheet.
- Cell D3, percent impervious - enter 30; Cell D4 autofills to 70
- Cell D5, percent impervious draining to infiltration practices - enter 25
- Cell D6, percent impervious draining to filtration practices - enter 75
- Cell D7, percent impervious draining to sedimentation practices - enter 0
The user must determine the recharge rate for infiltration practices (cell B15) and filtration practices (cell B18). Using the graph in the worksheet Infiltration recharge rate, the following values are determined.
- 0.9 in/yr for infiltration practices
- 2.7 in/yr for filtration practices
Example 2
Example 3
This page was last edited on 17 January 2023, at 15:20.
