Guidance for calculator to estimate chloride loading to groundwater from infiltration

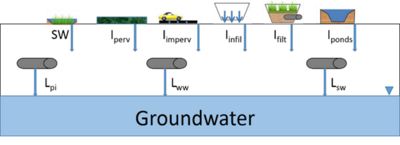
This page provides guidance for using an Excel spreadsheet designed to estimate contributions of chloride to shallow groundwater from nine different sources. The calculator allows the user to adjust inputs for each source and produces an estimate, in pounds per acre or kilograms per hectare, from each source and cumulatively for all sources. The nine sources, described in greater detail below, include the following.
- Infiltration through pervious surfaces
- Infiltration through impervious surfaces
- Leakage from water supply infrastructure, called piped inflow in the calculator
- Leakage from the sanitary sewer system
- Leakage from the storm sewer system
- Infiltration from stormwater infiltration practices
- Contributions from surface water
- Seepage from constructed stormwater ponds
- Infiltration from stormwater filtration practices
Contents
General information and limitations of the calculator
Before using the calculator, we strongly recommend reading the following.
- When you open the calculator there are default values for all inputs. Each of these inputs must be evaluated for the conditions being considered.
- The spreadsheet does not contain protected cells. Consequently, it is possible to delete formulas and default values.
- An accompanying report called Impacts of stormwater infiltration on chloride in Minnesota groundwater provides detailed discussion and literature used to develop this calculator.
Structure of the spreadsheet
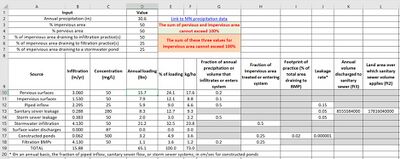
Rows 1-7: General inputs
Cells A1 through D7 are for general inputs into the calculator.
- Row A: Headers for the inputs
- Row B: Annual precipitation, in inches. The user inputs annual precipitation in Cell D2. Cell E2 contains a link to precipitation data for select Minnesota cities. The default is 30.6 inches, corresponding to annual precipitation at the Minneapolis-St. Paul International airport at the time the spreadsheet was created.
- Row C: Percent of the area over which loading is being calculated that is impervious. The user enters impervious area, as a percent of the total area, in cell C4. Note this represents total impervious area (i.e. directly connected and disconnected impervious area) such as streets, sidewalks, parking lots, roofs, and so on. It does not include compacted pervious areas. The value may range from 0 (no impervious surface) to 100 (the entire area consists of impervious surface).
- Row D: Percent of the area over which loading is being calculated that is pervious. The user enters pervious area, as a percent of the total area, in cell D4. Note this represents total pervious area, including lawns, gardens, stormwater practices such as swales and bioretention, forested areas, etc. This does not consider the condition of the pervious area (e.g. compacted) or the underlying soil (e.g. sand, clay, etc.). The value may range from 0 (no pervious surface) to 100 (the entire area consists of pervious surface).
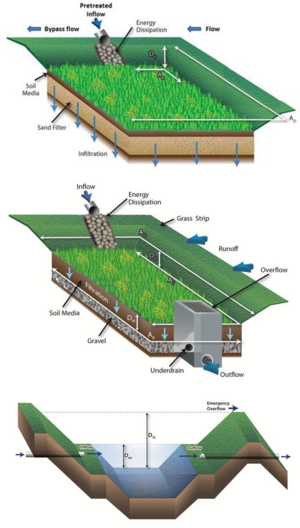
- Row E: Percent of the impervious area draining to infiltration practice(s). Infiltration practices are practices with no underdrain and that are designed to capture and infiltrate a specified amount of stormwater runoff. The user enters the value in cell E4. The value may range from 0 (no infiltration practices) to 100 (all runoff from impervious surfaces drains to infiltration practices).
- Row F: Percent of the impervious area draining to filtration practice(s). Filtration practices include practices having an underdrain, filter strips not designed for infiltration, and swales not designed for infiltration. The user enters the value in cell F4. The value may range from 0 (no filtration practices) to 100 (all runoff from impervious surfaces drains to filtration practices).
- Row G: Percent of impervious area draining to a sedimentation practice. Sedimentation practices include constructed stormwater ponds and constructed stormwater wetlands. They do not include proprietary practices that settles solids, such as hydrodynamic devices and sumps. The value may range from 0 (no sedimentation practices) to 100 (all runoff from impervious surfaces drains to sedimentation practices).
The following conditions apply to the inputs in these cells.
- The sum of impervious and pervious surface cannot exceed 100 percent.
- If surface water is included in the loading calculation, the percent area covered by surface water must be subtracted from the sum of pervious and impervious surface. For example, if a lake covers 10 percent of the area being considered, the pervious and impervious surface together must comprise 90 percent of the area.
- The sum of pervious surface, impervious surface, and surface water must equal 100 percent.
- The sum of the impervious area draining to infiltration, filtration, and sedimentation practices cannot exceed 100 percent.
- If surface water is included in the loading calculation, the percent area covered by surface water must be subtracted from the sum of impervious area draining to infiltration, filtration, and sedimentation practices. The sum of the impervious area draining to surface water, infiltration, filtration, and sedimentation practices must equal 100 percent.
Row 10: Loading from pervious surfaces
This term includes chloride loading from areas such as lawns, gardens, wooded areas, and cropped areas. It does not include loading from pervious areas in stormwater practices, such as a swale of filter strip.
Cell B10 has a default formula for estimating annual recharge, in inches, through pervious surfaces. Recharge, R, is given by
\( R_{pervious} = P * F_P \)
where
- P = annual precipitation (inches) and
FP = is the fraction of annual precipitation that infiltrates through the soil, vadose zone, and into groundwater.
The default for FP in cell G10 is 0.2 based on a literature review. The user may change the value for FP. Recharge, calculated in cell B10, equals cellD4*0.01*G10*D2, where the 0.01 corrects for cell D4 (percent pervious) being expressed as a percent and cell D2 is P.
FP is often known for an area. For example, USGS studies often publish this information as part of hydrologic studies in a watershed. If annual recharge through pervious surfaces is known, it may be input directly into cell B10. Note that substituting a value in cell B10 erases the formula.
Row 11: Impervious surfaces
Row 12: Piped inflow
This input includes leakage from water distribution systems. There is always some leakage from these systems since they are under pressure.
The default annual infiltration rate (I) is based on the following equation
\( I = P * F_{precipitation} * L \)
where
- P is the annual precipitation (inches),
- Fprecipitation is the fraction of precipitation volume that is piped to the area being considered, and
L is the leakage rate from the piped infrastructure, as a fraction of total piped inflow.
The term Fprecipitation is used because most literature expresses the volume of piped inflow as a percentage of precipitation. For example, studies suggest that a typical volume of piped inflow is about 50% the value of annual precipitation volume. Leakage represents an annual average value. For example, if 15% of the annual piped inflow is lost through leakage, the value for F is 0.15. The terms Fprecipitation and L are thus unitless.
Users who have data for the volume of piped inflow should use that data. In this case, the formula in cell B12 would be rewritten as L times the annual volume of piped inflow divided by the area with piped inflow. For example, if the leakage rate is 0.15 the annual piped inflow is 1000 ft3, and the area with piped inflow is 100 ft2, the annual infiltration rate (I) equals 0.15 * 1000 / 10 or 1.5 inches per year.

