![]()
Requirements, recommendations and information for using bioretention with an underdrain BMPs in the MIDS calculator


For a bioretention (aka biofiltration) BMP with an underdrain at the bottom of the engineered media, most of the stormwater captured by the BMP is filtered and lost to the underdrain. However, some stormwater infiltrates through the basin bottom and sidewalls if these do not have an impermeable liner. Volume retention also occurs by evapotranspiration through the vegetation in the biofiltration BMP. For biofiltration systems with an elevated underdrain, additional volume retention is achieved through infiltration of water stored in the pore spaces of the engineered media between the underdrain invert and the native soils. All pollutants in infiltrated water are credited as being removed, while a portion of the pollutant loads in the stormwater that flows through the underdrain are removed through filtration.
NOTE: A bioretention device with an installed underdrain is a type of biofiltration device, since some portion of the treated water is filtered and discharged downstream rather than infiltrated. MPCA believes that biofiltration is the more generally applicable term for this BMP type; but the reader will currently find both of these terms on relevant pages, due to MPCA's understanding that a variety of terms are currently common in stormwater management.
Contents
- 1 Version 4 changes
- 2 Model input requirements and recommendations
- 3 Methodology
- 3.1 Required treatment volume
- 3.2 Volume reduction
- 3.2.1 Volume reduction from infiltration
- 3.2.1.1 Underdrain located at bottom of engineered media: Volume reduction from basin bottom infiltration (Vinfb)
- 3.2.1.2 Elevated underdrain: Volume reduction stored below the underdrain
- 3.2.1.3 Volume reduction from basin sides infiltration (Vinfs): underdrain elevated or at bottom of engineered media
- 3.2.2 Volume reduction from evapotranspiration (ET)
- 3.2.3 Comparison of volume reduction capacity with volume performance goal
- 3.2.1 Volume reduction from infiltration
- 3.3 Pollutant reduction
- 4 Routing
- 5 Assumptions for biofiltration basin with underdrain
- 6 Biofiltration Basin with an elevated underdrain example
- 7 Requirements
- 8 Recommendations
- 9 Information
- 10 Links to MIDS pages
- 11 Related pages
Version 4 changes
- The USER must enter a bypass percent for this BMP. See the guidance for determining bypass percent.
- The question Is a soil amendment used to attenuate phosphorus? was changed to Do you have a properly designed phosphorus treatment layer or area in your system (e.g. iron enhanced layer)?. Currently, the only option for incorporating an amendment to retain phosphorus is to install a treatment layer below the bioretention media. This typically is a layer containing 5-8 percent iron (link here for more information on iron-enhanced systems). Research is currently being done to determine if amendments can be incorporated directly into the bioretention media.
- When an amendment is added to the practice, the particulate phosphorus removal was changed from 0 to 40 percent. This was error in previous versions of the calculator.
MIDS calculator user inputs for biofiltration basin (with underdrain)
For a biofiltration with underdrain system, the user must input the following parameters to calculate the volume and pollutant load reductions associated with the BMP.
- Watershed tab:
- BMP Name: this cell is auto-filled but can be changed by the user.
- Routing/downstream BMP: if this BMP is part of a treatment train and water is being routed from this BMP to another BMP, the user selects the name of the BMP to which water is being routed from the dropdown box. All water must be routed to a single downstream BMP. Note that the user must include the BMP receiving the routed water in the Schematic or the BMP will not appear in the dropdown box.
- BMP Watershed Area: BMP watershed areas are the areas draining directly to the BMP. Values can be added for four soil types (Hydrologic Soil Groups (HSG) A, B, C, D) and for three Land Cover types (Forest/Open Space, Managed Turf, and Impervious). The surface area of the BMP should be included as a managed turf land cover of the hydrologic soil type of the native soils that are located under the BMP. Units are in acres.
- BMP Parameters tab:
- Is the underdrain elevated above native soils?: This is a YES/NO question. Answering YES means the underdrain is elevated within the media (i.e., Biofiltration with a raised underdrain). This creates storage capacity between the underdrain and the native soils. Answering NO means that the underdrain is not elevated within the media and is directly above the native soils with no storage capacity below the underdrain (i.e., Biofiltration with underdrain at the bottom).
- Are the sides of the basin lined with an impermeable liner?: This is a YES/NO question. Answering YES means the sides of the basin are lined, preventing water from infiltrating into the native soils. Answering NO means the sides are not lined and infiltration is allowed through the side of the basin into the native soils.
- Is the bottom of the basin lined with an impermeable liner?: This is a YES/NO question. Answering YES means the bottom of the basin is lined, preventing water from infiltrating into the native soils. Answering NO means the bottom is not lined and infiltration is allowed through the bottom of the basin into the native soils.
- Surface area at overflow (AO): This is the surface area of the BMP at the lowest outlet point of the surface overflow from the ponding area of the BMP. Units are in square feet.
- Media surface area (AM): This is the surface area at the bottom of the ponded water within the BMP. This is therefore the area at the surface of the engineered media. Units are in square feet.
- Surface area at underdrain (AU): This is the surface area of the BMP at the invert elevation of the underdrain. If the response to "Is the underdrain elevated above native soils?" is set to NO, then this cell will become inactive and populated with the Bottom surface area value. Units are in square feet.
- Bottom surface area (AB): This is the surface area at the bottom of the engineered media. It represents the area where the engineered media changes to native soils. Units are in square feet
- Overflow depth (DO): This is the maximum depth of ponded water within the BMP (i.e., vertical distance from the overflow elevation to the top of the soil or media). Units are in feet. The maximum allowable depth is 1.5 feet.
- Total media depth (DM): This is the depth of the engineered media between the media surface and the native soils. Units are in feet.
- Depth below underdrain (DU): This is the depth of the media between the underdrain invert and the native soils. If the response to "Is the underdrain elevated above native soils?" is set to NO, then this cell will become inactive and populated with a 0. Units are in feet.
- Media field capacity minus wilting point (FC-WP): This is the amount of water between field capacity and the permanent wilting point stored in the media above the underdrain. This is water often considered to be available for uptake by plants. If multiple types of media are used in the BMP, this value should be a weighted average of the soil water storage values of the media installed above the underdrain. Values for field capacity and wilting point based on soil type can be found here. Units are in cubic feet of water per cubic feet of media. The recommended range for this value is 0.05 to 0.17.
- Media porosity minus field capacity (n - FC) - This is the amount of water between media porosity and field capacity stored in the media between the underdrain invert and the bottom of the media (top of native soil). If multiple types of media are used in the BMP, this value should be a weighted average of the soil water storage values of the media installed between the underdrain and the native soils. Values for porosity and field capacity based on soil type can be found here. Units are in cubic feet of pore space per cubic feet of media. The recommended range for this value is 0.15 to 0.35.
- Is a tree(s) planted in the BMP?: This is a YES/NO question. If trees are planted within the biofiltration basin then additional volume loss associated with evapotranspiration will be applied.
- Bioretention planting media mix: The user selects the type of media mix installed for planting from a predefined list of media mixes: Media mix A (water quality blend), Media mix B (enhanced filtration blend), Media mix C (North Carolina State University water quality blend), Media mix D, or Other. This value is used to determine the annual phosphorus load reduction credit.
- Is the P content of the media less than 30 mg/kg?: This is a YES/NO question. The P content of the planting media should be tested using the Mehlich 3 test or an acceptable alternative method. Select YES if the P content of the planting media is less than 30 milligrams per kilogram and NO if it is greater. P content testing is not needed for planting media C or D; therefore, this item will automatically populate to YES if one of those two media types are selected. This value is used to determine the annual phosphorus load reduction credit.
- Do you have a properly designed phosphorus treatment layer or area in your system (e.g. iron enhanced layer)?: This is a YES/NO question. Answer YES if the bioretention filter media contains soil amendments to enhance phosphorus sorption and NO if amendments are not used. This value is used to determine the annual phosphorus load reduction credit.
- Underlying soil - Hydrologic Soil Group: The user selects the most restrictive soil (lowest hydraulic conductivity) within the 5 feet below the media/native soil interface of the biofiltration basin. There are 14 soil options that fall into 4 different Hydrologic Soil Groups (Hydrologic Soil Group (HSG) A, B, C, or D) for the user. Once a soil type is selected, the corresponding infiltration rate will populate the Infiltration rate of underlying soils field. The user may also select User Defined. This selection will activate the User Defined Infiltration Rate cell, allowing the user to enter a different value from those in the predefined selection list. The maximum allowable infiltration rate is 1.63 inches per hour.
- Required drawdown time: This is the time in which the stormwater captured by and ponded within the BMP must drain into the underlying soil and/or flow through the underdrain. The user must select from predefined values of 48 or 24 hours. The MPCA Construction Stormwater General Permit requires drawdown within 48 hours, but 24 hours is Highly Recommended when discharges are to a trout stream. The calculator uses the underlying soil infiltration rate and the Depth below underdrain (DU) to check if the BMP is meeting the drawdown time requirement. The user will encounter an error and be required to enter a new Depth below underdrain (DU) if the stormwater stored in the BMP cannot drawdown in the required time. Note that the upper limit of 1.5 feet set for the Overflow depth (DO) also serves to ensure that the required drawdown time is met.
- BMP Summary tab: The BMP Summary tab summarizes the volume and pollutant reductions provided by the specific BMP. It details the performance goal volume reductions and annual average volume, dissolved P, particulate P, and TSS load reductions. Included in the summary are the total volume and pollutant loads received by the BMP from its direct watershed, from upstream BMPs and a combined value of the two. Also included in the summary are the volume and pollutant load reductions provided by the BMP, along with the volume and pollutant loads that exit the BMP through the outflow. This outflow load and volume is what is routed to the downstream BMP, if one is defined in the Watershed tab. Finally, percent reductions are provided for the percent of the performance goal achieved, percent annual runoff volume retained, total percent annual particulate phosphorus reduction, total percent annual dissolved phosphorus reduction, total percent annual TP reduction, and total percent annual TSS reduction.
Model input requirements and recommendations
If the following requirements for inputs into the MIDS calculator are not met, then an error message will inform the user to change the input to meet the requirement.
- Overflow depth (DO) cannot be greater than 1.5 feet
- Surface areas must be equal to or less than all surface areas at higher elevations
- The Depth below underdrain (DU) cannot be greater than the Total media depth (DM)
- Infiltration rate of underlying soils cannot exceed 1.63 inches per hour
- If the user enters a value for field capacity minus wilting point (FC-WP) or porosity minus field capacity (n-FC) outside the recommended range a warning will appear. The user will not be required to enter a new value.
- The water below the underdrain must meet the user-specifed drawdown time requirement. The drawdown time requirement is checked by comparing the specified drawdown time with the calculated drawdown time (DDTcalc), given by
\(DDT_{calc}=D_U / (I_R / 12)\)
Where
- DU is the depth below the underdrain (ft); and
- IR is the infiltration rate of the native soils (in/hr).
If DDTcalc is greater than the user-specified required drawdown time then the user will be prompted to enter a new depth below the underdrain or infiltration rate of the native soils.
Methodology
Required treatment volume
Required treatment volume, or the volume of stormwater runoff delivered to the BMP, equals the performance goal (1.1 inches for MIDS or user-specified performance goal) times the impervious area draining to the BMP plus any water routed to the BMP from an upstream BMP. This stormwater is delivered to the BMP instantaneously.
Volume reduction
The total estimated Volume reduction capacity of BMP [V] is the sum of infiltration and ET occurring in the biofiltration BMP, and is calculated with user-provided inputs. For this BMP, the location of the underdrain determines how the infiltration component is calculated. If the underdrain is located at the bottom of the BMP, then the infiltration credit is based on infiltration into the bottom of the BMP (Vinfb) and into side slopes of the BMP above the underdrain (Vinfs). In contrast, if the underdrain is elevated above the bottom of the BMP, then the infiltration credit is based on the volume capacity of the bioretention base (VBB) between the underdrain and the native soils, and infiltration into the side slopes of the BMP above the underdrain (Vinfs). Both types of underdrain configurations can receive credit for ET in the media above the underdrain (VET). A biofiltration system with an elevated underdrain thus behaves as a dual system, with the portion above the drain acting like a biofiltration system with an underdrain at the bottom and the portion below the underdrain acting like a bioinfiltration system.
The Volume of retention provided by BMP is the total instantaneous volume credit that can be claimed for that BMP, and is determined by comparing the Volume reduction capacity of BMP [V] to the Required treatment volume.
Volume reduction from infiltration
Underdrain located at bottom of engineered media: Volume reduction from basin bottom infiltration (Vinfb)
Even with an underdrain installed at the bottom of the engineered media, under saturated conditions some water will infiltrate through the bottom soils rather than pass through the underdrain. This Volume reduction from basin bottom infiltration (Vinfb) is given by
\(V_{Inf_b} = I_R * (DDT) * A_B / (12in/ft) = 0.06 * (DDT) * A_B / (12in/ft)\)
Where
- IR is an infiltration rate into the native soils of 0.06 inches per hour;
- AB is the surface area at the bottom of the BMP (ft2); and
- DDT is the drawdown time (hr).
The default infiltration rate is set at 0.06 inches per hour to represent a D soil. This rate was selected because it is assumed most of the stormwater will pass through the underdrain before it can infiltrate through the bottom of the BMP. This may be a conservative assumption if underdrains are small, spaced far apart, and the underlying soil has an infiltration rate greater than 0.06 inches per hour. Conversely, more closely spaced or larger underdrains may allow the basin to drain in less than the required drawdown time, resulting in a slight overestimation of (Vinfb). If the user specifies that an impermeable liner is present at the bottom of the BMP, then no credit is given for infiltration into the bottom soils.
Elevated underdrain: Volume reduction stored below the underdrain
If the underdrain is elevated above the bottom of the BMP, then storage capacity becomes available in the media between the underdrain and the native soils. In systems with an elevated underdrain, this Volume reduction stored below underdrain is credited instead basin bottom infiltration (VInfb) credit that is given when the underdrain is at the bottom of the engineered media. This Volume reduction stored below underdrain (VU) is given by
\(V_U= (A_U + A_B) / 2 * (n - FC) * D_U \)
Where:
- AU is the surface area at the underdrain (ft2);
- AB is the surface area at the bottom of the basin (ft2);
- (n - FC) is the media porosity minus field capacity of the soils; and
- DU is the depth of the media below the underdrain (ft).
The stored water must drain within the specified drawdown time. The underlying soil controls the infiltration rate. The user must input the soil with the most restrictive hydraulic conductivity in the 5 feet directly below the basin (i.e. below the bottom of the engineered media). If the user specifies that an impermeable liner is present at the bottom of the BMP, then no volume reduction credit is given for storage below the underdrain.
Volume reduction from basin sides infiltration (Vinfs): underdrain elevated or at bottom of engineered media
Under saturated conditions within the filter media, water will infiltrate through any existing sloped sidewalls of the basin as the stormwater draws down through the underdrain. Stormwater lost from a sloped sidewall (Vinfs) is considered to infiltrate vertically into the surrounding soil. This credit is calculated whether the underdrain is elevated or at the base of the engineered media. The volume of water infiltrated through the sidewalls is given by
\(V_{Inf_s} = I_R * (DDT / 2) * (A_O - A_U ) / (12in/ft) = 0.06 * (DDT / 2) * (A_O - A_U ) / (12in/ft)\)
Where:
- AO is the surface area at overflow (ft2);
- AU is the surface area at the underdrain (ft2); and
- DDT is the drawdown time (hr).
Due to the fact that drawdown occurs as a continuous process, basin sides infiltration is not presumed to occur along the entire height of the sidewall during the entire drawdown time. For example, at "time zero", the entire sidewall should be exposed to saturated conditions and exhibit sidewall infiltration; but at the end of the drawdown period, there would theoretically be no section of the sidewall that is exposed to saturated conditions. Therefore, the drawdown time used in the calculation of (Vinfs) is reduced by a factor of 2 to account for the drop in water level and to approximate the "average" water level within the BMP during the drawdown period. The drop in water level is thus assumed to be linear over the drawdown time. A conservative default infiltration rate of 0.06 inches per hour is used because it is assumed that most of the stormwater will pass through the underdrain before it can infiltrate through the sidewalls of the BMP. If the user specifies that an impermeable liner is present on the sides of the BMP or if the sidewalls are not sloped (i.e., AO = AU), then no credit is given for infiltration into the side soils.
Volume reduction from evapotranspiration (ET)
In addition to the credit given for infiltration, a biofiltration BMP can achieve volume reduction through ET. The volume of water lost through evapotranspiration (VET) is the smaller of two calculated values, potential ET and measured ET.
Potential ET (ETpot)
Potential ET (ETpot) is equal to the amount of water stored between field capacity and the wilting point in the media above the underdrain, and is given by
\(ET_{pot} = (D_M - D_U ) * (A_M + A_U) / 2 * (FC - WP)\)
Where
- DM is the total media depth (ft);
- DU is the depth under the underdrain (ft);
- AM is the surface area of the media (ft2);
- AU is the surface area at the underdrain (ft2); and
- (FC – WP) is the difference between field capacity and wilting point.
Measured ET (ETmea)
Measured ET (ETmea) is the amount of water lost to ET as measured using available data. An average daily pan evaporation rate was estimated using previous measurements collected at the University of Minnesota Southwest Experiment Station at Lamberton, Minnesota (Source: Climate of Minnesota Part XII- The Hydrologic Cycle and Soil Water, 1979). A rate of 0.2 inches per day was selected, as this is an intermediate value between the summertime maximum rate and the lowest rates in October. Analysis of rainfall data indicates that a typical time period between precipitation events is 72 hours (3 days) in Minnesota. Therefore, a 3 day period is used to calculate the ETmea. A factor of 0.5 is also applied to convert the pan evaporation rate to ETmea. The ETmea volume thus equals the media surface area (AM) in square feet times the average daily ET rate in inches per day times 3 days.
\(ET_{mea} = A_M * 0.2 in/day * 0.5 * 3 days / 12 in/ft = 0.025 A_M\)
- If trees are planted in the bioretention basin then ETmea is multiplied by a factor of 3.
Comparison of volume reduction capacity with volume performance goal
The sum of the volumes lost to infiltration and to ET as calculated using the appropriate methods above gives the Volume reduction capacity of BMP [V]. The MIDS calculator compares the Volume reduction capacity of BMP [V] with the Required treatment volume, and the lesser of the two values is used to populate the Volume of retention provided by BMP. This comparison between potential and actual treatment volumes ensures that the BMP does not claim more credit than is due based on the actual amount of water routed to it. The Volume of retention provided by BMP is the actual volume credit the BMP receives toward the instantaneous performance goal. For example, if the BMP is oversized the user will only receive volume credit for the Required treatment volume routed to the BMP.
Annual volume retention is assessed by converting the instantaneous Volume reduction capacity of BMP [V] to an annual volume reduction percentage. This is accomplished through the use of performance curves developed from a range of modeling scenarios. These performance curves use the Volume reduction capacity of BMP [V], the infiltration rate of the underlying soils, the percent imperviousness of the contributing watershed area, and the size of the contributing watershed to calculate the Percent annual runoff volume retained and annual Retention volume provided by BMP.
Recommended values for porosity, field capacity and wilting point for different soils.1
Link to this table.
| Soil | Hydrologic soil group | Porosity 2 (volume/volume) | Field capacity (volume/volume) | Wilting point (volume/volume) | Porosity minus field capacity (volume/volume)3 | Field capacity minus wilting point (volume/volume)4 |
|---|---|---|---|---|---|---|
| Sand | A (GM, SW, or SP) | 0.43 | 0.17 | 0.025 to 0.09 | 0.26 | 0.11 |
| Loamy sand | A (GM, SW, or SP) | 0.44 | 0.09 | 0.04 | 0.35 | 0.05 |
| Sandy loam | A (GM, SW, or SP) | 0.45 | 0.14 | 0.05 | 0.31 | 0.09 |
| Loam | B (ML or OL) | 0.47 | 0.25 to 0.32 | 0.09 to 0.15 | 0.19 | 0.16 |
| Silt loam | B (ML or OL) | 0.50 | 0.28 | 0.11 | 0.22 | 0.17 |
| Sandy clay loam | C | 0.4 | 0.07 | |||
| Clay loam | D | 0.46 | 0.32 | 0.15 | 0.14 | 0.17 |
| Silty clay loam | D | 0.47 to 0.51 | 0.30 to 0.37 | 0.17 to 0.22 | 0.16 | 0.14 |
| Sandy clay | D | 0.43 | 0.11 | |||
| Silty clay | D | 0.47 | 0.05 | |||
| Clay | D | 0.47 | 0.32 | 0.20 | 0.15 | 0.12 |
1Sources of information include Saxton and Rawls (2006), Cornell University, USDA-NIFA, Minnesota Stormwater Manual. (See References for trees)
2Soil saturation is assumed to be equal to the porosity.
3This value may be used to represent the volume of water that will drain from a bioretention media.
4This value may be used to estimate the amount of water available for evapotranspiration
Pollutant reduction

Pollutant removal can be accomplished both via volume reducing and non-volume reducing processes in a biofiltration BMP. Pollutant load reductions are calculated on an annual basis and are thus dependent upon the volume of water retained by the BMP through infiltration and ET and the volume of water treated by filtration in the BMP.
Pollutant reduction via volume reduction
The first step in calculating annual pollutant load reductions is to determine the annual Retention volume provided by BMP as discussed in the Volume reduction section. All pollutants in this retained water are considered captured for a 100 percent removal. Thus, while oversizing a BMP above the Required treatment volume will not provide additional credit towards the instantaneous volume performance goal, it may provide additional annual pollutant reduction through treatment of water beyond the Required treatment volume.
Pollutant reduction via non-volume reduction treatment
Stormwater that is routed to the BMP but not infiltrated or lost through ET is assumed to flow through the filter media and out the underdrain, and is indicated by the Annual outflow volume in the BMP Summary tab. The removal rate for TSS in this filtered stormwater is set at 60 percent.
The removal rates for particulate phosphorus and dissolved phosphorus in the filtered stormwater depend on the user's input to three drop-down boxes: “Planting media mix”; “Is the P content of the media less than 30 mg/kg?”; and “Is a soil amendment used to attenuate phosphorus?”.
Particulate Phosphorus
The particulate phosphorus credit given for non-volume reduction treatment is either 0 percent or 80 percent depending on the media mix used and its P content.
- If Media Mix C or D is used, or if a media mix other than C or D is used and the soil phosphorus as measured using the Mehlich 3 test or a suitable alternative test is 30 milligrams per kilogram or less, then the annual particulate phosphorus reduction credit is 80 percent of the filtered water volume.
- If a media mix other than C or D is used and the soil phosphorus has not been determined or is greater than 30 milligrams per kilogram as measured using the Mehlich 3 test or a suitable alternative test, then the annual particulate phosphorus reduction credit is 0 percent of the filtered water volume.
NOTE: If the Olsen test is used to determine P content of the media mix, a simple conversion is required.
Dissolved Phosphorus
The dissolved phosphorus credit given for non-volume reduction treatment is between 0 percent and 60 percent depending on the media mix, the media P content, and if the media was amended to attenuate phosphorus.
- If Media Mix C or D is used, or if a media mix other than C or D is used and soil phosphorus as measured by the Mehlich 3 test or a suitable alternative test is 30 milligrams per kilogram or less, then the annual dissolved phosphorus credit applied to the filtered water volume, expressed as a percent, is given by
\(credit = 20 percent (D_M- D_U) / 2 ft\)
Where
- DM - DU represents the media depth above the underdrain (ft).
The credit is calculated as a percent reduction with a maximum value of 20 percent for media depths above the underdrain greater than 2 feet. If the media depth above the underdrain is less than 2 feet the credit is reduced equivalently.
- If a media mix other than C or D is used and the soil phosphorus has not been determined or is greater than 30 milligrams per kilogram as measured using the Mehlich 3 test or a suitable alternative test, then the annual dissolved phosphorus credit is 0 percent of the filtered water volume.
- An additional annual dissolved phosphorus credit of 40 percent of the filtered water volume may be received if phosphorus-sorbing amendments are used. Acceptable amendments include the following:
- 5 percent by volume elemental iron filings above the internal water storage (IWS) layer or elevated underdrain;
- minimum 5 percent by volume sorptive media above IWS layer or elevated underdrain;
- minimum 5 percent by weight water treatment residuals (WTR) to a depth of at least 3.9 inches (10 centimeters);
- For other proposed phosphorus-sorbing amendments: an additional annual dissolved phosphorus credit can be applied if and only if there is supporting third party research showing that this dissolved phosphorus reduction will occur for at least a 20-year lifespan. The credit may be commensurate with existing research results, with the understanding that the user may be asked to provide this documentation.
Phosphorus credits for bioretention systems with an underdrain. This includes tree trenches and dry swales.
Link to this table
| Particulate phosphorus (PP) | Dissolved phosphorus (DP) |
|---|---|
Is Media Mix C or D being used or, if using a mix other than C or D, is the media phosphorus content 30 mg/kg or less per the Mehlich 3 (or equivalent) test1?
The assumption of 55 percent particulate phosphorus and 45 percent dissolved phosphorus is likely inaccurate for certain land uses, such as industrial, transportation, and some commercial areas. Studies indicate particulate phosphorus comprises a greater percent of total phosphorus in these land uses. It may therefore be appropriate to modify the above equation with locally derived ratios for particulate and dissolved phosphorus. For more information on fractionation of phosphorus in stormwater runoff, link here.
Example PP removal credit
|
1. Is Media Mix C or D being used or, if using a mix other than C or D, is the media phosphorus content 30 mg/kg or less per the Mehlich 3 (or equivalent) test1?
2. Does the system include approved P-sorbing soil amendments2?
The assumption of 55 percent particulate phosphorus and 45 percent dissolved phosphorus is likely inaccurate for certain land uses, such as industrial, transportation, and some commercial areas. Studies indicate particulate phosphorus comprises a greater percent of total phosphorus in these land uses. It may therefore be appropriate to modify the above equation with locally derived ratios for particulate and dissolved phosphorus. For more information on fractionation of phosphorus in stormwater runoff, link here. |
| |
|
1Other widely accepted soil P tests may be used. Note: a basic conversion of test results may be necessary
2Acceptable P sorption amendments include
- 5% by volume elemental iron filings above IWS or elevated underdrain
- minimum 5% by volume sorptive media above IWS or elevated underdrain
- minimum 5% by weight water treatment residuals (WTR) to a depth of at least 10 cm
- other P sorptive amendments with supporting third party research results showing P reduction for at least 20 year lifespan, P credit commensurate with research results
NOTE: The user can modify event mean concentrations (EMCs) on the Site Information tab in the calculator. Default concentrations are 54.5 milligrams per liter for total suspended solids (TSS) and 0.3 milligrams per liter for total phosphorus (particulate plus dissolved). The calculator will notify the user if the default is changed. Changing the default EMC will result in changes to the total pounds of pollutant reduced.
Routing
A biofiltration basin can be routed to any other BMP, except for a green roof, a swale side slope, or any BMP that would cause stormwater to be rerouted back to the biofiltration basin already in the sequence. All BMPs can be routed to a biofiltration, except for a swale side slope BMP.
Assumptions for biofiltration basin with underdrain
The following general assumptions apply in calculating the credit for a biofiltration basin. If these assumptions are not followed the volume and pollutant reduction credits cannot be applied.
- The biofiltration basin has been properly designed, constructed, and will be properly maintained.
- Stormwater runoff entering the biofiltration basin has undergone pretreatment.
- Stormwater captured by the BMP enters the BMP media instantaneously. This will slightly underestimate actual infiltration since some water will infiltrate through the basin bottom and sidewalls during a rain event, thus creating more volume for storage in the BMP.
- Infiltration rates used to calculate the infiltration credit through the bottom and sidewalls of the basin are 0.06 inches per hour.
- Evapotranspiration is independent of plant type, plant density and weather conditions.
Biofiltration Basin with an elevated underdrain example


This example was completed using Version 2 of the Calculator.
An unlined biofiltration basin with an elevated underdrain is to be constructed in a watershed that contains a 1.4 acre parking lot surrounded by 0.8 acres of pervious area (turf area and the bioretention BMP area). All of the runoff from the watershed will be treated by the biofiltration basin. The soils across the area have a unified soils classification of SM (HSG type B soil). The surface overflow is located 1 ft above the media surface. The surface area of the biofiltration basin at the overflow point will be 6534 square feet. The area is 5600 square feet at the media surface. The surface area at the invert of the underdrain will be 3948 square feet. The area at the media-soil interface is 3320 square feet. The total media depth will be 3 feet with 1 foot of media between the underdrain and the native soils. Following the MPCA Construction Stormwater General Permit requirement, the water below the underdrain in the biofiltration basin needs to drawdown in a 48 hour time period. The media will be Media Mix C, which is mostly sand resulting in a difference between the media wilting point and field capacity of 0.11 cubic feet per cubic foot and a difference between the media porosity and field capacity of 0.26 cubic feet per cubic foot. The P content of the media is less than 30 mg/kg (milligrams per kilogram) and no soil amendments will be used to attenuate phosphorus. The following steps detail how this system would be set up in the MIDS calculator.
Step 1: Determine the watershed characteristics of your entire site. For this example we have a 2.2 acre site with 1.4 acres of impervious area and 0.8 acres of pervious area in type B soils. The pervious area includes the turf area and the area of the biofiltration basin.
Step 2: Fill in the site specific information into the Site Information tab. This includes entering a ZIP Code (55414 for this example) and the watershed information from Step 1. The Managed turf area includes the turf area and the area of the bioretention basin. ZIP code and impervious area must be filled in or an error message will be generated. Other fields on this screen are optional.
Step 3: Go to the Schematic tab and drag and drop the Bioretention basin (with underdrain) icon into the Schematic window.
Step 4: Open the BMP properties for the bioretention basin by right clicking on the Bioretention basin (with underdrain) icon and selecting Edit BMP Properties, or by double clicking on the Bioretention basin (with underdrain) icon.
Step 5: If help is needed click on the Minnesota Stormwater Manual Wiki link or the Help button to review input parameter specifications and calculations specific to the Bioretention basin (with underdrain) BMP.
Step 6: Determine the watershed characteristics for the Bioretention basin. For this example the entire site is draining to the bioretention basin. The watershed parameters therefore include a 2.2 acre site with 1.4 acres of impervious area and 0.8 acres of pervious turf area in type B soils. There is no routing for this BMP. Fill in the BMP specific watershed information in the Watershed tab (1.4 acres on impervious cover and 0.8 acres of Managed turf in B soils).
- MIDS calculator screen shots for inputs for bioretention with an elevated underdrain. Click on an image for enlarged view.
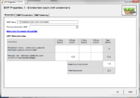
Screen shot showing Watershed tab for bioretention with an elevated underdrain. See Step 6.
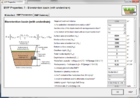
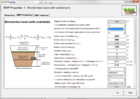
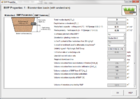
Screen shot showing BMP Parameters tab for bioretention with an elevated underdrain. See Step 7.
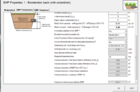
Screen shot showing BMP Parameters tab for bioretention with an elevated underdrain. See Step 7.
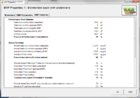
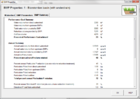
Screen shot of the BMP Summary tab for bioretention with an elevated underdrain. See Step 8.
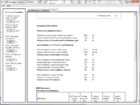
Screen shot of Results tab for the example of a bioretention system with an elevated underdrain. See Step 10.


Step 7: Enter the BMP design parameters into the BMP parameters tab. This bioretention basin with an elevated underdrain example would require the following entries:
- Is the underdrain elevated above native soils – Yes;
- Are the sides of the basin lined with an impermeable liner – No;
- Is the bottom of the basin lined with an impermeable liner – No;
- Surface area at overflow [AO]: 6534 square feet;
- Media surface area [AM]: 5600 square feet;
- Surface area at underdrain [AU]: 3948 square feet;
- Bottom surface area (area at media-soil interface) [AB]: 3230 square feet;
- Overflow depth [DO]: 1 foot;
- Total media depth [DM]: 3 feet;
- Depth below underdrain [DU]: 1 foot;
- Media field capacity minus wilting point [FP-WP]: 0.11 cubic feet per cubic foot;
- Media porosity minus field capacity [n-FC]: 0.26 cubic feet per cubic foot;
- Is a tree(s) planted in the BMP – No;
- Bioretention planting media mix – Media Mix C (selected in dropdown box);
- Is the P content of the media less than 30 mg/kg – autofills to “Yes” for Media Mix C;
- Is there a designed phosphorus treatment layer – No;
- Underlying soil – Hydrologic Soil Group: SM (HSG B; 0.45 in/hr) (selected in dropdown box); and
- Required drawdown time: 48 hours (selected in dropdown box).
Step 8: Click on BMP Summary tab to view results for this BMP.
Step 9: Click on the OK button to exit the BMP Properties screen.
Step 10: Click on Results tab to see overall results for the site.
Biofiltration Basin with an underdrain at bottom example (Version 2)

An unlined biofiltration basin with an underdrain at the bottom is to be constructed in a watershed that contains a 1.4 acre parking lot surrounded by 0.8 acres of pervious area (turf area and the bioretention BMP area). All of the runoff from the watershed will be treated by the biofiltration basin. The soils across the area have a unified soils classification of SM (HSG type B soil). The surface overflow is located 1 ft above the media surface. The surface area of the biofiltration basin at the overflow point will be 6534 square feet. The area is 5600 square feet at the media surface. The area at the media-soil interface is 3320 square feet. The total media depth will be 3 feet. The media will be Media Mix C, which is mostly sand resulting in a difference between the media wilting point and field capacity of 0.11 cubic feet per cubic foot and a difference between the media porosity and field capacity of 0.26 cubic feet per cubic foot. The P content of the media is less than 30 mg/kg (milligrams per kilogram) and no soil amendments will be used to attenuate phosphorus. The following steps detail how this system would be set up in the MIDS calculator.
Step 1: Determine the watershed characteristics of your entire site. For this example we have a 2.2 acre site with 1.4 acres of impervious area and 0.8 acres of pervious area in type B soils. The pervious area includes the turf area and the area of the biofiltration basin.
Step 2: Fill in the site specific information into the Site Information tab. This includes entering a Zip Code (55414 for this example) and the watershed information from Step 1. The Managed turf area includes the turf area and the area of the bioretention basin. Zip code and impervious area must be filled in or an error message will be generated. Other fields on this screen are optional.
Step 3: Go to the Schematic tab and drag and drop the Bioretention basin (with underdrain) icon into the Schematic window.
Step 4: Open the BMP properties for the bioretention basin by right clicking on the “Bioretention basin (with underdrain)” icon and selecting Edit BMP Properties, or by double clicking on the Bioretention basin (with underdrain) icon.
Step 5: If help is needed click on the Minnesota Stormwater Manual Wiki link or the Help button to review input parameter specifications and calculations pertinent to the “Bioretention basin (with underdrain)” BMP.
Step 6: Determine the watershed characteristics for the biofiltration basin. For this example the entire site is draining to the biofiltration basin. The watershed parameters therefore include a 2.2 acre site with 1.4 acres of impervious area and 0.8 acres of pervious turf area in type B soils. There is no routing for this BMP. Fill in the BMP specific watershed information in the Watershed tab (1.4 acres on impervious cover and 0.8 acres of Managed turf in B soils).
- MIDS calculator screen shots for inputs for bioretention with an underdrain at the bottom. Click on an image for enlarged view.
Screen showing Watershed tab for bioretention with an underdrain at the bottom. See Step 6.
MIDS calculator screen shot showing BMP Parameters tab for bioretention with an underdrain at the bottom. See Step 7.
MIDS Calculator screen shot showing BMP Parameters tab for bioretention with an underdrain at the bottom. See Step 7.
MIDS Calculator screen shot of the BMP Summary tab for bioretention with an underdrain at the bottom. See Step 8.
Screen shot of the Results tab for the example of a bioretention system with an underdrain at the bottom. See Step 10.


Step 7: Enter in the BMP design parameters into the BMP Parameters tab. This bioretention basin example with an underdrain at the bottom of the media requires the following entries:
- Is the underdrain elevated above native soils – No;
- Are the sides of the basin lined with an impermeable liner – No;
- Is the bottom of the basin lined with an impermeable liner – No;
- Surface area of overflow [AO]: 6534 square feet;
- Media surface area [AM]: 5600 square feet;
- Bottom surface area (area at media-soil interface) [AB]: 3230 square feet;
- Overflow depth [DO]: 1 foot;
- Total media depth [DM]: 3 feet;
- Media field capacity minus wilting point [FC-WP]: 0.11 cubic feet per cubic foot;
- Media porosity minus field capacity [n-FC]: 0.26 cubic feet per cubic foot;
- Is a tree(s) planted in the BMP – No;
- Bioretention planting media mix – Media Mix C (selected from the dropdown box);
- Is the P content of the media less than 30 mg/kg – autofills to “Yes” for Media Mix C;
- Is a soil amendment used to attenuate phosphorus– No;
- Underlying soil – Hydrologic Soil Group: SM (HSG B; 0.45 in/hr) (selected from the dropdown box); and
- Required drawdown time: 48 hrs (selected from the dropdown box).
Step 8: Click on BMP Summary tab to view results for this BMP.
Step 9: Click on the OK button to exit the BMP properties screen.
Step 10: Click on Results tab to see overall results for the site.
Requirements

- At least a 3 foot separation from the bottom of an infiltration system (includes bioretention with elevated underdrain) to the seasonal high water table
- If soils below the bottom of the infiltration system are ripped to promote infiltration, at least 2 feet of separation from the bottom of the ripped zone to the seasonal high water table
- Use the most restrictive infiltration rate within 5 feet of the bottom of the BMP
- For measured infiltration rates, apply a safety factor of 2
- Pretreatment for infiltration systems
Recommendations
- Drawdown time of 24 hours when the discharge is to trout streams
- Use of field tested infiltration rates rather than table values
Information
- Guidance on determining infiltration rates
- Information on site constraints (shallow soil, karst, etc.)
- Guidance on pretreatment
- Information on soil mixes
- Construction specifications for bioretention BMPs
- Information on operation and maintenance of bioretention BMPs.
Links to MIDS pages
- Overview of Minimal Impact Design Standards (MIDS)
- Performance goals for new development, re-development and linear projects
- Design Sequence Flowchart-Flexible treatment options
- Community Assistance Package
- MIDS calculator
- Performance curves for MIDS calculator
- Training and workshop materials and modules
- Technical documents
Related pages
- Bioretention terminology (including types of bioretention)
- Overview for bioretention
- Design criteria for bioretention
- Construction specifications for bioretention
- Operation and maintenance of bioretention
- Assessing the performance of bioretention
- Cost-benefit considerations for bioretention
- Calculating credits for bioretention
- Soil amendments to enhance phosphorus sorption
- Summary of permit requirements for bioretention
- Supporting material for bioretention
- External resources for bioretention
- References for bioretention
- Requirements, recommendations and information for using bioretention with no underdrain BMPs in the MIDS calculator
- Requirements, recommendations and information for using bioretention with an underdrain BMPs in the MIDS calculator
This page was last edited on 29 January 2023, at 13:27.