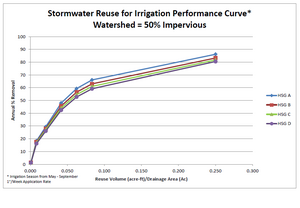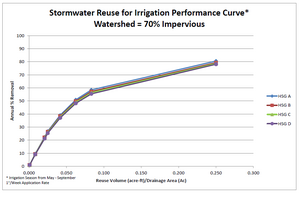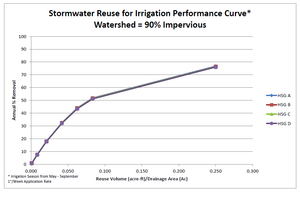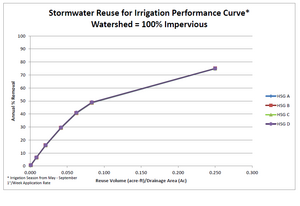
Stormwater reuse for irrigation - preliminary modeling analysis
Preliminary modeling analysis was performed to begin understanding the potential impact of stormwater reuse for irrigation on annual volume and pollutant load reductions. This section includes a discussion of
- general considerations impacting irrigation in the state of Minnesota, with a focus being on irrigation of turf and landscaping areas (non-agricultural applications);
- modeling methodology used to evaluate the impact of stormwater reuse on annual volume and pollutant load reductions; and
- preliminary results of this analysis.
Contents
Landscape and turf irrigation use rates in Minnesota
Although the state of Minnesota has abundant water, there are times when the demand for water exceeds the supply (Extension, 2009). As previously noted, as much as 50 percent of potable water supply is used for outdoor, non-potable uses in Minnesota during the summer. During hot weather and extended periods of drought, Twin Cities’ property owners will use 45 to 120 gallons of treated drinking water per person per day for outdoor uses, with peak usage on large lots and new turf reaching as much as 200 gallons per person per day (Metropolitan Council, 2011).
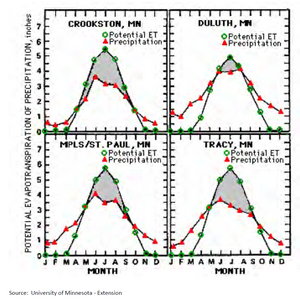
Exactly how much water is required for irrigation is dependent on many factors. These factors include the amount of precipitation and the potential evapotranspiration (PET). The PET is the amount of water that could be evaporated from the land, water, and plant sources if soil water were in unlimited supply. PET is a function of soil moisture, daily available sunlight, and air temperature (EOR, 2011 (draft)). The University of Wisconsin (UW) Agriculture Extension Service has estimated PET based on satellite derived measurements of solar radiation and air temperatures at regional airports using the UW Soil Science model.
Potential evapotranspiration for Minneapolis-St. Paul from 2001-2010
Link to this table
| Year | Mean Potential Evapotranspiration (in/d) | Maximum Potential Evapotranspiration (in/d) | Standard Deviation Potential Evapotranspiration (in/d) |
|---|---|---|---|
| 2001 | 0.17 | 0.31 | 0.07 |
| 2002 | 0.18 | 0.33 | 0.06 |
| 2003 | 0.16 | 0.29 | 0.07 |
| 2004 | 0.14 | 0.28 | 0.06 |
| 2005 | 0.16 | 0.29 | 0.07 |
| 2006 | 0.16 | 0.30 | 0.07 |
| 2007 | 0.17 | 0.29 | 0.06 |
| 2008 | 0.17 | 0.28 | 0.06 |
| 2009 | 0.16 | 0.32 | 0.05 |
| 2010 | 0.16 | 0.29 | 0.07 |
| Avg (2001-2010) | 0.16 | 0.30 | 0.06 |
Source: EOR, 2011 (draft) based on Bland and Diak, 2011
Plots of monthly average rainfall and the average potential evapotranspiration can be used to identify periods when the potential evapotranspiration is greater than the average precipitation. These are periods of the year when irrigation may be necessary and they typically fall within the period from May through September. However, because of the geographic variation in climate, the expected irrigation periods vary across the state (UMN Extension, 2009).
The amount of water that needs to be applied during irrigation depends on the soil type and wetness of the soil. Typical irrigation depths for turf and landscaping in Minnesota range from 1 to 1.5 inches (minus any rainfall received) per week (UMN Extension, 2009). Additionally, the frequency of watering can be highly variable and is affected by the plant species, soil texture, climate, exposure, and intensity of use (UMN Extension, 2009). There is also variability based on the season. In the spring and summer, plants only require 40 to 60 percent of available water for evapotranspiration, while in mid-summer, turfgrass can require up to 100 percent (EOR, 2011 (draft)). Because of this variability in the supply and demand of water for irrigation, stormwater reuse systems for irrigation typically require a potable water back-up supply as well. Transpiration by urban trees can also vary by type of tree. Peters et al. (2010) found that water use by evergreens was greater than deciduous trees because they transpire more water and have a longer growing season. For example, transpiration from an evergreen can be on the order of 0.075 inches per per square meter of canopy, while for deciduous trees, the transpiration is on the order of 0.044 inches per day per square meter of canopy (EOR, 2011 (draft)).
When utilizing stormwater for irrigation as a means of managing stormwater for volume reduction or water quality improvements, the approach to the application of the irrigation water will likely vary from typical irrigation methods. The goal of the reuse is to maximize the saturation of the soil without limiting plant growth (EOR, 2011 (draft)). In addition to human health concerns related to the potential exposure to pathogens there may be concerns with the effect of stormwater pollutants on plants (e.g., nutrients, sediments, heavy metals, hydrocarbons, chlorides, and pathogens). Therefore, if possible, the plants selected for a stormwater irrigation system should have high tolerance to both water logging and pollutant concentrations.
Stormwater reuse for irrigation modeling methodology
P8 (Program for Predicting Polluting Particle Passage through Pits, Puddles and Ponds, IEP, Inc., 1990) is a computer model used for predicting the generation and transport of stormwater runoff and pollutants in urban watersheds. Barr used the P8 model, Version 3.4, in this analysis to simulate the stormwater runoff and phosphorus loads generated from hypothetical development sites with varying levels of imperviousness to represent variation in typical development density. The model requires user input for watershed characteristics, local precipitation and temperature, and other parameters relating to water quality and BMP pollutant removal performances. Barr then utilized a daily water balance spreadsheet model of the runoff water and pollutant loads generated by the P8 model to estimate the potential impact of stormwater reuse for irrigation on runoff volume reduction, and, ultimately, the pollutant load reduction.
P8 watershed modeling
The P8 analysis evaluated runoff from several hypothetical 10-acre development scenarios with varying levels of imperviousness. Twenty hypothetical watersheds were included in the P8 modeling nalysis, including
- A soils with 10% imperviousness;
- A soils with 30% imperviousness;
- A soils with 50% imperviousness;
- A soils with 70% imperviousness;
- A soils with 90% imperviousness;
- B soils with 10% imperviousness;
- B soils with 30% imperviousness;
- B soils with 50% imperviousness;
- B soils with 70% imperviousness;
- B soils with 90% imperviousness;
- C soils with 10% imperviousness;
- C soils with 30% imperviousness;
- C soils with 50% imperviousness;
- C soils with 70% imperviousness;
- C soils with 90% imperviousness;
- D soils with 10% imperviousness;
- D soils with 30% imperviousness;
- D soils with 50% imperviousness;
- D soils with 70% imperviousness; and
- D soils with 90% imperviousness.
Watershed runoff volumes from pervious areas were computed in P8 using the SCS Curve Number method. Pervious curve numbers were selected for each hypothetical watershed based on soil type and an assumption that the pervious areas within the hypothetical development would be open space areas in fair to good condition. References on SCS curve numbers provide a range of curve numbers that would apply to pervious areas in fair to good condition. Pervious curve numbers of 39, 65, 74, and 80 were used for hydrologic soil groups A, B, C, and D, respectively.
Depression storage represents the initial loss caused by such things as surface ponding, surface wetting, and interception. As previously discussed, the P8 model utilizes the SCS Curve Number method to estimate runoff from pervious areas. For impervious areas, runoff begins once the cumulative storm rainfall exceeds the specified impervious depression storage, with the runoff rate equal to the rainfall intensity. An impervious depression storage value of 0.06 inches was used for the P8 simulation.
The P8 model requires hourly precipitation and daily temperature data; long-term data was used so that watersheds and BMPs can be evaluated for varying hydrologic conditions. The hourly precipitation and average daily temperature data were obtained from the National Weather Service site at the Minneapolis-St. Paul International Airport. The simulation period used for the P8 analysis was January 1, 1955 through December 31, 2004 (50 years).
For the P8 analysis, the 50-year hourly dataset was modified to exclude the July 23-24, 1987 “super storm” event, in which 10 inches of rainfall fell in 6 hours. This storm event was excluded because of its extreme nature and the resulting skew on the pollutant loading and removal predictions. Excluding the July 23-24, 1987 “super storm”, the average annual precipitation throughout the 50-year period used for the P8 modeling was 27.7 inches.
The NURP50.PAR particle file was used for the P8 model. The NURP 50 particle file represents typical concentrations and the distribution of particle settling velocities for a number of stormwater pollutants. The component concentrations in the NURP 50 file were calibrated to the 50th percentile (median) values compiled in the EPA’s Nationwide Urban Runoff Program (NURP).
There are numerous additional input parameters that can be adjusted in the P8 model. Several of the parameters related to simulation of snowmelt and runoff are summarized below.
- Minimum inter-event time (hours) = 10. P8 summarizes results in a series of discrete events. The minimum inter-event time is equals the minimum number of consecutive dry hours which must occur before a new storm event is initiated. This parameter influences event-based model output, but will not impact overall mass balance or load reductions.
- Snowmelt factors — melt coefficient (Inches/Day-Deg-F) = 0.06. The rate of snowmelt is governed in P8 by the SCS degree-day equation, in which the snowmelt (inches/day) is a product of the melt coefficient and the difference between the observed daily mean temperature and the specified melt temperature (32 degrees Fahrenheit).
- Snowmelt factors — scale factor for max abstraction = 1. This factor controls the quantity of snowmelt runoff from pervious areas by adjusting the maximum abstraction used with the SCS Curve Number method (i.e., controls losses due to infiltration). With a scale factor of 1 (P8 default), the maximum abstraction is unmodified during snowmelt or frozen ground conditions.
- Snowmelt factors — soil freeze temperature (degrees Fahrenheit) = 32. This temperature setting can be adjusted to control the rate of runoff from pervious areas when the soil is likely to be frozen. At the start of each precipitation or snowmelt event, if the 5-day-average antecedent air temperature is below the soil freeze temperature, the pervious curve number will be modified to reflect Antecedent Moisture Condition (AMC) III and the Maximum Abstraction scale factor will be applied.
- Runoff factors - 5-day antecedent rainfall and snowmelt (inches): Growing Season AMC-II = 1.4 and AMC-III = 2.1 (P8 defaults), Non-growing Season AMC-II = 0.5 and AMC-III = 1.1 (P8 defaults). These input parameters allow the model to make curve number adjustments based on antecedent moisture conditions.
Daily mass balance/volume reduction modeling
A daily spreadsheet mass balance model was developed to estimate the expected annual stormwater runoff volume reduction due to reuse of stormwater for irrigation. We assumed that the annual pollutant reduction would be equivalent to the estimated annual volume reduction as the result of stormwater reuse for irrigation.
There are a variety of parameters that can influence the annual stormwater runoff reduction due to stormwater collection and reuse for irrigation. These parameters include:
- watershed characteristics: area, imperviousness, soil type;
- volume for reuse storage;
- available application area for irrigation;
- irrigation rate; and
- irrigation period.
To begin understanding the range in the potential impact of stormwater reuse for irrigation on stormwater runoff volume and pollutant removal, we ran a variety of reuse scenarios for each of the twenty watershed conditions. The daily mass balance modeling for the stormwater reuse was evaluated for the same period that was run in the P8 analysis, from January 1, 1955 through December 31, 2004 (50 years). The following is a summary of the assumptions used in the preliminary mass balance modeling analysis to develop the range in the potential impact of stormwater reuse for irrigation.
As previously mentioned, to generate the watershed runoff loads, the P8 model was used, evaluating 20 different 10-acre development scenarios, varying the imperviousness and soil types. A variety of potential application areas for irrigation were evaluated, ranging from 1 percent of the hypothetical watershed area (0.1 acre) to three (3) times the watershed area (30 acres). For the preliminary model runs, we assumed that the irrigation use rate was equivalent to 1 inch per week (or 0.14 inches per day) over the application area during the irrigation season and that the storage volume for stormwater (for irrigation) was equivalent to the one week demand for irrigation water. For the preliminary model runs, we assumed irrigation would begin in May and continue through the end of September and that irrigation would occur at a rate of 0.14 inches per day during that period, regardless of the amount of precipitation.
On a daily time step for the 50-year period that was evaluated in P8, the mass balance model tracked the available storage volume in the stormwater reuse system at the beginning of the day, the volume of watershed runoff (as generated by P8), the amount of watershed runoff that would bypass the system (due to storage not being available), the irrigation volume (if applicable and available), and the storage volume remaining in the stormwater reuse system at the end of the day. The estimated annual volume reduction (and equivalent pollutant reduction) was determined based on comparison of the average annual volume used for irrigation with the average annual watershed runoff volume.
Estimated impact of stormwater reuse for irrigation
The results of the long-term continuous simulation P8 and daily mass balance modeling analyses are presented below.
The table below summarizes the average annual watershed runoff volumes from the hypothetical 10-acre watersheds along with the range of average annual runoff volume reduction based on reuse for irrigation. There is a significant amount of variability in the estimated average annual removal efficiencies related to stormwater reuse for irrigation, based on the sizing of the reuse storage, application area, the irrigation rate and irrigation period. The modeled average annual removals are based on the assumption that the stormwater reuse storage volume is equivalent to the one week demand for irrigation water with an application rate of 1 inch per week over the application area for an irrigation period from May through September. Depending on the combinations of variables, the estimated annual volume reduction (and equivalent pollutant removal) can range from 1 to 98 percent.
Estimated impact of stormwater reuse for irrigation on average annual runoff reduction. The table shows average annual runoff volumes (acre-feet) for 10 acre wastersheds as a function of soil group and percent imperviousness. The range of average annual volume reduction from reuse is shown in the last two columns.
Link to this table
| Hydrologic Soil Group (HSG) | Watershed Area (acre) | Watershed Imperviousness (%) | Average Annual Runoff Volume1 (acre-ft) | Range of Average Annual Runoff Volume Reduction2 (%) | |
|---|---|---|---|---|---|
| A | 10 | 10 | 2.3 | 6.0 | 98.3 |
| 10 | 30 | 6.2 | 2.2 | 93.6 | |
| 10 | 50 | 10.2 | 1.4 | 86.2 | |
| 10 | 70 | 14.1 | 1.0 | 80.6 | |
| 10 | 90 | 18.1 | 0.8 | 76.7 | |
| B | 10 | 10 | 3.2 | 4.3 | 91.7 |
| 10 | 30 | 6.9 | 2.0 | 88.2 | |
| 10 | 50 | 10.7 | 1.3 | 83.3 | |
| 10 | 70 | 14.4 | 1.0 | 79.3 | |
| 10 | 90 | 18.2 | 0.8 | 76.4 | |
| C | 10 | 10 | 3.9 | 3.5 | 87.6 |
| 10 | 30 | 7.5 | 1.9 | 85.4 | |
| 10 | 50 | 11.1 | 1.3 | 81.8 | |
| 10 | 70 | 14.7 | 1.0 | 78.6 | |
| 10 | 90 | 18.3 | 0.8 | 76.2 | |
| D | 10 | 10 | 4.7 | 2.9 | 84.6 |
| 10 | 30 | 8.1 | 1.7 | 83.2 | |
| 10 | 50 | 11.5 | 1.2 | 80.5 | |
| 10 | 70 | 14.9 | 0.9 | 78.1 | |
| 10 | 90 | 18.4 | 0.8 | 76.0 | |
1 - Based on 50-year P8 model run from January 1, 1955 through December 31, 2004 utilizing MSP climate data
2 - Assumes stormwater storage volume for reuse equivalent to the one week demand for irrigation water assuming an application rate of 1"/week over the application area & irrigation period from May through September
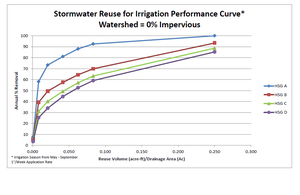
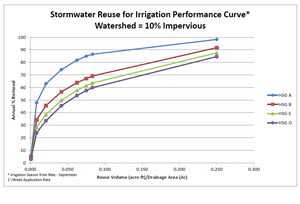
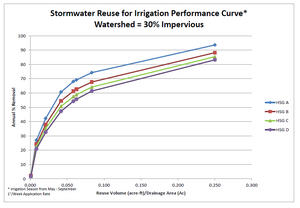
Curves from modeling analysis for the Twin Cities region show estimated average annual runoff volume reductions due to irrigation for a range of soil types (HSG A through D). The curves are based on a relationship between the estimated stormwater reuse storage volume and watershed area. However, exactly how stormwater reuse for irrigation can be incorporated into a site design or retrofitted into an existing system will vary. In some cases, the application area available may control the sizing of the reuse storage. In other situations, there is sufficient application area but a limited watershed area to generate the runoff for reuse resulting in a smaller storage volume for reuse water. Spatial constraints on the site may limit the amount of storage volume that could be included into the site design and layout. Additionally, depending on the geographic location within the state, the current climate, and/or the type of plant species that are being irrigated, the application rate may vary (0.5 to 2.0 inches per week) along with the irrigation period throughout the year. Currently, the set of curves developed from the preliminary modeling does not capture the potential variability in all these parameters (and resulting removal efficiencies).
Also, it is important to look at the relationship between all of these variables when designing a stormwater reuse system to optimize the sizing of the system for a specific site to maximize the cost-benefit of the system. For example, for a hypothetical 10-acre watershed at 50 percent impervious and B type soils, the average storm event runoff (based on the 50-year climatic period evaluated in P8) is 0.16 acre-feet. Assuming the stormwater reuse volume is sized to store the average event runoff from the watershed (and that there is sufficient application area to reuse the stormwater), this would result in an average annual reduction in stormwater runoff volumes of approximately 24 percent. Average annual TSS and total phosphorus reductions are also 24 percent for this example. Using a NURP pond after reuse leads to more than an 87 percent reduction in TSS and more than a 60 percent reduction in total phosphorus.
Examples of the estimated runoff volume reduction for a stormwater reuse storage system sized for the average storm event runoff volume
Link to this table
| Hydrologic Soil Group (HSG) | Watershed Area (acre) | Watershed Imperviousness (%) | Average Storm Event Runoff Volume (acre-ft)1 | Average Annual Runoff Volume Reduction2 |
|---|---|---|---|---|
| B | 10 | 10 | 0.05 | 21.4 |
| 30 | 0.10 | 26.4 | ||
| 50 | 0.16 | 24.0 | ||
| 70 | 0.21 | 21.9 | ||
| 90 | 0.26 | 21.3 |
1 - Based on 50-year P8 model run from January 1, 1955 through December 31, 2004 utilizing MSP climate data 2 - Assumes stormwater storage volume for reuse equivalent to the average storm event runoff volume and that the application area is sufficient to handle an irrigation application rate of 1"/week over the application area & irrigation period from May through September
Examples of the estimated pollutant load reductions for a stormwater reuse storage system sized for the average storm event runoff volume
Link to this table
| Hydrologic Soil Group (HSG) | Watershed Area (acre) | Watershed Imperviousness (%) | Average Annual Runoff Volume Reduction1,2(%) | Average Annual TSS Reduction Reuse Only3(%) | Average Annual TP Reduction Reuse Only3(%) | Average Annual TSS Reduction NURP & Reuse3,4(%) | Average Annual TP Reduction NURP & Reuse3,4(%) |
|---|---|---|---|---|---|---|---|
| B | 10 | 10 | 21.4 | 21.4 | 21.4 | 87.4 | 60.7 |
| 30 | 26.4 | 26.4 | 26.4 | 88.2 | 63.2 | ||
| 50 | 24.0 | 24.0 | 24.0 | 87.8 | 62.0 | ||
| 70 | 21.9 | 21.9 | 21.9 | 87.5 | 61.0 | ||
| 90 | 21.3 | 21.3 | 21.3 | 87.4 | 60.7 |
1 - Based on 50-year P8 model run from January 1, 1955 through December 31, 2004 utilizing MSP climate data
2 - Assumes stormwater storage volume for reuse equivalent to the average storm event runoff volume and that the application area is sufficient to handle an irrigation application rate of 1"/week over the application area & irrigation period from May through September
3 – Assumes pollutant removal equivalent to volume reduction for reuse only
4 - Assumes average annual NURP pond removal: TP=50%, TSS=84%.
When considering stormwater reuse only, it may be possible to increase the reuse storage volume for the same watershed and application area to maximize the expected annual removal efficiency. For example, to achieve an 80 percent average annual removal efficiency for the same hypothetical watershed, the stormwater reuse volume would need to be increased to 2.5 acre-feet (more than 15 times the average event runoff volume) and would also need sufficient application area to reuse the stormwater within a week at an application rate of one (1) inch per week. This increase in storage volume means that for most storm events, the reuse storage system will remain nearly empty. Additionally, this increase in storage volume typically comes with an associated cost that may be prohibitive, unless the volume is associated with an existing pond that can be utilized for storage and reuse. All of these factors must be weighed when evaluating and optimizing a stormwater reuse system in the context of a specific site.
This page was last edited on 21 February 2023, at 21:18.
