![]()
TCMA Chloride Management Plan - TCMA Chloride Conditions - Chloride trends
View this section as a separate page
This section of the CMP presents evaluations of chloride water quality conditions in the TCMA considering:
- Seasonal chloride trends in surface waters
- Long-term chloride trends
- Chloride trends within lakes
- Chloride relationships to watershed characteristics
- Chloride concentrations in stormwater
- Chloride relationships between surface and groundwater
This information is intended to help inform management decisions such as where and when to focus monitoring efforts and where to prioritize implementation activities.
Contents
Seasonal chloride trends in surface waters


_in_Sand_Creek.PNG)
_in_Elm_Creek.PNG)

Chloride data were evaluated for seasonal trends by looking at monthly chloride concentrations. Seasonal trends can help determine the cause of elevated chloride concentrations. Causes can be direct runoff from winter maintenance practices using chloride, groundwater inputs (primarily from infiltrated chloride containing deicers) during low flow, and WWTP inputs.
For the majority of impaired lakes, chloride concentrations were highest January through May. The Monthly average chloride concentrations in Powderhorn Lake chart presents an example of the seasonal variability observed in Powderhorn Lake. Powderhorn Lake does not have a natural outlet and has little opportunity to flush chloride from the lake. For streams, chloride concentrations were highest December through April. Lakes tended to show less variation seasonally than streams, as would be expected due to the longer residence time and mixing that occurs in a lake.
There are some streams where chloride concentrations are influenced significantly by sources other than winter maintenance activities, such as WWTPs. These streams tended to show the highest chloride concentrations when flows were low. Low flows generally occur during winter months and dry summer months (July through September) when runoff is low. Sand Creek is an example and is shown in the Monthly chloride concentrations (average, maximum, and minimum) in Sand Creek chart. Chloride concentrations in Sand Creek were highest in late summer and winter and lowest in spring and early summer. Limited chloride data from the WWTPs discharging to Sand Creek confirm this as a significant source of chloride. Elm Creek is another stream that exhibits highest chloride concentrations in summer, as shown in the Monthly chloride concentrations (average, maximum, and minimum) in Elm Creek chart, but does not have the WWTPs contributing to the chloride concentration, indicating a different source is present that requires further investigation.
Long-term chloride trends
Long-term statistical trend analyses require a long, mostly continuous, monitoring record. Sufficient data were available in EQuIS to conduct long-term statistical trend analysis for 11 of the impaired lakes and 9 of the high risk lakes in the TCMA. Trends were determined using the Season Mann Kendall Trend Test with R Statistical Software and are presented in the Long-term chloride trends in lakes in the TCMA table. Lakes with a minimum of 10 years of data were analyzed and only samples collected from the surface were used in the analyses. Fourteen lakes showed a significant (p < 0.05) increasing trend in chloride and eight lakes did not have a significant trend. The Increasing chloride concentration in surface samples in Gervais Lake from 1983-2014 chart shows an increasing trend in chloride concentration in Gervais Lake. The other lakes in the Long-term chloride trends in lakes in the TCMA table showed similar trends.
The Metropolitan Council is currently analyzing long-term trends in chloride concentrations for some of the streams in the metro area. The results of the analyses will be available on the Metropolitan Council’s Stream Monitoring and Assessment webpage.
Long-term chloride trends in lakes in the TCMA
Link to this table
| Lake | Period | Percent change/year | Trend Description |
|---|---|---|---|
| Beaver | 1984-2014 | +2.42% | Increasing |
| Bennett | 1984-2014 | No trend | |
| Calhoun | 1991-2014 | +1.74% | Increasing |
| Carver | 2004-2014 | No trend | |
| Como | 1984-2014 | No trend | |
| Gervais | 1983-2014 | +3.72% | Increasing |
| Hiawatha | 1994-2014 | No trend | |
| Johanna | 1984-2014 | +3.37% | Increasing |
| Keller (Main Bay) | 1983-2014 | +3.85% | Increasing |
| Kholman | 1983-2014 | +3.62% | Increasing |
| Lake of the Isles | 1991-2014 | No trend | |
| Loring | 1995-2014 | No trend | |
| McCarron | 1985-2014 | +2.41% | Increasing |
| Powderhorn | 1994-2014 | No trend | |
| Silver | 1979-2014 | +2.92% | ncreasing |
| South Long Lake | 1984-2014 | +3.66% | Increasing |
| Spring | 1995-2014 | +4.34% | Increasing |
| Tanners | 2004-2014 | +3.63% | Increasing |
| Valentine | 1990-2014 | +5.56% | Increasing |
| Wabasso | 1984-2014 | +1.92% | Increasing |
| Wakefield | 1984-2014 | No trend | |
| Wirth | 1994-2014 | +2.49% | Increasing |
The Metropolitan Council 2013 Stream Water Quality Summary for the TCMA found that current chloride concentrations within the St. Croix, Minnesota, and Mississippi River basins are at levels higher than the 10-year average (2004-2013).
A multiple regression using both the year and the number of snowfall events in a winter season (precipitation equivalent > 0.01”) as the independent variables showed the strongest potential to predict average winter chloride concentrations. Waterbodies with 10 years of data (2004-2013) and a relatively strong correlation over this period include Powderhorn Lake, Wirth Lake, Bassett Creek, and Nine Mile Creek. The results of the multiple regression analyses are presented in the table below. The results show that average winter chloride concentrations are increasing between 9.7mg/L per year and 19.3 mg/L per year for these waters, though Bassett Creek did not exhibit a significant correlation to year. Average winter chloride concentrations increase between 2.9 mg/L and 7.9 mg/L for every additional snowfall event. Tests of significance for these correlations demonstrated that there is meaningful correlation, though the limited dataset of 10 years results in a fairly wide range in confidence intervals for the coefficients and intercepts.
Results of Regression Analyses for Average Winter Chloride Concentrations (2004-2013)
Link to this table
| Waterbody | Predicted winter average chloride (mg/L) | Yearly average increase (mg/L/yr) | Average increase per snowfall event (mg/L event) | R-square |
|---|---|---|---|---|
| Powderhorn Lake | 10.5 * year + 2.9 * # of events -20,898 | 10.5 | 2.9 | 0.63 |
| Wirth Lake | 9.7 * year + 4.2 * # of events -19,422 | 9.7 | 4.2 | 0.50 |
| Bassett Creek | 4.8 * # of events +74 | ---- | 4.8 | 0.61 |
| Nine Mile Creek | 19.3 * year + 7.9 * # of events -38,815 | 19.3 | 7.9 | 0.67 |

Long term trends in groundwater chloride concentrations have also been evaluated (Chloride concentration trends in Minnesota’s ambient groundwater map). Chloride concentrations in the TCMA groundwater have increased in about one-third of the wells that had sufficient data for trend analysis (MPCA The Condition of Minnesota’s Groundwater, 2013). In some wells, chloride concentrations have increased by about 100 mg/L in the last 15-20 years. Most of the wells with increasing trends were shallow wells tapping the sand and gravel aquifers; however, increasing concentrations were also found in two deep wells in the TCMA. The high concentrations of chloride found in the shallow sand and gravel aquifers in the TCMA are likely a result of winter deicing materials (MPCA, 2013).
Based on the chloride data and associated analyses, it is clear that chloride concentrations continue to increase in both the surface water and groundwater. The increasing trends in chloride concentrations indicate the need to take steps now to reduce chloride use.
Shallow groundwater will eventually either discharge to surface waters or move down to deeper aquifers that contain water that is used for Minnesota’s drinking water supplies. If continued trends of increasing chloride in shallow groundwater persist, higher concentrations in deep aquifers will eventually occur, which could result in higher water treatment costs or restrict its use for drinking water supplies (MPCA, 2013).
Upward trends in chloride concentrations were not just restricted to shallow wells that tapped the sand and gravel aquifers. Concentrations also significantly increased in two deep wells in the TCMA. One of these wells was 190 feet deep and tapped the Jordan aquifer in the vicinity of Cottage Grove. The other well was 72 feet deep and tapped a buried sand and gravel aquifer in Hennepin County. The Cl/Br ratios in both of these wells; 803 and 822, respectively; also was considerably greater than those expected in groundwater unaffected by human-caused contamination. In these two wells, chloride concentrations increased on average 1.8 mg/L each year. This translated into an increase of about 15-30 mg/L over approximately the past 15 years. Concentrations in the Jordan aquifer well increased from about 12 mg/L in 1999 to 41 mg/L in 2011, and concentrations in the buried sand and gravel aquifer wells increased from about 30 mg/L in 1996 to 46 mg/L in 2011 (MPCA, 2013).
Chloride trends within lakes
As chloride concentrations in water increase, the density of the water increases. Water that is denser will tend to collect at the bottom of a lake. As chloride concentrations increase, the differences between chloride concentrations in the bottom and top waters can become more pronounced. As these differences become greater, the normal mixing patterns of the lake can be inhibited and potentially stop all together (Novotny et al. 2008). Some lakes exhibit meromictic conditions or incomplete mixing and/or circulation, which can mean turn-over of the lake is limited, delayed, or non-existent. Mixing is an important process in a lake as it prevents reduced dissolved oxygen levels in the hypolimnion or lower level of the lake. Factors such as hydraulic residence time, fetch, groundwater inputs, colored fraction of dissolved organic carbon, and lake depth all influence the mixing conditions in a lake. Meromictic conditions are more likely to occur in lakes with higher depth to surface area ratios, as measured by the Osgood Index. High chloride concentrations in a lake may result in an increased risk of meromictic conditions. Brownie Lake and Spring Lake have been identified as being meromictic. The meromictic conditions in Brownie Lake may be due to alterations to the watershed and outlet that occurred prior to the practice of winter salt application.
A number of the monitored lakes had substantial differences in the chloride concentrations between the top and bottom of the water column. Brownie Lake exhibits this characteristic most dramatically, as shown in the Average monthly chloride concentrations in top and bottom samples in Brownie Lake chart. Peavey Lake, Powderhorn Lake, and Spring Lake also exhibit a clear pattern of higher chloride concentrations at depth as shown in the Average monthly chloride concentrations in top and bottom samples in Peavey Lake chart, Average monthly chloride concentrations in top and bottom samples in Powderhorn Lake chart, and the Average monthly chloride concentrations in top and bottom samples in Spring Lake chart respectively.
- Average monthly chloride concentrations in top and bottom samples from select lakes. Click on an image to enlarge.
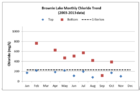
Brownie Lake 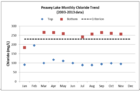
Peavey Lake 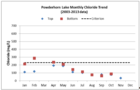
Powderhorn Lake 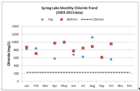
Spring Lake


Chloride relationships to watershed and waterbody characteristics
_in_TCMA_lakes_versus_Osgood_Index.PNG)


_in_Shingle_Creek_from_1996-2014.PNG)
Relationships were evaluated between the average winter chloride concentrations to watershed size, percent impervious surface, lake volume, and the lake Osgood Index. No strong relationships were identified with the exception of the Osgood Index and road density. The Osgood Index relates the mean depth of a lake to the surface area (Osgood Index = Mean Depth (m) ÷ Surface Area (km2)0.5). Lake chloride concentrations generally increase with increasing Osgood Index. The Osgood Index may be used to prioritize monitoring efforts for lakes with no or limited data.
Salt applied to impervious surfaces as a deicer is considered a primary source of chloride to lakes and streams. Therefore, one might expect chloride concentrations to be correlated to the amount of impervious area in a watershed. Winter stream chloride concentrations were positively correlated with annual winter salt application. Watersheds with less than 15 tons per square mile of chloride varied in winter stream median chloride concentration ranging from 18 to 89 mg/L (Wenck 2009).
Road density was also positively correlated with median winter chloride concentrations. The deicing salt load was highly dependent on road density. Median winter chloride concentrations appear to increase with road densities greater than 25 lane miles per square mile (Wenck 2009).
Chloride concentrations in stormwater
In comparison to chloride samples taken from lakes, wetlands, and streams, the area’s stormwater runoff contains some of the highest chloride concentrations found in the TCMA. The data indicates a high degree of seasonal variability, which is a result of winter maintenance activities and the direct connection to impervious surfaces. Storm sewer chloride data was collected in the TCMA from 1980 through 2013. Sample set sizes ranged from 19 to 288 samples per month, for a total of 1,569 samples. The data indicate that high chloride concentrations are found during the winter maintenance season and increase as the winter season progresses with the peak occurring in February
Chloride relationships between surface and groundwater
Concentrations of chloride in shallow groundwater are increasing. Shallow groundwater contributes flow to lakes, wetlands, and streams. In the TCMA, average chloride concentrations in shallow monitoring wells located within watersheds that contain one or more impaired surface waters were higher (141 mg/L) compared to wells in watersheds without an impaired lake, stream, or wetland (48 mg/L).
Several studies of streams in the Upper Midwest have found that higher chloride levels in shallow groundwater have, in part, contributed to an increase in concentration in streams during low flow conditions, when stream flow is dominated by groundwater inputs (Kelly 2008; Eyles et al. 2013; Corsi et al. 2015). This pattern of increased chloride concentrations during low flow conditions, typically during the summer months, is also evident in streams in the TCMA. Chloride concentrations exceeding the 230 mg/L standard have been observed in Bassett Creek in June and Shingle Creek in August. This issue is not isolated to the TCMA. For example, chloride levels in Miller Creek, a trout stream located in Duluth, have also consistently exceeded the 230 mg/L standard in July and August.
Eagle Creek is located in the city of Savage (Scott County) near the Highway 13/Highway 101 crossroads and is a Class 2A cold-water trout stream, meaning that it is a self-producing trout stream and is primarily fed by groundwater year round. Chloride concentrations have always been below the chronic chloride water quality standard of 230 mg/L; however, chloride concentrations have increased over time. The median chloride concentration in 2012 was 36 mg/L, which is more than twice the median concentration in 2001, 16 mg/L (Increasing chloride concentrations in Eagle Creek from 2001-2012 chart).
Shingle Creek, a tributary to the Mississippi River, is an urban stream that runs through Brooklyn Park, Brooklyn Center, and Minneapolis. The creek typically has numerous exceedances of the 230 mg/L standard each year, particularly during winter months. However, average chloride levels in the stream during summer months have also increased over time (Figure 28). The estimated increase in average summer (July through October) chloride concentration in Shingle Creek from 1996 to 2014 was 53 mg/L, based on a linear regression. The increased chloride concentrations in Eagle and Shingle Creek, and likely many other streams in the TCMA, suggest that chloride from deicing activities is infiltrating into shallow groundwater, resulting in elevated chloride concentrations in streams during summer baseflow conditions.
Similar to other studies (Kelly 2008; Eyles et al. 2013; Corsi et al. 2015), streams in the TCMA and greater Minnesota are experiencing high chloride concentrations during summer baseflow conditions. This trend is attributed to high chloride concentrations in shallow groundwater discharging to streams as baseflow.
Summary of data analysis
Based on the water quality data collected and the above data analyses, the following conclusions can be made:
- Chloride use increased in the TCMA in the latter half of the 20th century, 1950-2000.
- Levels of chloride are continuing to increase in both groundwater and surface waterbodies in the TCMA.
- The highest chloride concentrations occur during snowmelt conditions during winter months and low flow periods in streams.
- Chloride levels tend to be higher in the bottom of a lake versus the surface.
- Chloride concentrations in TCMA waterbodies are positively correlated to road density in the contributing watersheds.
- There are existing data gaps of chloride concentrations in TCMA waterbodies, as many have limited to no data and lack data that would represent critical conditions.
- Winter maintenance activities in urban areas and WWTPs in rural areas tend to be the primary sources of chloride to TCMA waters.
This page was last edited on 23 November 2022, at 16:32.