TCMA Chloride Management Plan - TCMA Chloride Conditions - Condition status
This section describes the current status of water resources within the TCMA with respect to applicable chloride criteria. The status of surface waters including lakes, wetlands and streams is presented first. The status of groundwater resources is presented second.
View this section as a single page
Surface water
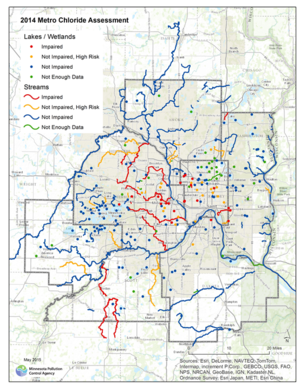
The MPCA’s approach to determining whether or not a stream, lake, or wetland is impaired by chloride relies on an assessment of available data. The MPCA conducted an assessment for chloride in the TCMA waterbodies in 2013. Two or more exceedances of the chronic criterion of 230 mg/L within a three-year period are considered an impairment. One exceedance of the acute criterion of 860 mg/L is considered an impairment. The 2013 TCMA chloride assessment resulted in 29 new chloride impairments (6 streams, 19 lakes, and 4 wetlands) added to the 2014 draft impaired waters list, resulting in a total of 39 chloride impairments in the TCMA. Shingle Creek and Nine Mile Creek were previously listed as impaired with completed chloride TMDLs. Approximately 11% of the 340 waterbodies assessed were determined to be impaired. An additional 38 (11%) were classified as high risk and 11% did not have enough data. High risk was defined as a waterbody having one sample in the last 10 years that was within 10% of the chronic criteria (207 mg/L). An interactive map showing assessed, impaired, not impaired, and high risk waters is on the MPCA Chloride Project website (MPCA Chloride Project Website Map of Assessments and Impairments). The assessed lakes, wetlands, and streams are shown on the 2014 Chloride Assessment Results in the TCMA map. The highest density of impairments is in the heavily urbanized area in Hennepin and Ramsey Counties, though three streams in the outlying suburban areas are also impaired by chloride. The chloride causing impairments in the streams in the outlying areas of the metro is largely effluent from the WWTPs, rather than deicing salt.
It is important to keep in mind that of the over 1,000 lakes, wetlands and streams in the TCMA, less than one-third had chloride data to make an assessment of impairment/attainment of water quality criteria. Also, of those waters with adequate data to make an assessment, only 30% were part of the TCMA Chloride Project monitoring program, which was developed to collect samples at critical times of the year and critical locations. As a result, data used to evaluate water quality conditions in waters not part of the TCMA Chloride Project monitoring program, may not have been representative of critical conditions. Critical times of the year for collecting chloride samples are typically during the winter snowmelt runoff (February through March) and during low flow periods, and critical areas for collecting chloride samples in a lake are near the bottom.
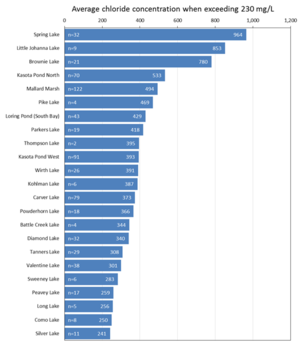
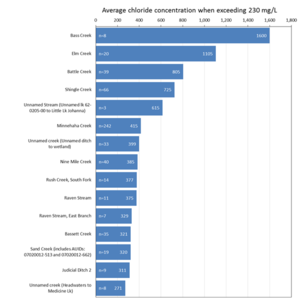
The impaired lakes, wetlands, and streams were compared by the concentrations of chloride ranked from highest to lowest concentrations. These rankings are presented in the Comparison of Impaired Lakes and Wetlands in the TCMA and the Comparison of Impaired Streams in the TCMA charts. These figures are not a direct reflection of the 303(d) listing assessment; they are intended to make a relative comparison of the extent of impairment across impaired waters. The values presented in these figures were calculated by identifying the maximum chloride concentration measured in a waterbody on individual sampling days, then averaging all individual sampling day maximums that exceeded the standard of 230 mg/L from 2003-2013. These figures indicate the variability in one waterbody or watershed to the next by the severity of the impairment. These rankings can be used by chloride users to prioritize management activities by area. Since only a portion of the TCMA waters have chloride monitoring data, the rankings can also be used to determine specific areas that are close to impaired and high-risk watersheds for further monitoring and higher levels of management.
Groundwater
Chloride concentrations in shallow groundwater are increasing, likely as a result of the application of deicing salt. This correlation is observed in a recent study by the MPCA, The Condition of Minnesota’s Groundwater, 2007-2011, which found that chloride concentrations were higher in wells sampled in urban areas, where salt is more commonly applied in winter months, compared to wells sampled in areas that were undeveloped (see table below).
Average chloride concentrations in groundwater based on land use
Link to this table
| Land Use | Chloride (mg/L) |
|---|---|
| Residential | 45 mg/L |
| Commercial/Industrial | 60 mg/L |
| Undeveloped | 15 mg/L |
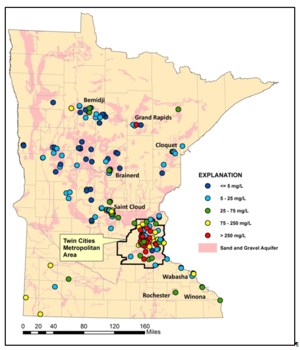
The median chloride concentration in sand and gravel aquifers in the TCMA was 86 mg/L, compared to a median concentration of 17 mg/L in sand and gravel aquifers outside the TCMA. Twenty-seven percent of sand and gravel monitoring wells in the TCMA had chloride concentrations greater than 250 mg/L, the secondary maximum contaminant level set by the EPA (Chloride concentrations in ambient groundwater from the sand and gravel aquifers map). Very few monitoring wells outside the TCMA (about 1%) had chloride concentrations exceeding 250 mg/L.
This page was last edited on 23 November 2022, at 16:32.


