Channel protection criteria (Vcp)
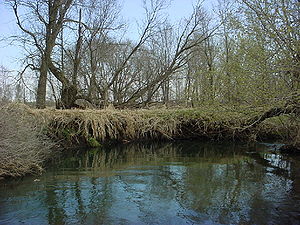
The purpose of channel protection criteria is to prevent habitat degradation and erosion in urban streams caused by an increased frequency of bankfull and sub-bankfull stormwater flows. Channel protection criteria seek to minimize downstream channel enlargement and incision that is a common consequence of urbanization (Schueler and Brown, 2004). As fields and forests are converted to impervious surfaces, the volume and frequency of runoff is increased significantly. Research indicates that urbanization causes channels to expand two- to ten-times their original size to adjust to the increased volume and frequency of runoff caused by impervious cover, as well as the increased conveyance efficiency of curbs, gutters and storm drains (CWP, 2003 and 2004).
Urban stream channel enlargement significantly impacts stream habitat, water quality and public infrastructure. Bank erosion sharply increases total annual sediment yield and nutrient loads as nutrient-rich floodplain soils are eroded and transported downstream. In addition, channel erosion degrades and simplifies stream habitat structure, which diminishes aquatic biodiversity. Lastly, channel erosion can cause severe damage to bridge, culvert and sewer infrastructure and loss of private property.
Historically, two-year peak discharge control has been the most widely applied local criteria to control channel erosion in Minnesota, and many communities continue to use it today. More specifically, two-year peak control seeks to keep the post-development peak discharge rate for the 2-year, 24-hour design storm at pre-development rates. The reasoning behind this criterion is that the bankfull discharge for most streams has a recurrence interval of between 1 and 2 years, with approximately 1.5 years as the most prevalent (Leopold, 1964 and 1994), and maintaining this discharge rate should act to prevent downstream erosion.
Recent research, however, indicates that two-year peak discharge control does not protect channels from downstream erosion and may actually contribute to erosion since banks are exposed to a longer duration of erosive bankfull and sub-bankful events (MacRae, 1993 and 1996, McCuen and Moglen, 1988). Consequently, two-year peak discharge control may have some value for overbank flood control, but is not effective as a channel protection criterion, since it may actually reach peak flow that is too high and extend the duration of erosive velocities in the stream and increase downstream channel erosion. Communities may wish to drop two-year peak discharge control if they also need 10-year peak discharge control for overbank flooding when they adopt or revise stormwater ordinances as part of NPDES Phase II MS4 permits.
There are currently no state requirements to provide channel protection for regular waters, although a few local reviewing authorities have recently adopted channel protection criteria. Communities are encouraged to adopt new channel protection criteria (and eliminate two-year peak discharge control requirements) when they revise or adopt local stormwater ordinances to comply with municipal NPDES permits.
The state construction General Permit (CGP) references an “enhanced runoff control” criterion wherein the post-development runoff rate and volume need to be maintained for both the one-year 24-hour and two-year 24-hour storm. This criterion could have some channel protection applicability. The criterion only applies to a very restricted subset of special waters designated in the CGP permit, including
- wilderness areas;
- trout lakes;
- lake trout lakes; and
- scientific and natural areas.
The options suggested in the CGP for controlling temperature could also help reduce channel volume by infiltrating or otherwise controlling discharges to trout streams.
The recommended channel protection criteria described next should satisfy the CGP channel protection criterion. Channel protection is also highly recommended for trout streams and certain discharge situations to lakes and wetlands.
The recommended channel protection criterion is to provide 24 hours of extended detention for the runoff generated from the 1-year 24-hour design storm. This runoff volume generated is stored and gradually released over a 24-hour period so that critical erosive velocities in downstream channels are not exceeded over the entire storm hydrograph. As a very rough rule of thumb, the storage capacity needed to provide channel protection is about 60 to 65 percent of the one-year storm runoff volume. The rainfall depth for the one-year, 24-hour storm varies across the State, but can be inferred from intensity-duration-frequency [IDF] curves. The one-year, 24-hour rainfalls range between 1.8 and 2.5 inches across the State of Minnesota. Maximum extended detention time should be limited to 12 hours in trout streams to minimize stream warming, provided erosive velocities can be avoided. Channel protection has recently been adopted by the States of Maryland, New York, Vermont, and Georgia, and is relatively easy to compute at most development sites using existing hydrologic design models. The recommended criterion reduces the magnitude and duration of highly erosive stream channel velocities which should help to reduce downstream channel erosion.
For those wishing more in-depth analysis of channel protection flows, the following option could be used. The State of Washington (2004) has adopted an extremely stringent channel protection criterion that requires the duration of post-development peak stormwater discharges match pre-development durations for the entire range of storms between 50 percent of the one-year storm and the 50-year event. Designers must use a continuous hydrologic simulation model (HSPF, e.g.) to demonstrate compliance. As of 2004, hydrologic models such as TR-55 or P-8 that employ single event design storms are no longer allowed in Washington for design purposes. The goal of the peak duration matching criteria is to exactly replicate the pre-development frequency of peak discharge rates for all storm events that should provide a high level of channel protection. This approach was considered by the Manual Sub-Committee, but recommended only as an option because of the high cost of implementation.
Finally, a special study was undertaken in the Manual Version 2.0 revisions to look at the potential for cumulative peak flows released from detention BMPs to occur in an urban watershed. The parameters of the study focused on a 450 acre developing watershed within an urban area and the placement of detention BMPs in five sub-watersheds scattered within the larger basin. The results showed that when the design specifics contained in the Minnesota Stormwater Manual are used, there will not be an elevated cumulative flow that results. Further analysis showed that for this condition to result in the test watershed, releases from BMPs would have to occur before the passage of the overall watershed peak flow, a situation that would not occur under the Manual design. Some caution should be exercised when considering the likelihood of cumulative flows for large watersheds, where there might be a primary peak flow from near-source areas, followed by a secondary peak as the rest of the watershed contributes. In larger watershed situations, similar modeling for near, medium and far sub-watershed inflows should be undertaken.
As part of Version 2.0 revisions to the Manual, a special study was undertaken to also evaluate a rate control recommendation from the MPCA’s Protecting Water Quality in Urban Areas (2000). This document recommmneds using ½ of the peak runoff rate from the 2-year, 24-hour pre-development event. An analysis of this showed that it does, in fact, result in slightly less erosion potential than the 1-year, 24-hour extended detention noted above under worst case wet years. Use of either method should result in adequate channel protection.
This review also resulted in a recommendation that the method of considering instantaneous inflow of the entire runoff volume into the BMP facility not be used for purposes of routing the channel protection volume. Routing or modeling of inflow and outflow gives a more accurate representation of actual flow. The instantaneous volume method will, however, continue to be used by the state for implementation of water quality storage requirements under the construction General Permit. The instantaneous volume method can also be used as a first-cut estimation of the maximum amount of channel protection storage volume that will be needed since it will give a conservatively high estimate of this volume.
Contents
Estimating channel protection storage volume
This discussion provides an easy method of determining the maximum amount of storage needed for the channel protection volume. This approach should only be used to determine that maximum volume since it results in a conservative volume estimate.
Channel protection method for ponds
- Step 1: Compute the runoff volume produced from the post-development 1-year, 24-hour design storm event, using TR-55, or equivalent.
- Step 2: Assume the pond volume above the permanent pool instantaneously fills up. Note again that this will result in an estimate of the maximum volume needed and should only be used as a conservative preliminary estimate. Determine storage volume and Vcp maximum invert elevation using the short-cut method (described below).
- Step 3: :Set the Vcp orifice invert at the permanent pool elevation and size initial diameter to drain the entire Vcp volume in 24 hours
- Step 4: Compute the average peak discharge rate for the Vcp event (i.e., Vcp/24)
- Step 5: Using TR-20, or equivalent, route the runoff through the pond and check to make sure that peak discharge for Vcp does not exceed twice the average discharge.
- Step 6: Evaluate whether Vcp meets water quality (live storage) requirements.
- 6a. Compute the runoff volume for live storage using appropriate MPCA pond sizing equation.
- 6b. Assume live storage volume instantaneously fills above the permanent pool. The approach of instantaneously filling storage results in an estimate of the maximum storage volume; that is, no outflow is assumed during the filling process.
- 6c. Using TR-20, or equivalent, route the live storage volume through the channel protection orifice to ensure it satisfies the 5.66 cubic feet per second per surface-acre-of-the-full-water-quality-pool release.
- 6d. If the answer is YES (as it will be in most cases), the Vcp will be considered to meet the live storage requirement for water quality (Vcp can be substituted for live storage volume).
- 6e. If the answer is NO (which may rarely happen for very low density development sites in sensitive waters), then designers gradually reduce the Vcp orifice to meet minimum Vwq release requirements, and repeat steps 3 to 6. If new answer is YES, then Vcp will again be considered to meet live-storage water quality requirement.
- 6f. If answer is NO, then the designer must account for Vwq and Vcp separately, and designed using two separate orifices.
- Step 7 (optional): For areas with 1-year and 2-year peak controls use TR-20 or equivalent to route the 2-year storm through the Vcp orifice. Check 2-year peak rate of discharge. If discharge is equal to or less than pre-development discharge rates, then outlet sizing is complete. If not, then raise the elevation of the Vp10 to an elevation that fully contains the volume of the 2-year storm below the Vp10 orifice and re-route the flows as a check. (This is rarely needed since two-year peak discharge control is usually waived when Vcp is provided).
Channel protection method for non-pond BMPs
Note: No permanent pool is involved in design (although a micropool is recommended to keep orifice from clogging).
In most cases, an extended detention basin is incorporated into the treatment train after the non-pond BMP to provide storage for channel protection and flood control design storms. In some cases, temporary channel protection storage can be incorporated into the non-pond BMP if adequate pretreatment is provided, and if an outlet structure is sized to ensure that the infiltration or filtration basins are empty 48 hours after the storm (e.g., infiltration basin or bioretention in the pond floor).
Channel protection within the extended detention pond is designed following Steps 1 to 5, as outlined above.
Additional notes:
- It is strongly recommended that two-year peak discharge control be waived when channel protection is provided.
- The effect of channel protection on total required volume of stormwater storage is modest when the local reviewing authority already requires 50- or 100-year peak discharge control.
Shortcut sizing for channel protection
This method presents the TR-55 “short-cut” sizing technique, used to size practices designed for extended detention, slightly modified to incorporate the flows necessary to provide channel protection.
Storage volume estimation
This section presents a modified version of the TR-55 (NRCS, 1986) shortcut sizing approach. The method was modified by Harrington (1987) for applications where the peak discharge is very small compared with the uncontrolled discharge. This often occurs in the 1-year, 24-hour detention sizing.
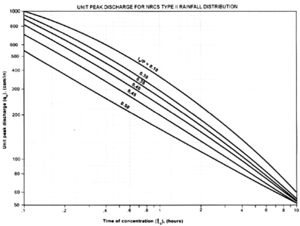
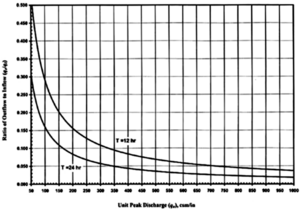
Using TR-55 guidance, the unit peak discharge (qu) can be determined based on the curve number and time of concentration. Knowing qu and T (extended detention time), qo/ qi (peak outflow discharge/peak inflow discharge) can be estimated from a plot of detention time versus discharge ratios (see figures on right).
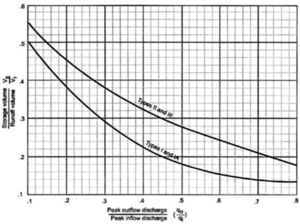
Then using q0/qi, we can estimate Vs/Vr (see figures on right). For a Type II or Type III rainfall distribution, Vs/Vr can also be calculated using the following equation
\(V_s/V_r = 0.682 – (1.43 (q_o/q_i)) + (1.64 (q_o/q_i)^2) – (0.804 (q_o/q_i)^3)\)
where
- Vs = required storage volume (acre-feet);
- Vr = runoff volume (acre-feet);
- qo = peak outflow discharge (cfs); and
- qi = peak inflow discharge (cfs).
The required storage volume can then be calculated by
\(V_s = (V_s/V_r)(Q_d)(A) / 12\)
where:
- VSubscript text and Vr are defined above;
- Qd = the developed runoff for the design storm (inches); and
- A = total drainage area (acres).
Channel protection criteria evaluation
The Channel Protection method currently recommended in version 1.1 of the Minnesota Stormwater Manual (MN Manual) for the design of wet detention ponds is to detain the post-development runoff from a 1-year, 24-hour storm event to be released over a 24-hour period. Another channel protection method recommended in MPCA’s (2000) Protection of Water Quality In Urban Areas and applied in Washington state suggests wet-detention pond discharge at ½ of the peak discharge from the pre-development 2-year, 24-hour storm event.
The two design methods are compared to evaluate their respective effectiveness. If warranted, updates to the Minnesota Stormwater Manual will be recommended based on the results of the analysis.
Methodology
A wet-detention pond for analysis of the two channel protection criteria was sized for a generic but typical development, consistent with the requirements of the Minnesota Construction General Permit (CGP). The generic subwatershed characteristics typical of an urban area development and used in the modeling exercise are defined in the table below.
Subwatershed and channel characteristics
Link to this table
| Status | Total area (ac) | Sub-area (ac) | Land Use | Channel Width (feet) | Slope % | Capillary Suction (inch) | Initial Soil Deficit | Saturated Hydraulic Conductivity (Inch/hr) | Depression Storage (Inch) |
|---|---|---|---|---|---|---|---|---|---|
| Pre-development | 50 | - | Agriculture - undeveloped mix | 400 | 0.01 | 8 | 0.3 | 0.15 | 0.05 |
| Post-development | 50 | - | Low to medium density residential | 700 | 0.01 | 8 | 0.3 | 0.15 | - |
| Pervious | 50 | 30 | Low to medium density residential | 700 | 0.01 | 8 | 0.3 | 0.15 | 0.05 |
| Impervious (-40%) | 50 | 20 | Low to medium density residential | 700 | 0.01 | 8 | 0.3 | 0.15 | 0.3 |
Wet detention pond sizing was performed in accordance with the methodology outlined in the MN Manual (version 1.1, revised in 2006). A total of four wet-detention ponds were designed using the following design events:
- 1-yr 24-hr Instantaneous volume1 design (K124)
- 1-yr 24-hr routed2 design (R124)
- ½ the pre-development 2-yr 24-hr runoff peak Instantaneous volume design (K224)
- ½ the pre-development 2-yr 24-hr runoff peak routed design (R224)
1This refers to the simultaneous introduction of the entire runoff volume into a pool at once.
2”Routed” through the use of a detailed hydrologic model, such as XP-SWMM which was used in this exercise
Applying the sizing criteria outlined in the manual, the water quality, channel protection, over bank flood protection, and the 100-year extreme flood protection volumes were calculated. The tables below summarize the watershed runoff response and the resulting uniform sizing volumes for pre and post-development conditions.
Watershed runoff characteristics
Link to this table
| Given: | |||
|---|---|---|---|
| Area = | 50 | ac. | total watershed area in acres draining to pond |
| IC = | 20 | ac. | new impervious area in acres (40%) |
| Watershed peak discharge and runoff volume: | |||
| Event | Pre-development | Post-development | Unit |
| Q1-yr 24-hr | 6.7 | 53.5 | cfs |
| Q2-yr 24-hr | 11.6 | 69.0 | cfs |
| Q10-yr 24-hr | 36.7 | 131.9 | cfs |
| Q100-yr 24-hr | 81.8 | 222.0 | cfs |
| V1-yr 24-hr | 0.3 | 3.9 | ac-ft |
| V2-yr 24-hr | 0.6 | 4.9 | ac-ft |
| V10-yr 24-hr | 3.1 | 8.9 | ac-ft |
| V100-yr 24-hr | 7.5 | 14.7 | ac-ft |
Pond design sizing criteria
Link to this table
| Event | Pre-development | Post-development | Unit |
|---|---|---|---|
| Vpp | 2.1 | ac-ft | Permanent pool volume (0.5" X 50 acres) |
| Vwq | 0.8 | ac-ft | Water quality volume (0.5" X 50 acres) |
| Vts | 2.9 | ac-ft | Total storage volume (Vpp + Vwq |
| Vcp | 3.9 | ac-ft | Channel protection volume (includes water quality volume) |
| V10 | 8.9 | ac-ft | Over bank flood protection volume |
| V100 | 14.7 | ac-ft | Extreme flood volume |
The pond sizing methodology applied for evaluation of ½ the pre-development 2-year 24-hour event was similar (applied the same water quality, over bank protection, and extreme event volume criteria) with the exception of the channel protection outlet. The channel protection outlet was sized to restrict release of the 2-year 24-hour event to ½ the pre-development peak discharge from the 2-year 24-hour storm event.
The design calculations resulted in the pond stage and storage shown in the table below.
Pond stage / storage
Link to this table
| Elevation | Side slope height per 1" vertical | Area | Incremental volume | Cumulative volume | Volume above permanent pool | Voume requirement / treatment level | ||
|---|---|---|---|---|---|---|---|---|
| Feet | feet | acres | ac-ft | ac-ft | ac-ft | |||
| 100 | 3 | 0.333 | N/A | 0 | N/A | |||
| 101 | 3 | 0.363 | 0.3 | 0.3 | N/A | |||
| 102 | 3 | 0.394 | 0.4 | 0.7 | N/A | |||
| 103 | 3 | 0.427 | 0.4 | 1.1 | N/A | |||
| 104 | 10 | 0.461 | 0.4 | 1.6 | N/A | |||
| 105 | 10 | 0.583 | 0.5 | 2.1 | N/A | Vpp | 2.1 | ac-ft |
| 106.3 | 3 | 0.764 | 0.9 | 3.0 | 0.9 | Vwq | 2.1 | ac-ft |
| 107 | 3 | 0.796 | 0.5 | 3.5 | 1.4 | Vts | 2.9 | ac-ft |
| 109.9 | 3 | 0.933 | 2.5 | 6.0 | 3.9 | Vcp | 3.9 | ac-ft |
| 112 | 3 | 1.039 | 2.1 | 8.1 | 6.0 | |||
| 114.7 | 10 | 1.184 | 3.0 | 11.1 | 9.0 | V10 | 8.9 | ac-ft |
| 116 | 10 | 1.437 | 1.7 | 12.8 | 10.7 | |||
| 118.4 | 1.967 | 4.1 | 16.9 | 14.8 | V100 | 14.7 | ac-ft | |
The scenarios presented for the Channel Protection Volume exceed the base CGP requirement for Water Quality Volume. The discharges from the four scenarios were checked to verify that they all met the CGP requirement of not more than 5.66 cubic feet per second (cfs) per surface acre of the full Water Quality pool. This criterion applies to the drainage into the Water Quality pool, which equates to the runoff from ½ inches over the entire drainage basin, plus ½ inches from the new 20 acre impervious area for non-Special Waters of the State. The table below reflects the runoff from the 1-year (2.4 inches) and 2-year (2.8 inches) rainfall events, which are substantially more than the Water Quality pool sizing criteria, hence the values exceeding the base requirement (5.66 cfs x 0.9 acres from the bottom of the 10-yr pool in Wet detention pond - Over bank protection (10-year 24-hour) outlet configuration table = 5.1 cfs).
The relative channel erosive potential of the four wet detention ponds resulting from the 1-year and ½ the 2-year design criteria were evaluated for a wet season. The year 2002 hourly precipitation from Flying Cloud Airport, CITY, was simulated in XP-SWMM to represent the pond performance in a wet year.
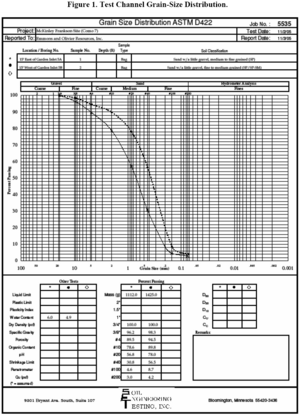
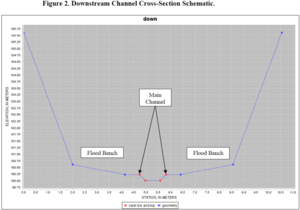
Discharge from the XP-SWMM 2002 continuous simulation became input into the erosion model CONCEPTS (Conservation Channel Evolution and Pollutant Transport System, U.S. Department of Agriculture, Agricultural Research Service, Research Report No. 16, E.J. Langendoen, 2000). The CONCEPTS model requires hydraulic, soils, and channel data for a simulation. The output from the XP-SWMM model was converted to cubic meters per second and put into the proper format for CONCEPTS. The bed and bank material was assumed to be: sand with gravel, medium- to fine-grained (SP). The hypothetical channel was designed as a two-stage channel, whereby approximately the 2-year flow was handled by the main channel and the 100-year flow was allowed to flood a secondary bench and channel conveyance area.
Considering the idealized channel cross-section (see figure to right), note that artificial sides from horizontal station 0 to 2 meters and from 8.5 to 10.5 meters were added in the unlikely event the modeled stage exceeded the flood bench elevations. Channel bank side slopes were 1H:1V while the floodplain side slopes were 2H:1V. Three cross sections were modeled at 0, 0.5, and 1 kilometer longitudinal stations at a 0.5 percent slope. Because of the fairly short duration modeling time (May to October, 2002), the channel was modeled to be fairly erodible so that differences in erosion caused by the different flow regimes would be apparent. The only change between the different scenarios modeled in CONCEPTS was the flow input file. The total change in cross-section at the mid-point and the total sediment load over the course of the simulation were examined and are reported in a subsequent section. The model is capable of simulating bank failure, but this feature was not selected so that only bed erosion and sediment transport were simulated to accentuate the downcutting versus side-slope failure aspect of the erosion.
Note that according to the RFP, only the results for the wet year 2002 are reported. This will have some bearing on the conclusions that can be drawn relative to normal and dry years. The wet year scenario is considered a worst case situation.
Results/Discussion
Overall, differences in the four pond designs are noticeable between the “routed” design and the Instantaneous volume design methods. In all cases, the Instantaneous volume design volumes will be greater in size because they involve input of the entire runoff volume at once without outflow during accumulation. The routed option includes continually outflowing water concurrent with the runoff volume filling the pond. This difference contributes, for example, to the 1-year Instantaneous volume having a higher discharge than the routed based on a less constricted orifice to pass the stored volume. For the ½ 2-yr scenario, the outflow orifice is adjusted to meet the peak matching requirement, so the orifice sizes are different but the peak discharge values are the same (5.8 cfs or ½ of 11.6 cfs pre-development 2-year peak).
The Wet detention pond - Over bank and extreme flood protection (10-year 24-hour) outlet configuration tables (shown below) are included to show the progression of design steps as the complete pond is modeled. The most critical finding of this exercise is that the Instantaneous volume method for both the 1-year and ½ 2-year scenarios results in twice the size of pond than the routed method at more than 6 feet greater HWL. This is simply because of the more realistic approach that the routed method uses to release water as the pond is filling rather than assuming that all of the water collects before any discharge occurs. Since most designs done today use sophisticated computer programs, such as XP-SWMM, language in the updated Manual should recommend that routed methods be used to more realistically portray pond design and behavior. If a conservative answer is desired, the Instantaneous volume method could be selected
Wet detention pond - Channel protection / water quality outlet configuration
Link to this table
| Design methodology | ||||
|---|---|---|---|---|
| 1-yr 24-hr Instantaneous volume | 1-yr 24-hr routed (R124) | 1/2 Pre-development 2-yr 24-hr peak Instantaneous volume | 1/2 Pre-development 2-yr 24-hr peak routed (R224) | |
| Orifice diameter (inches) | 10.5 | 6.9 | 10.0 | 11.6 |
| Oriface elevation (ft) | 105.0 | 105.0 | 105.0 | 105.0 |
| Surface area at orifice elevation (ac) | 0.6 | 0.6 | 0.6 | 0.6 |
| Peak discharge per design event (cfs) | 6.4 | 2.1 | 5.8 | 5.8 |
| Peak water elevation per design event (ft) | 107.9 | 108.2 | 108.7 | 108.5 |
Note that the routed method for the 1-year design (R124) is much less than the Instantaneous volume due to the more constricted orifice.
Wet detention pond - Over bank protection (10-yr 24-hr) outlet configuration
Link to this table
| Design methodology | ||||
|---|---|---|---|---|
| 1-yr 24-hr Instantaneous volume | 1-yr 24-hr routed (R124) | 1/2 Pre-development 2-yr 24-hr peak Instantaneous volume | 1/2 Pre-development 2-yr 24-hr peak routed (R224) | |
| Weir length (ft) | 0.8 | 3.7 | 0.8 | 4.8 |
| Weir elevation (ft) | 109.2 | 108.2 | 109.9 | 108.6 |
| Surface area at weir elevation (ac) | 0.9 | 0.9 | 0.9 | 0.9 |
| Peak discharge per design event (cfs)1 | 36.7 | 36.0 | 36.7 | 36.4 |
| Peak water elevation per design event (ft) | 114.7 | 110.2 | 114.77 | 110.1 |
1Because the 10-year flow rate is designed to match the pre-development peak, the values in this row should be all less than or equal to 36.7 cfs.
Wet detention pond - Extreme flood (10-yr 24-hr) outlet configuration
Link to this table
| Design methodology | ||||
|---|---|---|---|---|
| 1-yr 24-hr Instantaneous volume | 1-yr 24-hr routed (R124) | 1/2 Pre-development 2-yr 24-hr peak Instantaneous volume) | 1/2 Pre-development 2-yr 24-hr peak routed (R224) | |
| Weir length (ft) | 3.0 | 3.9 | 3.1 | 4.6 |
| Weir elevation (ft) | 114.72 | 110.2 | 114.7 | 110.1 |
| Surface area at weir elevation (ac) | 1.2 | 0.9 | 1.2 | 0.9 |
| Peak discharge per design event (cfs)1 | 81.8 | 81.5 | 81.8 | 81.4 |
| Peak water elevation per design event (ft) | 118.4 | 112.0 | 118.4 | 111.8 |
| Designed surface area at HWL (ac) | 2.01 | 1.0 | 2.0 | 1.0 |
1Note that the Instantaneous volume method requires twice the surface area (4 percent vs 2 percent of drainage area) and about 6 more feet of storage depth than the routed method for this design event. This is the result of introducing the entire event volume at once versus the more realistic routing of inflow and outflow.
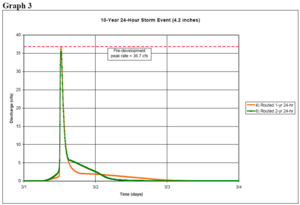
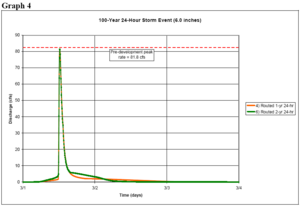
Graphs 1-4 illustrate the hydrographs for the 1-year, 2-year, 10-year and 100-year events for the routed designs. The Instantaneous volume scenarios are not included because they are not routed. Attention for this task is placed on the smaller events wherein flow generally stays below or close to bank-full. The 10-year and 100-year events will exceed bank-full.
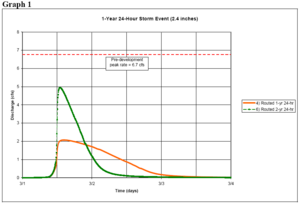
In Graph 1, a horizontal line portrays the pre-development discharge level of 6.7 cubic feet per second (cfs). Both peaks are less than the pre-development peak. The 1-year design scenario begins discharging water as soon as it starts to flow into the pond, peaks at 2.1 cfs and then de-waters in 24 hours after the last inflow occurs. Although the duration of flow extends well beyond that of the ½ 2-yr scenario design, the peak flow is well below half.
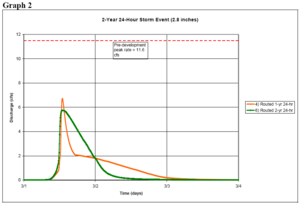
Graph 2 illustrates a 2-year event for the routed scenarios and shows how the ½ 2-year requirement is met (1/2 of the pre-development peak of 11.6 cfs = 5.8 cfs). The 1-year design scenario has a higher peak (in this case about 6.5 cfs) because more water flows over the weir due to the constricted orifice; that is, the 1-year design configuration is exceeded. Again for both design scenarios, less than pre-development peak flow is maintained.
Graph 3 shows the behavior from a 10-year event where flow entering the pond greatly exceeds the two design scenario assumptions. In this case, flow is well over the orifices and weirs installed for the 1- and 2-year events. In spite of this, both designs keep peak flow close to pre-development levels. Graph 4 shows similar behavior for the 100-year event.
The tables below present the results of running the four design scenarios as presented in previous tables for the 1-, 2-, 10- and 100-year events, ranging from 2.4 to 6.0 inches. The first table below shows the High Water Level (HWL) that would be reached for each of the design rainfall events. Note that the Instantaneous volume approach would result in a depth of about 2 feet greater than the routed methods. The second table displays the peak discharge rates that result from the four design scenarios. The higher rates for the R124 design for the events greater than 1-year are again reflecting the constricted orifice and the movement of more water over the weir as a result. In all cases in this table, flow rates are less than or nearly equal to pre-development conditions.
The current Manual recommendation for the 1-year 24-hour channel protection criteria resulted in the most restrictive outlet for the “routed” option. This results in the lowest peak discharge for the 1-year 24-hour design event (2.1 cfs), but in a slight exceedance for the 2-year event. Peak discharges for the larger design events (2-year 24-hour and greater) increase for the same pond. The tail of the hydrograph for this design was longer than the ½ 2-year design for both the 1-year and 2-year events (Graphs 1 and 2). The implication of this behavior for downstream channel erosion is discussed in a later section.
Generally, the benefit of the reducing peak flow below the pre-development level is that it can bring flow below the shear stress level of some streams, and in these modeled cases, brings flow below pre-development conditions, which was the goal expressed in the current Manual. However, the actual benefit needs to be determined on a case-by-case basis depending upon factors such as soil type, channel slope and flow velocity. That is, either of the control options (1-year or ½ 2-year) produces the desired result of lower peak, but exposes the base channel to higher flow than pre-development because of the slower release of stored water.
High water level (feet)
Link to this table
| Elevation (ft) in pond based on different outlet configurations | ||||
|---|---|---|---|---|
| Design rainfall event | 1-yr 24-hr Instantaneous volume | 1-yr 24-hr routed (R124) | Development 2-yr 24-hr peak Instantaneous volume | Development 2-yr 24-hr peak routed (R224) |
| 1-yr 24-hr (2.4 inches) | 107.9 | 108.2 | 107.9 | 107.8 |
| 2-yr 24-hr (2.8 inches) | 108.7 | 108.7 | 108.7 | 108.5 |
| 10-yr 24-hr (4.2 inches) | 111.3 | 110.2 | 111.3 | 110.1 |
| 100-yr 24-hr (6.0 inches) | 113.8 | 112.0 | 113.9 | 111.7 |
Peak discharge (cfs)
Link to this table
| Outflow rate (cfs) based on different outlet configurations | |||||
|---|---|---|---|---|---|
| Design rainfall event | Pre-development | 1-yr 24-hr Instantaneous volume | 1-yr 24-hr routed (R124) | Development 2-yr 24-hr peak Instantaneous volume | Development 2-yr 24-hr peak routed (R224) |
| 1-yr 24-hr (2.4 inches) | 6.7 | 4.22 | 2.1 | 3.9 | 4.9 |
| 2-yr 24-hr (2.8 inches) | 11.6 | 4.9 | 6.7 | 4.5 | 5.7 |
| 10-yr 24-hr (4.2 inches) | 36.7 | 11.2 | 36.8 | 11.0 | 35.5 |
| 100-yr 24-hr (6.0 inches) | 81.8 | 29.1 | 81.5 | 29.1 | 81.4 |
Peak discharge (cfs) during a wet year (2002)
Link to this table
| Design rainfall event | Pre-development | 1-yr 24-hr Instantaneous volume | 1-yr 24-hr routed (R124) | Development 2-yr 24-hr peak Instantaneous volume | Development 2-yr 24-hr peak routed (R224) |
|---|---|---|---|---|---|
| 2002 | 14.4 | 6.72 | 19.8 | 6.5 | 16.3 |
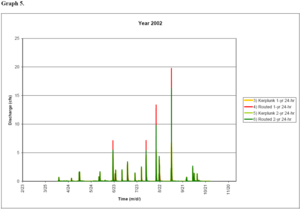
The peak discharge from the ponds simulated during the (wet) year 2002 are summarized in the previous table and illustrated in Graph 5. Graph 5 shows that the R124 design consistently exceeds all other design peak discharges for large events (yielding over 5 cfs). In most cases, the R224 design follows at about 70 to 80 percent of R124. This implies that designing for the 1-year option currently contained in the Manual will yield higher peak flow during a wet year than using ½ of the 2-year design. A similar statement cannot be made for a normal or dry year because this analysis was only run for 2002, a wet year.
The Instantaneous volume design scenarios yield markedly lower peak rates, but this approach is overly conservative, not reflective of today’s design practices and results in a much over-sized pond, and is therefore not recommended
It is important to note that the highest pre-development peak (14.4 cfs) is exceeded throughout 2002 by the routed events. The R124 and R224 designs are geared to the smaller (1- to 2-year events) and cannot be expected to keep peak flows at pre-development rates for larger events, particularly during a wet year when available storage might not be available.
CONCEPTS erosion modeling results
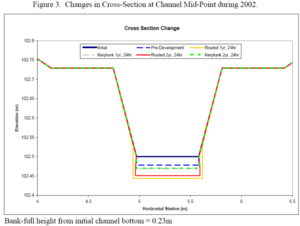
The CONCEPTS erosion prediction model was run based on the output of the wet year 2002 (about 36 inches from March-October at Flying Cloud Airport) runoff modeling. The figures below shows the change in cross-section at the modeled channel midpoint (0.5 kilometer) in response to annual flows during 2002. Note that the channel is small because it is sized to handle only the theoretical modeled watershed for purposes of analyzing the impact of various runoff scenarios on the channel.
Tabular results from three events during the 2002 modeled period are presented in the table below. This table displays three “snapshot” events (2.85 inches, 2.76 inches and 3.63 inches, respectively) and tabulates the entire 2002 period modeled in the total column. Note that the units of flow differ from XP-SWMM based on the CONCEPTS format. Information is presented in the table for peak flow rate, change in the width of channel bottom, change in the depth of the thalweg (stream centerline), sediment yield and water depth.
Tabular results from three events during the 2002 modeled period
Link to this table
| Results at 0.5 KM | |||||
|---|---|---|---|---|---|
| 6/21/2002 | 8/16/2002 | 9/5/2002 | Total | ||
| Pre-Dev | Peak flow rate (cms) | 0.164 | 0.197 | 0.376 | - |
| K124 | Peak flow rate (cms) | 0.134 | 0.152 | 0.262 | - |
| R124 | Peak flow rate (cms) | 0.422 | 0.362 | 0.550 | - |
| K224 | Peak flow rate (cms) | 0.125 | 0.140 | 0.182 | - |
| R224 | Peak flow rate (cms) | 0.428 | 0.256 | 0.662 | - |
| Pre-Dev | Change in width (m) | 0.000 | 0.000 | 0.000 | 0.000 |
| K124 | Change in width (m)) | 0.000 | 0.000 | 0.000 | 0.000 |
| R124 | Change in width (m) | 0.000 | 0.000 | 0.000 | 0.000 |
| K224 | Change in width (m) | 0.000 | 0.000 | 0.000 | 0.000 |
| R224 | Change in width (m) | 0.000 | 0.000 | 0.000 | 0.000 |
| Pre-Dev | Change in Thalweg depth (m) (net dewnward erosion) | -0.002 | -0.013 | -0.006 | -0.022 |
| K124 | Change in Thalweg depth (m) (net dewnward erosion) | -0.001 | -0.002 | 0.001 | -0.039 |
| R124 | Change in Thalweg depth (m) (net dewnward erosion) | 0.008 | -0.006 | -0.009 | -0.056 |
| K224 | Change in Thalweg depth (m) (net dewnward erosion) | -0.011 | -0.003 | -0.006 | -0.026 |
| R224 | Change in Thalweg depth (m) (net dewnward erosion) | -0.003 | -0.003 | -0.005 | -0.037 |
| Pre-Dev | Sediment yield (1000 kg) | 3.120 | 4.798 | 6.163 | 19.66 |
| K124 | Sediment yield (1000 kg) | 3.737 | 1.589 | 7.473 | 43.42 |
| R124 | Sediment yield (1000 kg) | 5.819 | 5.907 | 11.260 | 51.13 |
| K224 | Sediment yield (1000 kg) | 1.341 | 1.545 | 4.331 | 35.77 |
| R224 | Sediment yield (1000 kg) | 7.846 | 5.540 | 6.959 | 37.62 |
| Pre-Dev | Change in water depth (m) | 0.259 | 0.285 | 0.368 | - |
| K124 | Change in water depth (m) | 0.241 | 0.261 | 0.287 | - |
| R124 | Change in water depth (m) | 0.267 | 0.369 | 0.430 | - |
| K224 | Change in water depth (m) | 0.232 | 0.247 | 0.282 | - |
| R224 | Change in water depth (m) | 0.268 | 0.331 | 0.411 | - |
K124 = Instantaneous volume 1 yr, 24 hr
K224 = Instantaneous volume 1/2 2 yr, 24 hr
R124 = Routed 1 yr, 24 hr
R224 = Routed 1/2 2 yr, 24 hr
The “initial” condition (see figure to right) represents the starting point for the modeling year with no erosion. The “pre-development” line shows that some erosion occurs (about 0.02 meters or 0.8 inches) even under pre-development conditions with no development. The routed 1 year, 24 hour (R124) design results in the most channel incision (about 0.06 meters or 2.2 inches) for the scenario modeled, consistent with the highest peak flow noted in the table above and the series of modeled events portrayed in Graph 5. The width of the bottom “cut” is also larger than the other design scenarios by about 0.09 meters (3.5 inches). Also note particularly in Graphs 1 through 4 that R124 extends the duration of flow for those particular precipitation events. The erosion is likely caused by a combination of relatively higher peak flows and extended duration of runoff, resulting in the highest sediment yield of the design options. The table above shows an increase over pre-development sediment yield conditions of 31,470 kilograms (about 31 tons) for the wet year 2002 for the entire modeled 1 kilometer reach.
The routed ½ 2-yr design (R224) is only slightly less erosive (0.02m or 0.8 inches) than the R124 scenario. The R224 design also results in a narrower bottom cut than the R124 design. The R224 design had the second greatest peak runoff rates for 2002 and the tail of its hydrograph for individual events (Graphs 1 through 4) is generally of shorter duration than the R124 approach. The R224 design results in an increase of 17,960 kilograms (17.7 tons) over pre-development sediment yield.
The Instantaneous volume design options were modeled even though they are not recommended. There is essentially no difference in the Instantaneous volume options over the entire modeled year.
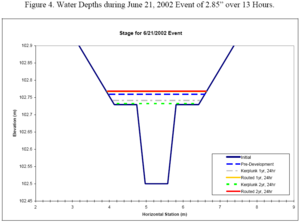
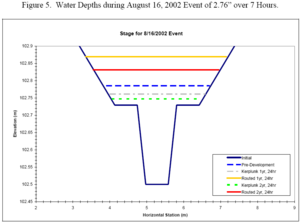
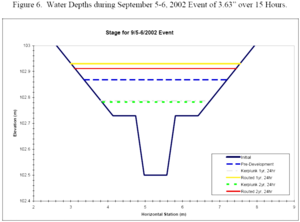
The figures to the right illustrate the water depth changes for the three highlighted events during 2002. Again note that the channels are purposely small to reflect only the results of the modeled watershed and that the horizontal scale changed from the previous figure. All water depths exceeded bank-full flow onto the flood bench.
The 6/21/2002 event portrayed shows essentially the same water depth for the R124 and R224 designs, exceeding bank-full and only slightly higher than pre-development conditions. This event totaled 2.85 inches over a period of 13 hours.
Figures to the right show some differences between the R124 and R224 levels. In both cases, the R124 design results in greater water depth beyond bank-full than the R224 design. The 8/16/2002 event totaled 2.76 inches over 7 hours. This event resulted in the greatest difference (0.04 meters or 1.5 inches) in water depth between R124 and R224. The 9/5-6/2002 event was a 3.63 inches event in two episodes over 15 hours. This event resulted in only a slight difference (0.019 meters or 0.75 inches) between the two routed designs.
The water depth results are consistent with previous findings favoring the ½ 2-year design over the 1-year, 24 hour extended detention design, but not by a large margin. The combination of deeper downward cutting, higher sediment yield and greater water depth for the R124 option tends to favor use of the ½ 2-year pre-development peak matching approach. Consistent with previous findings, the Instantaneous volume designs generally result in reduced erosion because they involve conservative over-design based on the instantaneous need to store the entire event volume. If a conservative approach is desired, the Instantaneous volume approach could be used. However, it is recommended that a routed design approach be used as a better depiction of reality and because techniques available to designers can easily accommodate the added complexity.
Conclusions
- The “Instantaneous volume” method of design assumes that the entire runoff event volume is instantaneously present in the pond at the conclusion of the runoff event. This results in a higher than realistic (conservative) volume because no outflow is assumed while the volume collects in the pond. The “routed” method is more reflective of current practice in that it uses simple to sophisticated routing methods to put water into and out of the pond during the event. This approach yields a more realistic pond behavior and should be recommended for the Manual revision. The Instantaneous volume approach is an option when a conservative over-design is desired.
- The magnitude of peak flow and duration of elevated flow varies among the four design approaches (K124, R124, K224, R224) examined by design event. In general, the differences are most apparent during the 1-year and 2-year storm events and reflect the differences noted above.This is pertinent to the channel protection design which focuses on this range of events. Even though there are differences, all four design scenarios show that peaks will be reduced below pre-development conditions.
- The current channel protection designs recommended in the Manual (1-year extended detention) and in the MPCA Protecting Water Quality in Urban Areas (1/2 2-year pre-development peak matching) both appear from this analysis to work well at reducing peak flows for the 1- and 2-year rainfall events. The methods also appear to be able to contribute to matching pre-development peaks for the 10- and 100-year events under the modeled conditions. The 1-year extended detention method does appear to result in higher peaks and potentially higher erosion during a modeled wet year, which argues in favor of the ½ 2-year pre-development peak matching approach.
- The largest downward erosion and greatest water depth (above bankfull) of the modeled channel during the wet modeled year of 2002 occurred for the routed 1-year, 24-hour (R124) design configuration. The routed ½ 2-year, 24-hour configuration (R224) showed less erosion in the channel and lower water depths.
- Applying either of the two design methodologies using a routing approach should work to keep erosive flows at a minimum during small events (less than 2 inches). When events exceed 2 inches, the hydraulic outlet controls designed for a detention pond become a major factor as water levels rise above the channel protection criteria for design. If control of events more than 2 inches is needed to achieve a goal, adaptations in the outlet to allow more water to leave the facility at lower flows might be needed.
- The findings of the modeling in this exercise and the literature review at the end confirm that there is no simple or uniform answer when it comes to erosion control on a particular reach of stream. For small events (less than 2 inches), the two approaches evaluated herein are acceptable. The safest approach when erosion is a major concern is to analyze the soil and channel conditions (soil type, shear stress, velocity, water depth, channel slope, sediment load, etc.) and perform a total erosion potential analysis that determines the actual conditions under which erosion will begin, and then design to not exceed those conditions. Several authors (below) seem to validate the theme of the Minnesota Stormwater Manual that runoff volume reduction will result in less erosion downstream of urban areas.
Modifications to channel protection criteria
There are some practical limitations in applying channel protection criteria to small development sites because orifice diameters or weir sizes become extremely small and are prone to clogging. As a result, it is recommended that localities waive the channel protection requirements at small sites that have less than three acres of impervious cover. Channel protection need not be applied at sites that have a discharge condition that will not likely cause a local channel erosion problem, such as sites that directly discharge to
- fourth order or higher streams and rivers (data on stream order is available from DNR or the USGS from the National Hydrography Dataset.); or
- lakes and reservoirs where the development area is less than 5 percent of the watershed area upstream of the development site.
This page was last edited on 6 December 2022, at 19:17.
