Stormwater infiltration and groundwater mounding
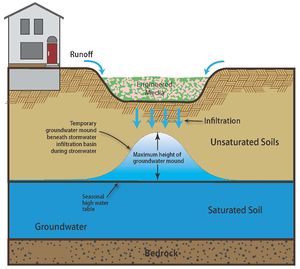
The localized groundwater surface may temporarily rise below an infiltration Best Management Practice (BMP), creating a condition termed groundwater mounding. Mounding can occur in areas where infiltrating water intersects a groundwater table and the rate of water entering the subsurface is greater than the rate at which water is conveyed away from the infiltration system (Susilo, 2009). Infiltration BMPs in particular have the potential to cause a groundwater mound, given the right subsurface conditions, because they direct the recharge to a specific area (Machusick and Traver, 2009).
Contents
When is groundwater mounding a problem?
The vadose zone is the unsaturated depth of in-situ (existing) soil below the infiltration BMP. Contaminants that are not captured within the BMP may be attenuated within this zone. The temporary rise of the groundwater elevation caused by mounding will decrease the available vadose zone, which may decrease the removal of certain pollutants. If the mound reaches the base of the infiltration BMP, then the hydraulic gradient (direction of water movement) shifts from vertical to horizontal and significantly slows the movement of water through the soil. Groundwater mounds that significantly widen below the base of an infiltration BMP may damage underground utilities, basements and building structures if the mounds are high enough and there is not enough separation between the mound and structures (Machusick and Traver, 2009). Groundwater mounds may also affect local hydraulic gradients and mobilize contaminants that are in soil or groundwater.
When should a mounding analysis be conducted?
A mounding analysis is a way to determine the likelihood that a groundwater mound will occur. A mounding analysis should be performed if one or more of the following conditions exist:
- Low saturated hydraulic conductivity. Soils with low saturated hydraulic conductivity do not dissipate the infiltrating water quickly, allowing for the water to accumulate below the base of the infiltration BMP.
- Thin vadose zone. Mounding is more likely to occur in areas with a shallow groundwater table (thin vadose zone).
- Low aquifer thickness. Groundwater aquifers that are thick are able to dissipate infiltrating water. Alternatively, aquifers with low thickness are less able to dissipate the water. The maximum height of a mound tends to decrease as the thickness of the aquifer increases (Carleton, 2010).
- Large and/or non-rectangular basin. Under the same conditions, circular, hexagonal and triangular basins have been found to have higher groundwater mounds than rectangular basins (Domey, 2006).
- Close proximity to a polluted site. If a mound on one site extends to an adjacent property it will raise the groundwater elevation at that property. This is of particular concern if the adjacent site is contaminated since the mound could facilitate the movement of the contaminant plume (Nimmer et al., 2010).
- Close proximity to a building or structure or underground utility. When infiltration basins are just vertically above or within 10 horizontal feet of a building, structure, or underground utility, a mounding analysis should be conducted.
- Close proximity to other infiltration BMPs. The presence of multiple BMPs can compound the effect of mounding (Maimone et al., 2011). For example, a study in Syracuse, New York modeled the impact of multiple infiltration BMPs and found that there was the potential for a 0.2 to 0.7 meter mound to form due to close proximity. The height depended on the arrangement of the basins and the soil characteristics.
How to predict the extent of a mound
Both analytical and numerical methods exist that can predict the extent of a groundwater mound. The most widely known and accepted analytical method is based on the work by Hantush (1967). A simple Excel spreadsheet of the Hantush Method was created by the USGS. This method requires the user to input information on the recharge rate, specific yield, horizontal hydraulic conductivity, dimensions of the infiltration BMP, and the initial thickness of the unsaturated zone. The result is considered by experts to be a simplified version of the actual site conditions. The Hantush method can be limited by it's assumptions, which include no storage loss, uniform and horizontal infiltration, and vertical sides to the BMP. If these assumptions are violated then a more robust numerical method should be used.
A common numerical method is to model site conditions using computer simulations. MODFLOW is the most widely used among the many programs that exist. While numerical modeling can provide a more accurate representation of site conditions, it also requires the user to have considerable training in order to develop the model and run simulations and interpret the results.
Factors that affect the height and extent of a groundwater mound beneath a stormwater infiltration system
Link to this table
| Model Input Parameter | Description of Parameter | Mound Height | Mound Extent | Effect on Groundwater Mounding |
|---|---|---|---|---|
| Horizontal Hydraulic Conductivity of Aquifer | Measure of resistance to flow of water through a unit volume of aquifer matrix in the horizontal direction.
|
Decreases as hydraulic conductivity increases | Increases as hydraulic conductivity increases | Increasing horizontal hydraulic conductivity allows for greater ability to transmit water away from the source of infiltration. This allows for lower height of groundwater mounding, but greater extents. |
| Initial Saturated Thickness of Aquifer | Thickness of the aquifer, or permeable layer that can contain or transmit groundwater, within the saturated zone measured from the seasonal high water table to the bottom of the aquifer. Note this saturated zone may be a localized or perched groundwater system rather than the regional groundwater system. Minnesota regional aquifer information can be found on the MDNR groundwater provinces web page. | Decreases with greater thickness | Increases with greater thickness | Increasing aquifer thickness allows for a larger area to transmit water to and from the source of infiltration. This allows for lower height of groundwater mounding but greater extents as water moves away from the source. |
| Specific Yield | Governs the amount of water the unsaturated zone of an aquifer can store once recharge reaches the water table.
|
Increases with lower values | Increases with lower values | Groundwater mound height and extent are lower when specific yield is higher because the aquifer can store more water per unit volume of aquifer |
| Infiltration Basin Shape | Shape can vary from square, rectangle, round or elongate. Extents of the basin will vary by depth and drawdown time of the basin per Infiltration Basin Design Criteria. | Decreases for rectangular installations | Increases for rectangular basin | Long narrow basins are much more efficient at infiltrating water than circular or square ones. High perimeter to area ratio basins have more efficient hydraulic sections because flow is radially away from the basin or recharge area once the mound height reaches the basin bottom. |
| Infiltration Basin Depth | The maximum depth of ponded water within the infiltration basin.
|
Increases with greater depth | Increases with greater depths | Greater basin depths allow for increased groundwater mounding height and extent. |
| Design Storm | The design storm dictates the rainfall event intensity, duration, and statistical recurrence interval the infiltration basin is designed to manage.
|
Increases with larger design storms | Increases with larger design storms | Larger design storms result in increased amounts of runoff and larger volume of water to be infiltrated. |
| Percent Impervious Cover | Impervious cover represents the regions within the drainage area that are unable to infiltrate stormwater, resulting in stormwater runoff. | Increases with higher percentages | Increases with higher percentages | Higher imperviousness results in increased amounts of stormwater runoff and larger volume of water to be infiltrated. |
| Recharge or Infiltration Rate | The rate at which water placed within the basin reaches the water table.
|
Increases with higher rates | Increases with higher rates | Magnitude and extents of groundwater mounds are directly proportional to the recharge rate. Duration of recharge also impacts the height and extent of groundwater mounding. The longer the duration at the specified recharge rate, the greater the magnitude and extent of mounding. |
Guide to using the mounding calculator
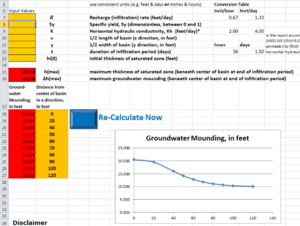
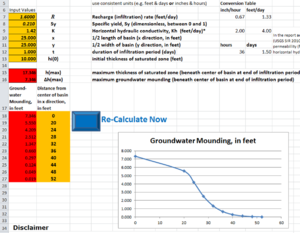
Here we present a step-by-step example of using the mounding calculator with screenshots. The image on the left shows the calculator with no values entered. You are installing an infiltration practice. Soil borings indicate the underlying soil is a sandy loam. The infiltration rate is 0.8 inches per hour or 1.6 feet per day. The specific yield is 0.21 and the hydraulic conductivity is 0.000005 meters per second or 1.42 feet per day (link here). The dimensions of the practice are 50 feet by 50 feet. Enter half of these values (25 feet) into the spreadsheet, as indicated in the spreadsheet. The basin is 1.6 feet deep, so the duration of infiltration is 1 day since the infiltration rate is 1.6 feet per day. We do not know the thickness of the saturated zone so use a value of 10 feet. We enter these values into the calculator and click on the Re-Calculate Now icon. We are looking for that distance at which the mound height is 0.25 feet and notice the value is difficult to determine with the default distances used in the calculator, so we change the distances at which we want the calculations made (we use 20, 24, 28, 32, 36, 40, 44, 48, and 52 feet, as shown in the figure to the right). We re-calculate and see the mound height is 0.25 feet at a distance of about 41 feet. We could change the calculation distances again if we wanted to get a more exact measurement. Since the mound height is given from the center of the infiltration practice, we have to subtract off the length beneath the practice in order to determine how far the plume extends beyond the practice. We thus subtract off 25 feet because the calculation is made from the center of the practice, giving a distance of 41 minus 25 or 16 feet. We multiply this by a safety factor of 2 to give a distance of 32 feet. Any point of groundwater contamination should therefore be 32 feet or more from the edge of the infiltration practice.
Example mound calculations
| Results of mounding analysis for an infiltration practice in a medium sand | |||||
| Inputs | |||||
| Recharge (ft/day) | 1 | 1 | 1.5 | 1 | 1 |
| Specific yield | 0.26 | 0.26 | 0.26 | 0.26 | 0.26 |
| Ksat (ft/day) | 55 | 55 | 55 | 55 | 55 |
| 1/2 length (ft) | 30 | 15 | 30 | 18.15 | 30 |
| 1/2 width (ft) | 30 | 15 | 30 | 50 | 30 |
| Time (days) | 2 | 2 | 2 | 2 | 2 |
| Aquifer thickness (ft) | 10 | 10 | 10 | 10 | 5 |
| Results | |||||
| Distance from basin center (ft) | Maximum mound height (feet) | ||||
| Run 1 | Run 2 | Run 3 | Run 4 | Run 5 | |
| 0 | 1.547 | 0.572 | 2.268 | 1.435 | 2.26 |
| 20 | 1.391 | 0.409 | 2.045 | 1.194 | 2.012 |
| 40 | 0.953 | 0.246 | 1.413 | 0.826 | 1.283 |
| 60 | 0.617 | 0.156 | 0.921 | 0.547 | 0.725 |
| 80 | 0.398 | 0.100 | 0.597 | 0.359 | 0.388 |
| 100 | 0.254 | 0.063 | 0.381 | 0.230 | 0.197 |
| 120 | 0.158 | 0.040 | 0.238 | 0.144 | 0.094 |
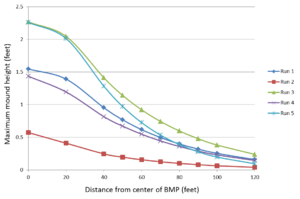
We used the Excel spreadsheet developed by the USGS to calculate mounds for five scenarios. The soil was assumed to be a medium sand. Calculator inputs that were held constant included aquifer specific yield (0.26), horizontal hydraulic conductivity (55 feet/day), and time (2 days to simulate the 48 hour drawdown requirement in the Construction Stormwater Permit). Calculator inputs that were varied include recharge (values of 1 and 1.5 feet, which simulates the ponded depth in the BMP), the dimensions of the BMP, and the aquifer thickness (values of 5 and 10 feet). The calculator utilizes values for 1/2 the length and 1/2 the width of the BMP. Results are shown in the table to the right.
Run 1 was the base scenario in which a 1 inch performance goal was met for a 1 acre impervious site. The BMP for this scenario was a square practice, 60 feet on a side, with a 1 foot ponding depth. The results indicate that a mound of about 1.5 feet develops directly under the BMP. At the perimeter of the BMP the projected mound is 1.2 feet. Recommended separation distance is 10 feet from a building or structure. At this distance, the water table would be raised a maximum of 0.95 feet. Assuming the media is 1 foot thick and the distance to the water table is the minimum required depth of 3 feet, the water table at this separation distance would be about 4 feet below ground surface (3 foot vertical separation + 1 foot of media + 1 foot ponding depth). At a distance of 120 feet from the edge of the BMP the water table rise resulting from infiltration would be less than 1 inch.
The size of the BMP was reduced for Run 2, with 30 foot sides instead of 60 foot sides. Decreasing the size of the practice greatly reduced the height and extent of the mound, with a maximum mound height of less than 1/2 foot in the center and less than 4 inches at the perimeter of the BMP. The infiltration practice only achieves about 25 percent of a 1 inch performance goal. However, the results suggest multiple practices could be used to minimize the effects of mounding since the mound does not extend far laterally. At a distance of 90 feet from the center of the infiltration practice the predicted rise of the water table is less than 1 inch.
For Run 3 the ponding depth was increased to 1.5 feet and the other inputs were the same as for Run 1. Mound height and extent increased significantly, with an increase of more than 1.5 feet at the perimeter of the BMP. This BMP would be undersized for this ponding depth. Sizing it correctly (37 feet per side) results in a water table increase of more than 2 feet at the perimeter of the BMP. At a distance of about 150 feet from the edge of the BMP the water table rise is about 1 inch.
In Run 5, the aquifer thickness was reduced by half, resulting in a significant increase in mound height and extent. If the aquifer thickness were doubled, from 10 to 20 feet, the resulting mound would be significantly less, with a maximum mound of less than 1 foot and a water table increase of about 0.7 feet at the edge of the infiltration basin.
The results support the above discussion on predicting a mound and give an indication of the magnitude of the mound under differing conditions. These runs were simplistic but may provide some indication of the magnitude of mounding that will occur under an infiltration BMP. The calculator is easy to use and inputs can easily be determined from the literature. A suggested reference for calculator inputs is here.
Expanded mounding scenarios
We ran several scenarios using the USGS calculator, adjusting each of the input variables several times while holding the other variables constant. Results of this analysis can be seen in the Excel spreadsheet link shown below. When using this spreadsheet, open the tab called Read me, which explains how to use the information in the spreadsheet.
File:Mounding scenarios expanded.xlsx
Case studies
- Machusick and Traver, 2009. The authors studied the effect of stormwater infiltration from an infiltration BMP at the Villanova campus on the shallow unconfined aquifer below. The study was conducted from November 2007 to August 2008. The BMP was a vegetated basin with a 0.53 hectare drainage area and was designed to infiltrate the first 2.5 cm of stormwater runoff. Four monitoring wells were installed to provide continuous monitoring of the groundwater below and around the basin. Monitoring well (MW) 1 was located upgradient, MW-3 was located downgradient, and MW-2 and MW-4 were located adjacent to the site. The results of the experiment show that for storms smaller than 1.9 cm, the upgradient well (MW1) exhibited a larger increase in the groundwater table than the wells closer to the site (i.e., MW2 and MW3). For storms that were larger than 1.9 cm, the reverse was observed. One important note is that the rise in groundwater at MW-2 was attenuated prior to MW-3, meaning the mound did not extend that far laterally. The observed rise in the groundwater at the different monitoring wells was not found to correlate with the amount of rainfall. Infiltration rate was found to be the primary factor that affected the amount of groundwater mounding that occurred, with temperature being the factor that most influenced the change in infiltration rates between stormwater events.
- Thomas and Vogel, 2012. The City of Boston, MA has been periodically experiencing a decline in groundwater elevations over the past century. To try to combat this, the City enacted a code that requires that any new development or redevelopment project install stormwater recharge BMPs. Since the implementation of the code in 2006, 69 recharge BMPs have been installed which has resulted in an estimated 163,450 gallons of recharge per 1-inch storm event. In order to estimate the effect that these recharge BMPs would have on the groundwater level, regional multivariate regression models were developed. The regional groundwater model was developed through the use of groundwater level measurement at 234 observation wells which started between 1999 and 2005 and went through 2009. The final results of the study indicate that the recharge BMPs led to an increase in groundwater elevations. In addition, the model developed during the study can be used by the City to determine the potential impact of future BMPs. While not directly related to groundwater mounding, this study provides some information on the impact of multiple BMPs in one area.
Related pages
- Overview of stormwater infiltration
- Pre-treatment considerations for stormwater infiltration
- BMPs for stormwater infiltration
- Pollutant fate and transport in stormwater infiltration systems
- Surface water and groundwater quality impacts from stormwater infiltration
- Stormwater infiltration and groundwater mounding
- Stormwater infiltration and setback (separation) distances
- Karst
- Shallow soils and shallow depth to bedrock
- Shallow groundwater
- Soils with low infiltration capacity
- Potential stormwater hotspots
- Stormwater and wellhead protection
- Stormwater infiltrations and contaminated soils and groundwater
- Decision tools for stormwater infiltration
- Stormwater infiltration research needs
- References for stormwater infiltration
This page was last edited on 6 December 2022, at 13:47.


