Summary of data received from permittees on MS4 TMDL permit reporting forms
Total Maximum Daily Load (TMDL) Wasteload Allocations (WLAs) approved by the U.S. Environmental Protection Agency (EPA) prior to the effective date of the MS4 General Permit (permit) must be addressed by Permittees in their Stormwater Pollution Prevention Program (SWPPP) Document. Specific permit requirements are found in section II.D.6 and Section III.E of the Municipal Separate Storm Sewer System (MS4) permit. The permit requires municipalities that have an MS4 permit, discharge to a receiving water with a TMDL that was approved by the EPA prior to 2013, and indicated that they are not meeting their waste load allocation to report their progress toward meeting the WLA every year. The MPCA received TMDL reporting forms from 78 permittees. Permittees must update the reporting form with each Annual Report. We used data collected through 2015 to develop this page.
The TMDL reporting form is an Excel file. Data from each of the 78 reporting forms was migrated to an Access database. We conducted some simple analysis of the data. Results are summarized on this page. For more information on the TMDL reporting form, link here.
- We did not conduct quality checks of the data received in the TMDL reporting forms.
- Some fields in the reporting form are optional for the permittee. Thus the numbers shown below may not be in complete agreement because of missing data.
- We conducted limited analysis and interpretation of the data.
BMPs implemented
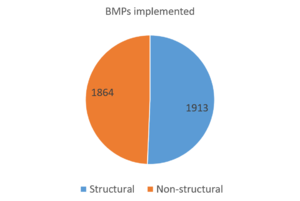
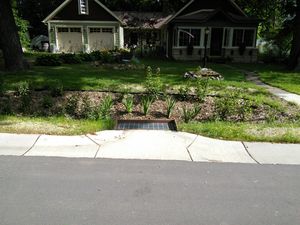
As of 2015, nearly 3,800 BMPs were implemented and reported in the reporting forms. These BMPs can be structural or nonstructural. Examples of structural BMPs include infiltration basins, rain gardens and other bioretention practices, dry and wet swales, green roofs, iron enhanced filters, stormwater reuse systems, sand filters, tree trenches, etc. Nonstructural BMPs include supplemental street sweeping, employee or public education and outreach, establishing ordinances, enhanced road salt management, improved lawn care practices, investigating and eliminating illicit discharges, etc. Structural BMPs account for 50.6 percent of the BMPs used to indicated progress toward TMDL compliance, while 49.4 percent of the reported BMPs were non-structural.
Structural BMPs
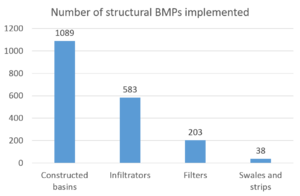
Constructed stormwater ponds accounted for 56.9 percent of all structural BMPs. Infiltrators, which includes BMPs such as bioinfiltration, infiltration trenches, underground infiltration basins, permeable pavement, and tree trenches, accounted for 30.5 percent of all structural BMPs. Filters, which primarily are BMPs with underdrains, accounted for 10.6 percent. Swales and strips account for about 2 percent.
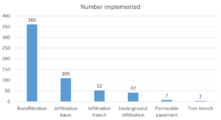
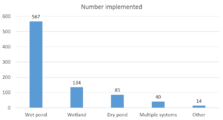
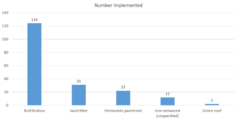
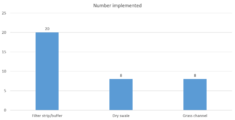
The figure below illustrates the number of BMP types implemented for the major structural BMP categories. Since this was an optional field in the reporting form, the total numer of practices does not equal the total number of practices shown in the figure to the right. Wet ponds account for 67.5 percent of all constructed basins, with wetlands accounting for about 16 percent of constructed basins. For infiltrators, bioinfiltration systems account for about 63 percent of all BMPs. Infiltration basins (19 percent) and infiltration trenches (9 percent) account for about 28 percent of all infiltration BMPs. Underground systems, which tend to be larger BMPs designed to infiltrate larger volumes of water, account for 7 percent of all infiltrator BMPs. Biofiltration BMPs accounted for about 65 percent of all filtration BMPs. Sand filters accounted for 16 percent and permeable pavement 11.5 percent. Iron enhanced systems account for about 6 percent. The type of iron enhanced practice was not specified.
- Number of BMPs implemented for different structural BMP types. Click on an image for enlarged view.
Non-structural BMPs
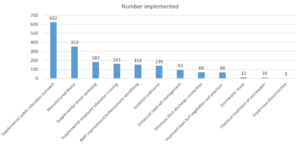
Non-structural activities include a wide range of activities, most of which are encompassed within the 6 minimum control measures. Examples include education, training, street sweeping, and pollution prevention. Pollutant load reductions associated with non-structural BMPs are difficult or not possible to quantify. Properly implemented, however, they will lead to reductions in pollutant loading. The following analysis is not particularly rigorous and the data could be mined for additional insight into the types of non-structural practices implemented by permittees.
Supplemental public education and outreach
Supplemental public education and outreach was the most common non-structural BMP, accounting for 33.4 percent of all non-structural BMPs. For this BMP category, the following specific practices were reported in the TMDL form.
- 378 publications
- 133 presentations
- 77 workshops and/or clinics
Examples of workshops and clinics include the following:
- annual rain garden workshops taught by MetroBlooms
- workshops on salt control for local business
- watershed cleanup events
- adopt-a-water program
- school festivals
Examples of publications include the following:
- newsletters
- news articles and news briefs
- brochures
- Blue Thumb publications
- yard care packets
- West Metro Alliance publications
Presentations include a wide range of activities ranging from training to classroom presentations and staffed booths at events.
We created an Excel spreadsheet summarizing the supplemental education and outreach activities reported by MS4 permittees. The spreadsheet includes the permittee name, the reporting year, a BMP description, and notes. Note that these data were not required and the data fields are therefore not completely filled.
File:Supplemental public education and outreach.xlsx
Manufactured devices
Manufactured devices cover a wide range of BMPs that are structural in nature but are difficult to quantify in terms of pollutant reductions. The practices are often considered pretreatment and often require frequent maintenance to effectively remove pollutants. Manufactured devices accounted for about 19 percent of non-structural practices reported in the TMDL form.
The terminology for these practices may be somewhat overlapping and dependent on what a particular permittee calls the practice. The most common practices cited were drain inlet inserts, sump manhole, grit chamber, SAFL baffle, manufactured filter, and hydrodynamic separator.
Although manufactured devices were the second most cited non-structural BMP category, they were included in only a handful of reporting forms. The City of Plymouth, for example, listed 206 drain inlet inserts in the report. The cities of Brooklyn Center, Fairmont, Robbinsdale, and Rochester listed a total of 47 grit chambers. Sumps and sump manholes were list 52 times by eight different permittees. These devices are typically used for pretreatment, but the information in the reporting form does not allow determination of how these practices are used.
Supplemental street sweeping
Supplemental street sweeping accounts for 9.8 percent of non-structural BMPs submitted in TMDL reporting forms. A total of 39 permittees included this as a BMP category. The following BMP descriptions were included.
- vacuum sweeping - 40
- increased frequency - 26
- modified sweeping schedule - 18
Permittees listed street sweeping as the BMP description on 70 occasions. It is unclear if this comprises new sweeping in locations where sweeping previously did not occur.
Using the information provided in the reporting form, it is difficult to identify specific changes in street sweeping practices. There were some approaches noted that likely would be effective, including the following.
- targeting areas close to receiving water (City of Robbinsdale)
- city-wide use of vacuum assisted sweeping in spring and summer (City of Plymouth)
- following sweeping recommendations from the TMDL Implementation Plan (City of Prior Lake)
- sweeping associated with new construction (Watab Township)
Supplemental employee education training
Supplemental employee education training accounted for 8.6 percent of non-structural BMPs included in the report forms. A total of 22 permittees included this as a BMP category. The following BMP descriptions were included.
- staff training - 86
- employee education - 40
- contaminant source inventory - 3
The following Excel spreadsheet summarizes the information for this BMP category - File:Supplemental employee education training.xlsx.
Some of the notes included for this category are summarized below.
- inventory of small farms adjacent to waterways (Sherburne County)
- creation of site plan review procedures (City of Robbinsdale)
- training of all field staff on MS4 program activities including Illicit discharge detection (City of Burnsville)
- municipal training on winter road, parking lot and sidewalk maintenance (Capitol Region Watershed District and City of Falcon Heights)
- town Chair sent to MS4 training programs (Haven Township)
- training for winter maintenance
- Board training and certification (Watab Township)
- Renewed membership in Central Minnesota Watershed Alliance
Establish ordinance
This BMP category accounted for 7.4 percent of non-structural BMPs reported. A total of 29 permittees included this as a BMP category. The following BMP descriptions were included.
- post construction controls - 33
- illicit discharges - 20
- erosion and sediment control - 19
- pet waste - 9
- yard waste/leaves/grass clippings - 5
- open space development - 5
- soil/land preservation - 3
- native plant buffer requirement - 2
- aquatic buffers - 2
- fertilizer application - 1
The following Excel spreadsheet summarizes the information for this BMP category - File:Ordinances.xlsx
Other BMPs
The remaining BMP categories each accounted for less than 5 percent of non-structural BMPs, although as a total they accounted for 13.5 percent of all non-structural BMPs. The following breakdown summarizes these BMP ctaegories.
- enhanced road salt management - 5 percent
- eliminate illicit discharge connection - 3.7 percent
- improved lawn turf vegetation soil practices - 3.5 percent
- stormwater reuse - 0.6 percent
- chemical treatment of stormwater - 0.5 percent
- impervious disconnection - 0.2 percent
The road salt management BMPs included the following.
- use of treated salt - 24
- winter maintenance education - 16
- anti-icing - 13
- calibration of spreaders - 10
- salt storage - 10
- salt brine - 8
- road temperature sensors - 4
Improved lawn and turf BMPs included the following.
- native planting - 5
- tree/shrub establishment - 5
- yard waste collection - 5
- nutrient/fertilizer management - 3
- soil improvement - 2
Several permittees reported improved turf management, which does not provide information about the specific activity implemented.
Stormwater reuse was cited by seven cities and included 3 ponds, 3 rain barrel programs, and one underground vault. These practices should be quantifiable if sizing information is known and the captured water is infiltrated or treated. The three stormwater disconnection practices could be included with these reuse projects.
TMDLs addressed
A total of 67 TMDL projects were addressed in the reporting forms. A TMDL project may include multiple impaired water bodies. For example, the Lower Minnesota River Dissolved Oxygen TMDL project includes several reaches on the Minnesota River that are impaired. Data provided on the reporting form does not distinguish between these reaches.
Load reductions
The TMDL form includes information on load reductions for structural BMPs. Permittees had flexibility in choosing the method for calculating reductions. The following methods were used by permittees.
- 14 permittees used the MPCA estimator to calculate loads for 20 TMDL projects
- 7 permittees used the MIDS calculator for 8 TMDL projects
- 5 permittees used P8 for 6 TMDL projects
- Other models included WINSLAMM, Pondnet, the Simple Method, and a sweeping calculator (possibly the tool developed by the University of Minnesota)
- Other methods included monitoring, weight tickets, and literature
Reductions could be provided as a mass reduced (e.g. pounds reduced) or as a percent reduction in loading from a baseline condition. The first table below summarizes reductions in pounds for permittees that reported mass reductions. The data must be viewed with caution. For example, phosphorus reductions for the Lower Minnesota Dissolved Oxygen TMDL are very large. Further inspection of the data indicate indicates one permittee reported reductions of more than 5000 pounds based on cubic yards of material collected from street sweeping.
The second table provides reductions as a percent from a baseline condition. Percent reductions cannot readily be combined into an overall reduction since baselines may differ between permittees. The calculation can be made but has not been for this report.
This table shows load reductions reported by permittees in their TMDL reports.
Link to this table.
| TMDL Project | Pounds reduced |
|---|---|
| Bald Eagle Lake | 1.5 |
| Bass Lake | 133.2 |
| Big Elk Lake | 10.5 |
| Burandt Lake | 109.2 |
| Como Lake | 206.6 |
| Crystal Lake | 29.1 |
| Eagle Lake | 2.328 |
| Fish Lake | 41.7 |
| Keller Lake | 49.41 |
| Kohlman Lake | 16.2 |
| Lake Independence | 121.2 |
| Lake Sarah | 157 |
| Lake St. Croix | 237.73 |
| Long Lake | 88.45 |
| Lower Minnesota River DO | 7336.1 |
| Meadow Lake | 8.481 |
| Medicine Lake | 0.03 |
| Middle Twin Lake | 91.8 |
| Miller lake | 46.5 |
| North Twin Lake | 235.9 |
| Pike Lake | 2.328 |
| Pomerleau Lake | 43.0 |
| Reitz Lake | 43.92 |
| Ryan Lake | 7.66 |
| Schmidt Lake | 41.3 |
| Silver Lake | 152 |
| South Twin Lake | 250.9 |
| Spring Lake | 35.2 |
| Virginia Lake | 4.5 |
| Wasserman Lake | 77.4 |
| Bluff Creek | 3329093 |
| Elk River | 1919408 |
| Hardwood Creek | 15 |
This table shows load reductions, as a percent reduction, reported by permittees in their TMDL reports.
Link to this table.
| TMDL Project | MS4 | Percent reduction |
|---|---|---|
| Bald Eagle Lake | Dellwood | 38 |
| Cedar Island Lake | MNDOT Metro | 8.56 |
| Crystal Lake | MNDOT Metro | 18.89 |
| Golden Lake | Blaine | 47.53 |
| Golden Lake | Rice Creek Watershed District | 82 |
| Kohlman Lake | North St. Paul | 2.7 |
| Kohlman Lake | Oakdale | 1.9 |
| Kohlman Lake | Vadnais Heights | 7.1 |
| Lake St. Croix | MNDOT Metro | 21.41 |
| Lake St. Croix | Lake Elmo | 27.27 |
| Lake St. Croix | North St. Paul | 0.24 |
| Lake St. Croix | West Lakeland Township | 4.71 |
| Lake Virginia | MNDOT Metro | 5.75 |
| Lower Minnesota River DO | St. Peter | 28.81 |
| Lower Minnesota River DO | New Ulm | 12.7 |
| Lower Minnesota River DO | North Mankato | 12.6 |
| Medicine Lake | MNDOT Metro | 8.97 |
| Hardwood Creek | Rice Creek Watershed District | 51 |
| Blue Earth River | Fairmont | 70 |
| Blue Earth River | Mankato | 26.22 |
| Lower Mississippi River | Hastings | 44.36 |
Non-structural BMPs applied to TMDLs
The following table summarizes the total number of non-structural BMPs reported for each TMDL project.
Number of non-structural BMPs reported, by TMDL project
Link to this table
| Number of non-structural BMPs | ||||||||||||
|---|---|---|---|---|---|---|---|---|---|---|---|---|
| TMDL Project | Total | BMP improvement/retrofitting | Eliminate illicit discharges | Establish ordinance | Improved lawn/turf management | Manufactured device | Supplemental employee education | Supplemental public education | Stormwater reuse | Supplemental street sweeping | Chemical treatment | Enhanced road salt management |
| Bald Eagle Lake - Phosphorus | 27 | 6 | 1 | 3 | 2 | 1 | 2 | 7 | 1 | 3 | ||
| Bass Lake - Phosphorus | 52 | 1 | 2 | 1 | 2 | 4 | 34 | 8 | ||||
| Big Elk Lake - Phosphorus | 51 | 1 | 3 | 1 | 2 | 11 | 29 | 2 | 2 | |||
| Blue Earth River Basin Fecal Coliform TMDL - Fecal Coliform | 52 | 14 | 2 | 6 | 3 | 13 | 4 | 5 | 1 | 4 | ||
| Bluff Creek Watershed Turbidity and Fish Bioassessment Impairements TMDL - TSS | 40 | 2 | 2 | 26 | 1 | 8 | 1 | |||||
| Burandt Lake - Phosphorus | 7 | 1 | 1 | 2 | 2 | |||||||
| Cedar Island Lake - Phosphorus | 14 | 1 | 1 | 1 | 2 | 3 | 3 | 3 | ||||
| Como Lake - Phosphorus | 33 | 16 | 1 | 4 | 7 | 4 | ||||||
| Crystal Lake - Phosphorus | 2 | 3 | 1 | 2 | 2 | 4 | 7 | X | 1 | 3 | ||
| Eagle Lake - Phosphorus | 54 | 1 | 2 | 1 | 2 | 5 | 35 | 8 | ||||
| Elk River Watershed - Multiple Impairments TMDL - TSS | 45 | 3 | 3 | 2 | 2 | 10 | 19 | 5 | ||||
| Farquar Lake - Phophorus | 3 | 1 | 2 | |||||||||
| Fish Lake - Phosphorus | 6 | 2 | 2 | 2 | ||||||||
| Golden Lake - Phosphorus | 23 | 3 | 7 | 3 | 8 | 1 | 1 | |||||
| Hardwood Creek Impaired Biota and Dissolved Oxygen TMDL - TSS | 44 | 4 | 2 | 4 | 4 | 7 | 18 | 2 | ||||
| Keller Lake - Phosphorus | 8 | 3 | 1 | 2 | 2 | |||||||
| Knife River Turbidity TMDL - TSS | 5 | 2 | 1 | 2 | ||||||||
| Kohlman Lake - Phosphorus | 15 | 5 | 1 | 4 | 5 | |||||||
| Lake Independence - Phosphorus | 27 | 9 | 3 | 5 | 2 | 3 | 3 | 1 | ||||
| Lake Nokomis - Phosphorus | 4 | 1 | 1 | 1 | 1 | |||||||
| Lake Sarah - Phosphorus | X25 | 9 | 2 | 5 | 2 | 4 | 1 | 1 | ||||
| Lake St. Croix - Phosphorus | 51 | 3 | 1 | 21 | 3 | 2 | 2 | 9 | 8 | 2 | ||
| Lake Virginia - Phosphorus | 7 | 1 | 1 | 2 | 1 | 1 | 1 | |||||
| Lee Lake - Phosphorus | 4 | 3 | 1 | |||||||||
| Little Comfort Lake - Phosphorus | ||||||||||||
| Little Rock Lake - Phosphorus | 25 | 1 | 3 | 1 | 4 | 7 | 6 | 2 | 1 | |||
| Long Lake - Phosphorus | 4 | 1 | 3 | |||||||||
| Lower Minnesota River Dissolved Oxygen TMDL - Phophorus | 115 | 25 | 8 | 29 | 6 | 13 | 7 | 11 | 1 | 11 | 4 | |
| Lower Mississippi River Basin Fecal Coliform Bacteria TMDL - Fecal Coliform | 97 | 5 | 6 | 6 | 3 | 32 | 14 | 30 | 1 | |||
| Magda Lake - Phosphorus | 7 | 1 | 1 | 2 | 1 | 1 | 1 | |||||
| Meadow Lake - Phosphorus | 37 | 4 | 2 | 25 | 4 | 2 | ||||||
| Medicine Lake - Phosphorus | 91 | 16 | 3 | 11 | 10 | 6 | 30 | 1 | 9 | 3 | ||
| Middle Twin Lake - Phosphorus | 58 | 2 | 2 | 1 | 5 | 6 | 31 | 9 | ||||
| Miller Lake - Phosphorus | 10 | 1 | 2 | 1 | 33 | 3 | ||||||
| Ninemile Creek: Impaired Biota, Turbidity & Chloride TMDL - Chloride | 45 | 1 | 1 | 2 | 1 | 3 | 4 | 3 | 30 | |||
| North Twin Lake - Phosphorus | 61 | 2 | 1 | 1 | 8 | 4 | 27 | 6 | 2 | |||
| Parley Lake - Phosphorus | 6 | 2 | 2 | 2 | ||||||||
| Pike Lake - Phosphorus | 55 | 1 | 2 | 1 | 2 | 5 | 35 | 9 | ||||
| Pomerleau Lake - Phosphorus | 41 | 1 | 2 | 32 | 6 | |||||||
| Reitz Lake - Phosphorus | 7 | 1 | 1 | 1 | 2 | 2 | ||||||
| Ryan Lake - Phosphorus | 69 | 2 | 1 | 18 | 6 | 31 | 9 | 2 | ||||
| Schmidt Lake - Phosphorus | 143 | 1 | 102 | 2 | 32 | 6 | ||||||
| Shields Lake - Phosphorus | ||||||||||||
| Shingle Creek Chloride TMDL - Chloride | 201 | 2 | 1 | 108 | 7 | 42 | 12 | 29 | ||||
| Silver Lake - Phosphorus | 16 | 2 | 3 | 1 | 1 | 3 | 2 | 1 | 2 | |||
| South Twin Lake - Phosphorus | 57 | 2 | 2 | 1 | 4 | 6 | 31 | 9 | 2 | |||
| Spring Lake - Phosphorus | 6 | 1 | 2 | 2 | 1 | 3 | 3 | |||||
| Sweeney Lake - Phosphorus | 13 | 3 | 2 | 3 | 1 | 1 | 3 | |||||
| Virginia Lake - Phosphorus | 2 | 1 | 1 | |||||||||
| Wasserman Lake - Phosphorus | 7 | 3 | 2 | 1 | 1 | |||||||
| Zumbro River Watershed TMDL for Turbidity Impairments - TSS | 61 | 10 | 5 | 1 | 3 | 13 | 11 | 18 | ||||
BMP locations
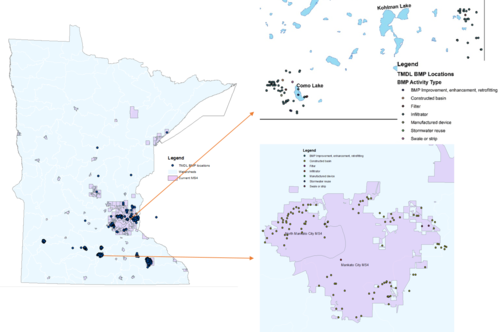
Permittees were required to include x,y coordinates for structural BMPs listed in the reporting form. The figure to the right illustrates the distribution of structural BMPs from all reporting forms. The figure also illustrates the types of BMPs reported for two specific areas. Note that the areas located in Capitol region Watershed District and Ramsey-Washington Watershed District include primarily infiltrators and filters as a result of watershed rules and limited space for building constructed ponds. This contrasts with the Mankato area, where constructed ponds are the primary BMP.
Similar figures could be used to illustrate the distribution of BMPs for specific watersheds that comprise TMDL projects. Using GIS, the BMP locations could also be associated with geologic or geographic features, such as soil type, built-out areas, karst areas, and so on. This type of analysis would allow determination of preferred BMPs based on these physical or social features.
Non-structural BMPs reported in the TMDL forms were not associated with geographic locations. Many of the BMPs, such as education or street sweeping, are implemented across the entire jurisdictional area of the permittee. BMPs such as manufactured devices could be associated with specific locations, but the high number of these devices make managing that data cumbersome.
Summary
The 2013 MS4 permit was the first permit that required permittees to submit specific information on how they were complying with TMDL wasteload allocations. The TMDL reporting form was designed to minimize the amount of time permittees spent on reporting while providing information needed to demonstrate that progress was being made toward achieving wasteload allocations. The MPCA felt most permittees were collecting the basic information needed to complete the form prior to issuing the 2013 permit and the MPCA worked with permittees to develop the reporting form. For permittees that were not collecting this information prior to the 2013 permit, the MPCA felt the TMDL reporting form would create the opportunity to begin collecting the data that MPCA believes is important to know in managing stormwater.
Although there are some basic quality control issues with the data collected from the reporting forms, the data are highly useful. In particular, the following appear to be ways in which the data can be used.
- Understanding how different permittees are addressing TMDLs. This can aid in information sharing between permittees, help target education and training opportunities, and provide a basis for assessing the effectiveness of different practices.
- Enhancing the auditing process. With an understanding of how permittees are managing their stormwater prior to an audit, audits can be targeted toward specific issues.
- Assessing compliance by individual permittees.
- Performing environmental analyses. The data can be used to assess progress for specific TMDLs or watersheds, or can be used by individual permittees or groups of permittees to assess the effectiveness of their efforts.
This page was last edited on 30 January 2023, at 18:14.
