Default TSS and TP loads for different land use scenarios using the MPCA Simple Estimator
This page provides default values derived from the MPCA Simple Estimator that may be used by permittees or practitioners to estimate TP and TSS loading from three land use types.
These values may be used as a base loading from which pollutant reductions, as a percent, pounds reduced, or final loading rate, may be calculated by including BMPs in the MPCA Simple Estimator. The corresponding Estimator files are at the following links.
|
This page provides default estimates for annual loads of total phosphorus (TP) and total suspended solids (TSS), in pounds per acre, from stormwater runoff in Minnesota cities. The estimates were derived using the MPCA Simple Estimator. Cities may use the estimates when their land use matches or approximates one of the land use scenarios from this analysis. The results represent estimated loads with no implemented best management practices (BMPs). Cities can then use the appropriate default Estimator spreadsheet to determine the TP and TSS reductions associated with BMP implementation.
Contents
Analysis methodology
We used the MPCA Simple Estimator (Estimator) to calculate average annual loading, in pounds per acre, for total phosphorus (TP) and total suspended solids (TSS). We used the default values in the Estimator for event mean concentration and runoff coefficient and assumed an annual average precipitation of 30.65 inches (Twin Cities Metro Area (TCMA)). These values are discussed in the Minnesota Stormwater Manual, as well as guidance for the MPCA Simple Estimator. Appropriate links include the following.
- Event mean concentrations for total phosphorus and total suspended solids
- Runoff coefficients
- Guidance for the MPCA Simple Estimator
We gathered land use data for several TCMA cities using Metropolitan Council land use data. The land use categories for the Met Council data do not match those used in the Estimator, so we converted the Met Council data into land uses used in the Estimator. These are summarized in the following table. Because this is subjective, we include a column describing the relative significance of a specific land use to total acres in a city. For example, farmstead was assigned to agricultural land use. Farmsteads may not be associated with typical agricultural practices, but farmstead is a minor land use and therefore has a minor impact on overall pollutant loading.
Met Council and Manual land use categories
Link to this table
| Met Council land use data | Land use assigned in the Simple Estimator | Relative contribution of land use to total acres in a city |
|---|---|---|
| Agriculture | Agriculture | Low to high |
| Farmstead | Agriculture | Low |
| Golf course | Golf course | Low |
| Industrial and utility | Indutrial | Low to moderate |
| Institutional | Institutional | Low to moderate |
| Major highway | Transportation | Low to moderate |
| Airport | Transportation | Low |
| Railroad | Transportation | Low |
| Mixed use commercial and other | Commercial | Low |
| Mixed use industrial | Industrial | Low |
| Mixed use residential | Residential | Low |
| Multifamily | Residential | Low |
| Office | Commercial | Low to moderate |
| Open water | Water | Moderate |
| Park, recreational, or preserve | Park | High |
| Retail and other commercial | Commercial | Low to moderate |
| Single family attached | Residential | Low |
| Single family detached | Residential | High |
| Undeveloped land | Open space | High |
| Manufactured housing park | Residential | Low |
| Retail and other commercial | Commercial | Low to moderate |
| Extractive | Extractive | Low |
The Estimator does not have default emcs and runoff coefficients for golf courses and extractive land use. We conducted a brief literature review to determine values for these two land uses. Default values for Estimator inputs are summarized in the following table.
Land use event mean concentrations (emcs) for the MPCA Simple Estimator
Link to this table
| Land use | Phosphorus emc (mg/L) | TSS emc | Annual precipitation (inches) | Runoff coefficient |
|---|---|---|---|---|
| Commercial | 0.20 | 75 | 30.65 | 0.71 |
| Industrial | 0.235 | 93 | 30.65 | 0.68 |
| Institutional | 0.25 | 80 | 30.65 | 0.3 |
| Open space | 0.19 | 21 | 30.65 | 0.08 |
| Residential | 0.325 | 73 | 30.65 | 0.27 |
| Park | 0.19 | 21 | 30.65 | 0.08 |
| Agriculture | 0.50 | 100 | 30.65 | 0.11 |
| Transportation | 0.28 | 87 | 30.65 | 0.80 |
| Water | 0 | 0 | 30.65 | 0 |
| Extractive | 0.15 | 94 | 30.65 | 0.15 |
| Golf course | 0.45 | 49 | 30.65 | 0.27 |
We divided the selected cities into three groups, as described below.
- Group 1: These are core TCMA cities and have been built out for several decades. The cities used in this analysis included St. Paul, Minneapolis, Brooklyn Park, Golden Valley, Edina, Bloomington, and Roseville.
- Group 2: These are established suburbs that are largely built out, but have only reached this build out status in the past decade or two. The cities used in this analysis included Woodbury, Eagan, Apple Valley, Andover, Maple Grove, Burnsville, and Lakeville.
- Group 3: These are outer ring suburbs that are undergoing development. The cities used in this analysis included Chaska, East Bethel, Farmington, Hastings, Victoria, St. Francis, Prior Lake and Medina.
Using the land uses from the Estimator and Met Council, we entered percentages for each land use for each city and converted these to fractions. If the fractions did not add to 1.0, we adjusted the fractions so that the total equaled 1.0. Thus, the data represent land use across one (1) acre within a specific city. We calculated means, standard deviations, and associated coefficients of variation (CV). We selected a sufficient number of cities to ensure the CV was less than 1 for each land use. CVs exceeded tolerance limits for agriculture in Group 1 and extraction in Group 3. Since these land uses make up a small percent of the total land use for these two groups, we assumed the high variability would not significantly affect the results.
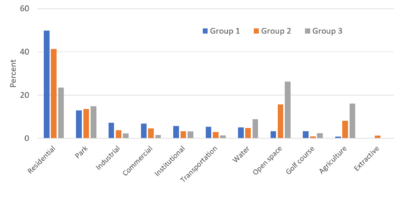
The distribution of land uses for the three groups is shown in an adjacent figure. Residential land use decreases in importance from Groups 1 through 3, while open space and agriculture increase in importance. Commercial, industrial, institutional, and transportation decrease as a percent of total acreage from Groups 1 through 3, although these land uses each comprise a relatively small percent of total land use. Parkland is similar across the three groups, while water comprises a greater percent of land use in Group 3 compared to Groups 1 and 2.
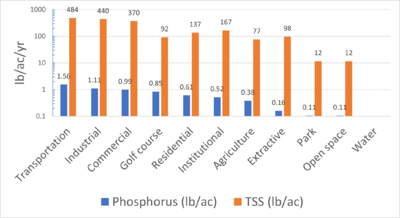
These land use distributions seem logical and have a significant impact on TP and TSS loading. The adjacent figure, which utilizes a log scale, shows that TP and TSS loading are much higher for developed land uses compared to open space and park. Also note that loading from agricultural land use is lower than from urban land uses. The default emcs and curve numbers used in the Estimator are the result of an extensive literature review, with the exception of agriculture, golf courses, and extraction. Golf courses and extraction are not important land uses, but agriculture is for Groups 2 and 3 and the Estimator may underestimate or overestimate contributions from agriculture.
Average annual pollutant loads are shown for each Group in the adjacent table. The table includes values for a scenario where water was included in the calculation and a scenario where water was excluded. Typically the values excluding water should be used in calculations, as loading is generally considered to be from surfaces that contribute runoff and associated pollutants. Water may be included when using monitoring data at outfalls to receiving waters, as this reflects contributions from the land use contributing to the outfall.
Average TP and TSS loading rates for three land use groups
Link to this table
| Group | Includes water | Excludes water | ||
|---|---|---|---|---|
| TP (lb/ac/yr) | TSS (lb/ac/yr) | TP (lb/ac/yr) | TSS (lb/ac/yr) | |
| 1 | 0.611 | 165.8 | 0.643 | 174.5 |
| 2 | 0.472 | 121.2 | 0.497 | 127.6 |
| 3 | 0.345 | 78.4 | 0.379 | 86.2 |
How to use these results
The pollutant loads for each Group represent average annual loads, in pounds per acre, for TP and TSS. These are loads with no BMPs implemented and are based on default emcs, curve numbers, and precipitation values. The numbers may be used directly by cities, but cities should carefully read the section on Notes to ensure these default conditions match the areas being modeled by the city. If the assumptions used in this analysis do not match conditions in the city or the area being modeled, appropriate values should be used in the Estimator to derive a value for the area being modeled. This manual contains a page with guidance, including a video, on using the Estimator.
The files for the three groups can be accessed at the following links.
- Group 1: File:Group 1 analysis.xlsx
- Group 2: File:Group 2 analysis.xlsx
- Group 3: File:Group 3 analysis.xlsx
Assessing pollutant reductions with BMPs
To estimate pollutant reductions associated with implementation of best management practices (BMPs), follow these steps.
- Determine which Group (1,2, or 3) is applicable to your situation
- Open the Estimator file for that group (see previous section for links to the files)
- Adjust inputs as appropriate.
- Average annual rainfall will likely require adjustment.
- Adjustments to emcs and runoff coefficients should be made only if local data support adjustments.
- Adjust acreages if appropriate, but make sure the total acreage equals one acre since the calculations are made on a per acre basis.
- Enter BMP information. This must be entered on a per acre basis. For example, if biofiltration practices (rain garden) are implemented in residential areas and residential areas comprise 50 percent of your area (Group 1), enter 0.10 as the biofiltration BMP acreage in Sections 3 and 4 of the Estimator (0.2 X 0.5).
- View results on the Summary Sheet in the Estimator
Examples
The following examples illustrate how the default Estimator files can be used to determine pollutant loading reductions associated with BMP implementation. The Group 1 Excel file was used for these examples.
Example 1
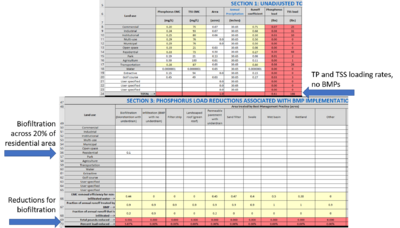
See the adjacent figure for screenshots for this example.
- Assume a city that has been built out since 1960. This would be a Group 1 land use scenario.
- Default loading rates are 0.61 lbs/ac/yr for TP and 166 lbs/ac/yr for TSS
- The city implements biofiltration practices (rain gardens) across 20 percent of the residential area. Residential areas comprise 50 percent of the total area for the city. Since calculations are on 1 acre basis, a value of 0.1 (acre) should be entered in Cell B56 to associate the biofiltration practice with residential areas. Similarly, a value of 0.1 would be entered in Cell B81 of the Estimator for TSS.
- The user could go to the Summary sheet in the Estimator to see results, but the results are also displayed on the sheet where the land use and BMP data are entered, as shown in the adjacent image. For this example , we see that TSS has been reduced by 0.03 lb/ac/yr to 0.58 lbs/ac/yr or a 5.07 percent reduction in loading. TSS was reduced by 11 lbs/ac/yr to 154 lb/ac/yr for a reduction of 6.58 percent.
Example 2
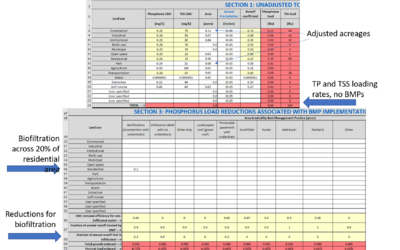
See the adjacent figure for screenshots for this example.
- Assume the same scenario as above except the city has a slightly different land use composition. This would be a Group 1 land use scenario.
- Instead of 0.13 acres of park the city has 0.08 acres. The 0.05 acres must be assigned to other land uses to get calculations on a 1 acre basis. Assume the 0.05 acres is assigned to commercial land use.
- Default loading rates are 0.66 lbs/ac/yr for TP and 184 lbs/ac/yr for TSS
- The city implements biofiltration practices (rain gardens) across 20 percent of the residential area. Residential areas comprise 50 percent of the total area for the city. Since calculations are on 1 acre basis, a value of 0.1 (acre) should be entered in Cell B56 to associate the biofiltration practice with residential areas. Similarly, a value of 0.1 would be entered in Cell B81 of the Estimator for TSS.
- The user could go to the Summary sheet in the Estimator to see results, but the results are also displayed on the sheet where the land use and BMP data are entered, as shown in the adjacent image. For this example , we see that TSS has been reduced by 0.03 lb/ac/yr to 0.63 lbs/ac/yr or a 4.73 percent reduction in loading. TSS was reduced by 11 lbs/ac/yr to 173lb/ac/yr for a reduction of 5.93 percent.
Note in this second example that the biofiltration practices achieve the same reduction in pounds but the percent pollutant reduction is lower because the initial loading rates, in lb/ac/yr, are higher.
Notes
There are several considerations when using the above information as a surrogate for pollutant loading from a city. These are summarized below. Cities should carefully review these to ensure the conditions in their area of interest meet these conditions.
- Cities should determine if the recategorization of Met Council land uses is appropriate for their situation. In particular, undeveloped land should be assessed. It was categorized as open space for this analysis. Open space, as used in the Estimator, has very low pollutant loading rates. Some undeveloped land may not be appropriately categorized as open space. Examples include abandoned land that is compacted or has significant impervious surface, parking areas, and land on steep slopes with erodible soils.
- Agriculture encompasses a wide range of land uses, ranging from row crop to pasture. The default values used in the Estimator are not based on a rigorous literature review and agriculture is lumped into a single land use. Cities should carefully review the default values to ensure they are accurate. While the Manual does not provides a rigorous analysis, it does list several references for agricultural land uses and includes curve numbers for different types of agricultural land.
- Pollutant loading from residential areas, particularly phosphorus, is dominated by tree cover. In conducting our literature review of land uses, we did not feel there was sufficient data to divide residential land uses into subcategories. The Manual does, however, provide a discussion of how to adjust emcs based on tree canopy cover. The default emc for TP in the Estimator assumes 20 percent tree canopy cover.
- Transportation has very high pollutant loading per acre, but most studies focus on high traffic corridors. The Met Council data reflect this in using the category Major Highway. Thus, the default values for transportation in the Estimator represent these major transportation corridors.
Definitions of land uses
- Commercial: Commercial land use is the use of land for commercial purposes including building offices, shops, resorts and restaurants as opposed to construction of a residential house.
- Industrial: Land used for commercial establishments, manufacturing plants, public utilities, mining, distribution of goods or services, administration of business activities, research and development facilities, warehousing, shipping, transporting, remanufacturing, stockpiling of raw materials, storage, repair and maintenance of commercial machinery or equipment, and waste management
- Institutional: Land used primarily for religious, governmental, educational, social, cultural or major health care facilities (where they have beds for overnight stay). Examples include: schools, synagogues, cemeteries, hospitals, nursing homes, city halls, county and state fairgrounds, and museums.
- Open space: Open space consists of land that is undeveloped. Typically it will not contain buildings or other built structures. Many open spaces are accessible to the public. Open space generally consists of green space (land that is partly or completely covered with grass, trees, shrubs, or other vegetation). Abandoned parcels lacking structures may be considered open space, but it is generally more accurate to include these areas in the land use that existed prior to the parcel being vacant, or including it in adjacent land use categories.
- Park: Land used for park and recreational sport assembly or passive open space. This may occur at community level fields, regional parks, public parks, private parks, campgrounds, small urban parks, playgrounds, rest areas, and other venues used for indoor and outdoor sporting events or like purposes.
- Residential: any real property or portion thereof which is used for housing human beings. This term includes property used for schools, day care centers, nursing homes, or other residential-style facilities or recreational areas.
- Transportation: includes major transportation corridors where the land use is exclusively transportation. These areas are typically highly impervious and may include only small vegetated areas consisting of swales or medians, and relatively small right-of-way areas. This land use does not include arterial streets in residential, commercial, and industrial areas.
To see Met Council definitions for different land uses, link here.
This page was last edited on 8 December 2022, at 14:57.


