![]()
TP and TSS credits and guidance for manufactured treatment devices (mtds)
| Phosphorus removal credits, as a percent of total phosphorus passing through the device. Note that to calculate the mass or percent of total phosphorus removed (e.g. annual phosphorus removed), you must multiply the number below by the amount of water being treated or by the total mass of water entering the device. The calculation of total phosphorus removed is therefore a function of device sizing. | |||
| Device | Tier 1 | Tier 2 | Tier 3 |
|---|---|---|---|
| BayFilter w/EMC Media | 50 | 60 | |
| BioPod Biofilter | 50 | 60 | |
| BoxlessBioPod Biofilter | 50 | 60 | |
| ecoStorm plus | 50 | ||
| Filterra Bioscape | 50 | 60 | |
| Filterra System | 50 | 60 | |
| FloGard Perk Filter | 50 | 60 | |
| Media Filtration System | 50 | ||
| MWS-Linear Modular Wetland | 50 | 54 | |
| StormFilter using PhosphoSorb Media | 50 | 60 | 70 |
| StormGarden Modular Stormwater Bio-filtration System | 50 | 53 | |
| The Kraken | 50 | 58 | |
| Up-Flo Filter w/Filter Ribbons | 50 | ||
| Jellyfish Filter | 50 | 56 | |
| StormTree Biofiltration practice | 50 | 60 | |
This page provides total phosphorus (TP) and total suspended solid (TSS) removal credits (stormwater credit) for manufactured treatment devices (mtds) in the State of Minnesota. The page includes supporting information, guidance and recommendations, and links to additional information.
Contents
- 1 Definition and acronyms
- 2 What manufactured treatment devices are credited?
- 3 TP and TSS credits
- 4 Derivation of TP and TSS credits for specific mtds
- 4.1 Filterra System
- 4.2 StormFilter using PhosphoSorb Media
- 4.3 Up-Flo Filter w/Filter Ribbons
- 4.4 MWS-Linear Modular Wetland
- 4.5 BayFilter w/EMC Media
- 4.6 StormGarden Modular Stormwater Bio-filtration System
- 4.7 BioPod Biofilter
- 4.8 FloGard Perk Filter
- 4.9 The Kraken
- 4.10 Jellyfish Filter
- 4.11 Contech Stormfilter using ZPG Media
- 4.12 StormTree Biofiltration filter
- 5 Calculating annual volume treated
- 6 Analysis of TAPE data to determine applicability for deriving Minnesota credits
- 6.1 Is the particle size distribution for stormwater runoff similar between the TAPE monitored sites and Minnesota?
- 6.2 How does total phosphorus removal correlate with concentrations of TSS and the distribution of particulate and dissolved phosphorus in runoff?
- 6.3 Is TP removal affected by influent phosphorus and TSS concentrations?
- 7 Rationale for and applicability of total phosphorus (TP) credits
- 8 Applicability of Tier 2 TP credits
- 9 Protocol for monitoring
- 10 Technical team (Acknowledgements)
- 11 References
Definition and acronyms
A manufactured treatment device (mtd) is a pre-fabricated stormwater treatment structure utilizing settling (sedimentation), filtration, absorptive/adsorptive materials, vortex separation, vegetative components, and/or other appropriate technology to remove pollutants from stormwater runoff (New Jersey Department of Environmental Protection). MTDs are typically proprietary devices.
Acronyms
- CSW - construction stormwater
- DP – dissolved phosphorus
- GULD - General Use Level Designation
- LCL – Lower confidence limit of the mean (usually the 95% LCL)
- MTD (mtd) – manufactured treatment device
- MPCA - Minnesota Pollution Control Agency
- OP – orthophosphorus
- PP - particulate phosphorus
- TP – total phosphorus
- TAPE - Technology Assessment Program – Ecology
- TER – Technical Evaluation Report
- TPR - total phosphorus removed
- TSS – total suspended solids
- TSSR - total suspended solids removed
What manufactured treatment devices are credited?
Only Washington State Technology Assessment Protocol - Ecology (TAPE) devices that received General Use Level Designation (GULD) for Basic Treatment (TSS) and/or Phosphorus Treatment (TP) are credited for pollutant reductions. These devices typically are permanent structural practices providing primary treatment for pollutants. Devices designated for Pretreatment through the TAPE program are not included regardless of whether they have received GULD certification, since these are considered pretreatment practices in Minnesota. Since pretreatment is required under the Construction Stormwater General Permit (CSW permit), they are not credited for pollutant removal. The credits developed for practices requiring pretreatment such as infiltration and filtration systems already assume an adequate pretreatment system is included (see sections 16.6 and 17.5 of the Construction Stormwater general permit). For more information on pretreatment devices, link here.
Pollutant removal credits are provided for the following devices. Tiered means there are multiple credit levels based on specific criteria, while non-tiered means there is a single value (i.e. just one credit value).
| Device name | Manufacturer | TAPE approval date | Total suspended solids | Total phosphorus |
|---|---|---|---|---|
| BayFilter w/EMC Media | BaySaver Technologies, Inc. | 4/15/17 | Non-tiered | Tiered |
| BioPod Biofilter | Oldcastle Infrastructure, Inc. | 10/28/19 | Non-tiered | Tiered |
| BoxlessBioPod Biofilter | Oldcastle Infrastructure, Inc. | 2/12/21 | Non-tiered | Tiered |
| ecoStorm plus | Watertectonics, Inc. | 1/9/13 | Non-tiered | Non-tiered |
| Filterra Bioscape | CONTECH Engineered Solutions, LLC. | 9/16/19 | Non-tiered | Tiered |
| Filterra System | CONTECH Engineered Solutions, LLC. | 6/11/20 | Non-tiered | Tiered |
| FloGard Perk Filter | Oldcastle Infrastructure, Inc. | 8/9/18 | Non-tiered | Tiered |
| Media Filtration System | CONTECH Engineered Solutions, LLC. | 11/15/16 | Non-tiered | Non-tiered |
| MWS-Linear Modular Wetland | CONTECH Engineered Solutions, LLC. | 12/16/19 | Non-tiered | Tiered |
| StormFilter using PhosphoSorb Media | CONTECH Engineered Solutions, LLC. | 1/2/20 | Non-tiered | Tiered |
| StormFilter using ZPG Media | CONTECH Engineered Solutions, LLC. | 4/14/17 | Non-tiered | Non-tiered |
| StormGarden Modular Stormwater Bio-filtration System | Rotondo Environmental Solutions | 8/28/19 | Non-tiered | Tiered |
| The Kraken | CONTECH Engineered Solutions, LLC. | 12/16/19 | Non-tiered | Tiered |
| Up-Flo Filter w/Filter Ribbons | Hydro International | 3/5/19 | Non-tiered | Non-tiered |
| Jellyfish Filter | CONTECH Engineered Solutions, LLC. | 1/27/21 | Non-tiered | Tiered |
| StormTree Biofiltration | StormTree | 10/19/2021 | Non-tiered | Tiered |
| Tiered means there are multiple credit levels based on specific criteria, while non-tiered means there is a single value (i.e. just one credit value) | ||||
TP and TSS credits
The procedure for developing credits is described in a document Protocol for assigning credits for phosphorus and total suspended solids (TSS) for manufactured treatment devices. This section provides an overview of this procedure.
To derive credits for GULD-approved mtds, data were compiled from Technical Evaluation Reports (TERs) for Washington State’s Technology Assessment Program – Ecology (TAPE). We compiled and analyzed data for all storm events for each device. A summary of the analysis is provided in the adjacent table. The lower confidence limit (LCL) was derived using Washington State’s bootstrap calculator. TP credits for each practice are provided in this table.
Note the data summary table includes TAPE analysis and analysis of all data with TP influent concentrations exceeding 0.05 mg/L. TAPE analysis is based on samples with influent concentrations of 0.1 to 0.5 mg/L for TP. The analysis of data with concentrations greater than 0.051 represents the 5th percentile concentration for runoff samples from the National Stormwater Quality Database, Rainfall Region 1 (i.e. 95% of samples from that database exceed 0.05 mg/L).
Summary statistics for data collected for Washington State TAPE GULD certification. NOTE: These data are not to be applied to crediting for mtds in Minnesota. For mtd credits, link here
Link to this table
| Manufactured treatment device | Median inflow TP (mg/L) | Median inflow TSS (mg/L) | TP Removal (%) | TSS removal (%) | ||||||||||
|---|---|---|---|---|---|---|---|---|---|---|---|---|---|---|
| Number samples | Data with influent > 0.05 mg/L TP | TAPE analysis | All data | TAPE analysis | ||||||||||
| Data with influent > 0.05 mg/L TP | Meeting TAPE criteria | Median | Mean | LCL | TAPE median | TAPE LCL | Median | Mean | LCL | TAPE median | ||||
| Filterra System | 0.090 | 43.5 | 17 | 10 | 69.0 | 66.8 | 59.0 | 78.5 | 69.2 | 89.5 | 86.2 | 82.8 | 89.3 | |
| Filterra Bioscape - see Filterra System | ||||||||||||||
| StormFilter using PhosphoSorb Media | 0.280 | 389 | 17 | 16 | 81.5 | 77.4 | 69.9 | 78.7 | 63.6 | 91.6 | 88.1 | 84.8 | 89.0 | |
| Up-Flo Filter w/Filter Ribbons | 0.109 | 29 | 20 | 13 | 50.3 | 41.5 | 31.0 | 57.1 | 49.9 | 75 | 67.6 | 59.9 | 77.5 | |
| MWS-Linear Modular Wetland | 0.103 | 44 | 24 | 16 | 61.3 | 60.6 | 52.5 | 63.3 | 54.0 | 81.9 | 76.6 | 71.2 | 82.9 | |
| BayFilter w/EMC Media1 | 0.160 | 53 | 12 | 11 | 68.6 | 64.0 | 59.8 | 68.6 | 58.5 | 89.3 | 86.1 | 81.12 | 89.3 | |
| StormGarden Modular Stormwater Bio-filtration System | 0.078 | 29 | 20 | 15 | 58.9 | 57.4 | 52.9 | 58.9 | 43.2 | 89.2 | 86.0 | 82.8 | 91.9 | |
| BioPod Biofilter | 0.104 | 40 | 13 | 7 | 71.7 | 66.7 | 59.4 | 75.4 | 62.4 | 83.3 | 86.5 | 82.1 | 91.9 | |
| BoxlessBioPod Biofilter - see BioPod Biofilter | ||||||||||||||
| FloGard Perk Filter | 0.123 | 62.5 | 21 | 15 | 66.5 | 62.3 | 53.0; 58.6 without outlier | 70.7 | 48.8 (60.6 without outlier) | 80.6 | 74.7 | 68.5 | 81.1 | |
| The Kraken | 0.142 | 53 | 14 | 10 | 74.5 | 71.9 | 63.9 | 83.6 | 71.3 | 90.6 | 87.4 | 77.5 | 90.7 | |
| Jellyfish Filter | 0.338 | 134 | 23 | 18 | 75.2 | 73.6 | 68.2 | 71.0 | 66.8 | 86.2 | 80.0 | 74.1 | 78.4 | |
| StormTree biofiltration | 0.118 | 38 | 27 | 29 | 62 | 57 | 51 | 68 | 61 | 93 | 92 | 90 | 92 | |
| Media Filtration System | Though this device is GULD certified, it is not used in Minnesota. We therefore did not analyze the data. | |||||||||||||
| Stormfilter using ZPG Media | Though this device is GULD certified, it is not used in Minnesota. We therefore did not analyze the data. | |||||||||||||
| ecoStorm plus | We have not received data for this device | |||||||||||||
| 1 Only data meeting TAPE inflow requirements was available. 2 Six outflow concentrations were at the reporting level of 2.5 mg/L; we used half the reporting limit in our analysis |
||||||||||||||
In Washington State, TAPE-certified practices receive 50 percent credit for TP and 80 percent credit for TSS. Some devices appear capable of removing higher percentages of these pollutants. We therefore created a tiered credit system in which higher TP removal credits may be given provided certain conditions are met. A tiered approach to crediting allows flexibility in selecting practices and associated conditions that may affect performance, such as influent water quality and operation and maintenance.
Data from the TERs indicate differing performance levels for each device. It is not possible to develop uniform credits across all devices. We therefore chose the following approach to crediting.
- TSS credit is determined as follows:
- The lower 95th% confidence limit (LCL) for all samples from TAPE monitoring, calculated using Washington TAPE’s Bootstrap Calculator or
- the LCL for all samples from other monitoring that follows monitoring protocol described here, calculated using Washington TAPE’s Bootstrap Calculator.
- If the LCL is less than 80%, MPCA staff may assign a value of 80% if additional analysis and review indicates the device is likely to achieve 80% TSS removal under most storm runoff conditions. Factors considered in this determination include but are not limited to low influent TSS concentrations during monitoring, exceptionally small particle size in monitoring runoff, or laboratory analysis under conditions considered more representative of runoff than conditions that existed during field monitoring.
- The TSS credit cannot exceed 85%
- Tier 1 - TP
- Credit: 50 percent reduction
- Conditions for receiving credit
- Inspect manufactured treatment device a minimum of twice during year 1. Conduct inspections following manufacturer’s instructions/recommendations (Click on links to information for the device). Use maintenance indicators provided by manufacturers to determine if maintenance is needed. Maintenance procedures should follow manufacturer’s guidelines. After year 1, follow manufacturers inspection, operation, and maintenance schedule and procedures unless otherwise required or unless year 1 inspections indicate a need for increased inspection and/or operation and maintenance. Determine future inspection and maintenance schedules from findings during the first year of operation.
- Comply with appropriate configurations and Use conditions from TAPE. These can be found on the individual device pages (see links below).
- Tier 2 - TP
- Credit:
- based on the lower of the following:
- the 95% LCL for samples with influent concentrations between 0.1 and 0.5 mg/L, calculated using Washington TAPE’s Bootstrap Calculator, or
- the 95% LCL for samples with influent concentrations between the 5th percentile TP concentration, as defined below, and 0.5 mg/L, calculated using Washington TAPE’s Bootstrap Calculator, or
- TP removal calculated using the equation TPR=(PPF∗TSSR) = (0.75∗TSSR) where PPF is the fraction of TP in particulate form, assumed to be 0.75 (75 percent) and TSSR is the 95% LCL for TSS.
- based on the lower of the following:
- Conditions for receiving credit:
- The Tier 2 credit cannot exceed 60% (if the Tier 2 value is 50% or less, calculated using the above methods, no Tier 2 value is assigned)
- Must meet Tier 1 conditions.
- DP should be 25 percent or less of TP. Since monitoring will not likely be implemented for these devices, we provide guidance below for determining if site conditions may affect the credit.
- Inspect manufactured treatment device monthly during the frost free season for the first year of operation after construction. Conduct inspections following manufacturer’s instructions/recommendations. Use maintenance indicators provided by manufacturers to determine if maintenance is needed. Maintenance procedures should follow manufacturer’s guidelines.
- Credit:
- The 5th percentile TP concentration represents a concentration which is exceeded in 95% of samples. This value is subject to change based on the best available data. Changes in the 5th percentile TP concentration will affect the Tier 2 TP credit. As of January, 2022, the National Stormwater Quality Database, EPA Rainfall Region 1, is used to estimate the 5th percentile TP concentration. This value is 0.05 mg-TP/L (n=598).
- Tier 3 - TP
- The lower of a) the two LCLs calculated for Tier 2 (see above) or b) TP removal using the LCL for TSS, a PP:TP ratio of 0.75, and calculated from Eq. 1 (see below), if it exceeds 60%, plus specific design, construction, operation, maintenance, and assessment requirements described for the mtd device in the Minnesota Stormwater Manual. See the applicable mtd in this section of the manual.
- A credit for dissolved phosphorus (DP) removal in addition to the Tier 2 credit if the device has an MPCA-approved mechanism for permanently retaining dissolved phosphorus other than volume retention. The credit is determined by MPCA staff. The MPCA retains discretion at assigning higher or lower removal values for a specific device for DP based on available data.
- A TP credit of 100% for runoff permanently retained by the device plus the Tier 2 credit for runoff not retained. See Protocol for assigning credits for phosphorus and total suspended solids (TSS) for manufactured treatment devices for an example calculation. The credit is calculated as an instantaneous volume captured and infiltrated by the device into the underlying subsoil. Infiltration must be calculated as an average annual volume infiltrated using a method approved by the MPCA. Infiltration must meet the 48 hour drawdown requirement.
- Conditions for receiving credit:
- Must meet Tier 1 and Tier 2 conditions
- Must meet any additional requirements for the applicable mtd defined in this section of the manual.
The adjacent table provides TSS and TP removal credits for mtds. This credit only applies to the water treated by the device. To calculate annual pollutant mass removal, the removal credit must be multiplied by the volume treated. Link here for information on determining annual volume to apply credit.
To receive the credit(s), follow use conditions for each device, found at the appropriate link below.
- BayFilter w/EMC Media
- BioPod Biofilter
- BoxlessBioPod Biofilter
- ecoStorm plus
- Filterra Bioscape
- Filterra System
- FloGard Perk Filter
- Media Filtration System
- MWS-Linear Modular Wetland
- StormFilter using PhosphoSorb Media
- StormFilter using ZPG Media
- StormGarden Modular Stormwater Bio-filtration System
- The Kraken
- Up-Flo Filter w/Filter Ribbons
- Jellyfish Filter
Credits for manufactured treatment devices. The credits are expressed as a percent removal.
Link to this table
| Device | Manufacturer | Total phosphorus (%) | Total suspended solids (%) | ||
|---|---|---|---|---|---|
| Tier 1 (Basic) | Tier 2 | Tier 3 | |||
| BayFilter w/EMC Media | BaySaver Technologies, Inc | 50 | 60 | 85 | |
| BioPod Biofilter with Curb Inlet | Oldcastle Infrastructure, Inc. | 50 | 60 | 82 | |
| ecoStorm plus | Watertectonics, Inc. | 50 | |||
| Filterra Bioscape | CONTECH Engineered Solutions, LLC. | 50 | 60 | 82 | |
| Filterra System | CONTECH Engineered Solutions, LLC. | 50 | 60 | 82 | |
| FloGard Perk Filter | Oldcastle Infrastructure, Inc. | 50 | 53 | 80 | |
| Media Filtration System | CONTECH Engineered Solutions, LLC. | 50 | |||
| MWS-Linear Modular Wetland | Bio Clean Environmental Services, Inc. (A Forterra Company) | 50 | 54 | 80 | |
| StormFilter using PhosphoSorb Media | CONTECH Engineered Solutions, LLC. | 50 | 60 | 70 | 85 |
| Stormfilter using ZPG Media | CONTECH Engineered Solutions, LLC. | 50 | 80 | ||
| StormGarden Modular Stormwater Bio-filtration System | Environmental Solutions | 50 | 53 | 83 | |
| The Kraken | CONTECH Engineered Solutions, LLC. | 50 | 58 | 80 | |
| Up-Flo Filter w/Filter Ribbons | Hydro International | 50 | 80 | ||
| Jellyfish | Contech | 50 | 56 | 80 | |
| StormTree biofiltration | StormTree | 50 | 60 | 85 | |
Derivation of TP and TSS credits for specific mtds
This section provides summaries of TAPE monitoring data for each device, including derivation of TSS and TP credits.
Filterra System
- Tier 1 TP = 50%; Tier 2 TP = 59%; no Tier 3 credit; TSS = 82%
- Does the device have a known mechanism for retaining dissolved phosphorus - No
- Does TP removal percentage decrease as influent TP concentration decreases below 0.1 mg/L - Yes
- Median removal for influent >= 0.1 mg/L - 78.5% (n=10); influent < 0.1 - 44% (n=11)
- p = 0.0003
- 95% boot strap LCLs: 52% for all data (22 samples), 58.9% for data with influent concentrations > 0.05 mg/L (17 samples), and 69% for TAPE analyzed data (10 samples)
- Recommended Tier 2 value is the LCL for all data with inflow concentrations greater than 0.05 mg/L = 59% since this value is lower than the TAPE LCL and represents a lower bound for TP inflow concentrations
- Because there is no known mechanism for removing DP, no Tier 3 credit is given
- TSS removal credit is the LCL for all data = 82%, since this is lower than the TAPE value of 86%
- Observations
- Median influent TSS and TP concentrations (43.5 and 0.09 mg/L, respectively) are within expected ranges but on the low end of those ranges
- Orthophosphate data was collected but influent concentrations for all but two samples were at or below the reporting level (0.01 mg/L)
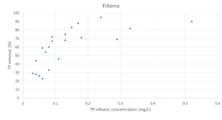
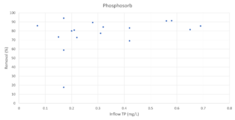
StormFilter using PhosphoSorb Media
- Tier 1 TP = 50%; Tier 2 TP = 60%; Tier 3 credit = 70%; TSS = 85%
- Does the device have a known mechanism for retaining dissolved phosphorus - Yes
- Does TP removal percentage decrease as influent TP concentration decreases below 0.1 mg/L - Cannot determine this since only one sample was less than 0.1 mg/L. It does not appear removal is affected by inflow concentrations for the range of influent concentrations observed. There is one very low removal value that appears to be an outlier.
- 95% boot strap LCL is 69.7% for all data and 63.6% for TAPE analyzed data
- Recommended Tier 2 value is 60% based on the restriction of 60% removal for Tier 2
- Recommended Tier 3 value = 70%.
- The practice contains perlite, which contains aluminum oxides that can sorb dissolved phosphorus.
- Total phosphorus removal by the device in TAPE studies was greater than for other mtds and showed removal of dissolved P (SRP), although DP concentrations were low (typically less than 0.05 mg/L). TP removal may have been influenced by very high TSS influent concentrations (>300 mg/L).
- In a study conducted at Mitchell Community College in North Carolina (2012), median and mean removal of DP was 69 and 74 percent, respectively. Sample size was 5.
- In a laboratory study by Lenart et al., the media achieved DP removal of 70% for 1000 pore volumes and 55% for 2000 pore volumes. Influent consisted of 0.5 mg/l Potassium Dihydrogen Phosphate
- In a study conducted by Ma et al. (2011) and published in the Journal of Irrigation and Drainage Engineering, adsorption isotherms for the engineered media (later incorporated into the Phosphosorb device) indicated significant removal of dissolved phosphorus. Removal rates were approximately 50% up to 500 pore volumes and 70% after 2000 pore volumes. Influent concentration was 0.5 mg/L DP.
- Conclusion: Studies suggest Phosphorsorb can achieve long-term DP removal of 30 to 50%.
- Currently mtd TP removal values in the Manual are based on the assumption that particulate P accounts for 75% of TP. Assuming a 30% removal value and a DP fraction of 25%, and with a TP removal of 60% for this device based only on PP removal, the TP removal is 70% (60 + 10).
- TSS removal credit is the maximum credit of 85% based on an LCL of 86% for all data
- Observations
- Median influent TSS concentration was very high (389 mg/L) and the median particle size (100 microns) was high. These may account for the high removal rates for TSS.
- Median influent TP concentration was 0.28 mg/L, which is typical of Minnesota stormwater runoff
- Dissolved phosphorus, orthophosphate, or soluble reactive phosphorus were sampled but most samples were below reporting limits. Analyzing data for six samples with detectable concentrations, median removal of DP was 32% and mean removal was 39% using the reporting limit and 54% using half the reporting limit.
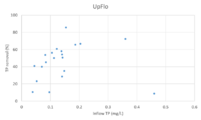
Up-Flo Filter w/Filter Ribbons
- Tier 1 TP = 50%; No Tier 2 or Tier 3 value recommended; TSS = 80%
- Does the device have a known mechanism for retaining dissolved phosphorus - No
- Does TP removal percentage decrease as influent TP concentration decreases below 0.1 mg/L - Yes
- Median removal for influent >= 0.1 mg/L - 56.1% (n=11); influent < 0.1 - 10.5% (n=13)
- p = 0.001
- The 95% boot strap TP-removal LCL for TAPE-analyzed data was 49.9%. The LCL for all data was 19.1%, but there appeared to be multiple outliers in the dataset. The TAPE approval document noted the small median particle size (11 microns) in runoff to the device, citing multiple times when the device became clogged and required maintenance: "The system was subjected to atypical sediment loading and needed to be serviced after 4 months, or 12.7% of a water year. Monitoring personnel observed similar sediment loading and blinding issues with other systems evaluated at the Test Facility. The runoff from the Test Facility is not expected to be characteristic of other urban runoff applications". We therefore recommend using the TAPE LCL of 50% for Tier 1 TP credit.
- No Tier 2 or Tier 3 credit is given for this device based on data collected for TAPE certification.
- TSS credit is the TAPE default of 80% since the LCL was less than 80%
- Observations
- Median influent TSS and TP concentrations (29 and 0.11 mg/L, respectively) are within expected ranges but on the low end of those ranges
- Orthophosphate data was collected but the median influent concentration was at the reporting limit (0.01 mg/L). For samples with detectable influent concentrations, the median removal was 0% and the mean removal was -9%.
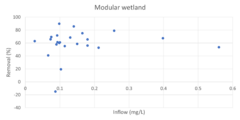
MWS-Linear Modular Wetland
- Tier 1 TP = 50%; Tier 2 = 53%; No Tier 3 value; TSS = 80%
- Does the device have a known mechanism for retaining dissolved phosphorus - No
- Does TP removal percentage decrease as influent TP concentration decreases below 0.1 mg/L - No
- Median removal for influent >= 0.1 mg/L - 62% (n=11); influent < 0.1 - 66% (n=12)
- p = 0.43
- There is one value that appears to be an outlier
- The 95% boot strap LCL is 52.7% for data with influent concentrations greater than 0.05 mg/L and 54.1% for TAPE analyzed data. The recommended Tier 2 value is 53%.
- We do not recommend a specific Tier 3 value based on this analysis
- TSS credit is the TAPE default of 80% since the LCL was less than 80%
- Observations
- Median influent TSS and TP concentrations (44 and 0.10 mg/L, respectively) are within expected ranges but on the low end of those ranges
- Orthosphosphate data was collected. During the first year of sampling influent concentrations were typically at or below the reporting limit (0.01 mg/L). In the second year of sampling there were seven monitoring events with relatively high influent OP concentrations (0.06-0.96 mg/L). Removal of OP for these events ranged from 16 to 88 percent, with a median removal of 59 percent.
BayFilter w/EMC Media
- Tier 1 TP = 50%; Tier 2 = 60%; no Tier 3 credit; TSS = 85%
- Does the device have a known mechanism for retaining dissolved phosphorus - No
- Does TP removal percentage decrease as influent TP concentration decreases below 0.1 mg/L - Cannot determine this since only one sample was less than 0.1 mg/L. Of the 12 samples collected, the three lowest removal percentages were for influent concentrations less than 0.15 mg/L.
- The 95% boot strap LCL is 59.8% for all data and 58.5% for TAPE analyzed data
- Recommended Tier 2 value is 60%
- Because there is no known mechanism for removing DP, no Tier 3 credit is given
- TSS credit is 85%. This is the LCL for all data. There appears to be one outlier for a sample having a low influent concentration. If this outlier is removed, the LCL is 87%.
- Observations
- Median influent TSS and TP concentrations (53 and 0.16 mg/L, respectively) are within expected ranges
- Orthophosphate data was not available in the TER we received.
StormGarden Modular Stormwater Bio-filtration System
- Tier 1 TP = 50%; Tier 2 = 52%; no Tier 3 credit; TSS = 83%
- Does the device have a known mechanism for retaining dissolved phosphorus - No
- Does TP removal percentage decrease as influent TP concentration decreases below 0.1 mg/L - No
- Median removal for influent >= 0.1 mg/L - 59% (n=15); influent < 0.1 - 49% (n=6)
- p = 0.44
- The 95% boot strap LCL is 43.2% for TAPE analyzed data and 51.6% for samples with concentrations greater than 0.05 mg/L. However in the TAPE-approval document, the reported LCL was 53.4% based on inclusion of data below 0.1 mg/L.
- We recommend a TP credit of 52% based on the LCL for all data and TAPE's use of a similar data set
- Because there is no known mechanism for removing DP, no Tier 3 credit is given
- The recommended TSS credit is 83% based on the LCL of 82.8%
- Observations
- Median influent TSS and TP concentrations (29 and 0.078 mg/L, respectively). These concentrations are low compared to Minnesota stormwater runoff.
- Orthophosphate data was collected, with a median concentration of 0.009 mg/L. The majority of samples were at or below the reporting limit. For samples with detectable influent concentrations, median removal was 6% and mean removal was -27%.
- Removal percentages were unaffected by influent concentrations even with some very low influent concentrations (less than 20 mg/L for TSS and less than 0.1 mg/L for TP).
BioPod Biofilter
- Tier 1 TP = 50%; Tier 2 = 59%; no Tier 3 credit; TSS = 82%
- Does the device have a known mechanism for retaining dissolved phosphorus - No
- Does TP removal percentage decrease as influent TP concentration decreases below 0.1 mg/L - No. However, the lowest removal percentage was for a sample with an influent concentration of 0.104. Removing this data point gives a p-value of 0.05 comparing samples with influent > 0.1 mg/L and less than 0.1 mg/L. We therefore calculated an LCL for samples with influent concentrations greater than 0.05 mg/L.
- Median removal for influent >= 0.1 mg/L - 60% (n=6); influent < 0.1 - 75% (n=7)
- p = 0.23
- The 95% boot strap LCL was 62.4% for TAPE-analyzed data and 59.5% for samples with concentrations greater than 0.05 mg/L
- The recommended Tier 2 value is 59%
- Because there is no known mechanism for removing DP, no Tier 3 credit is given
- The recommended TSS credit is 82% based on the LCL of 82.1%
- Observations
- Median influent TSS and TP concentrations were 40 and 0.104 mg/L, respectively. The TP concentration is low compared to Minnesota stormwater runoff.
- Orthophosphate data was not collected.
- TSS removal appeared to decrease at influent concentrations below 40 mg/L.
FloGard Perk Filter
- Tier 1 TP = 50%; Tier 2 = 55%; No Tier 3 value recommended; TSS = 80%
- Does the device have a known mechanism for retaining dissolved phosphorus - No
- Does TP removal percentage decrease as influent TP concentration decreases below 0.1 mg/L - Uncertain. Because only 5 samples had influent concentrations less than 0.1 mg/L and because the p-value was 0.08, we calculated an LCL for samples with influent concentrations of 0.05 mg/L and greater.
- Median removal for influent >= 0.1 mg/L - 34% (n=5); influent < 0.1 - 71% (n=14)
- p = 0.08
- The 95% boot strap LCL was 48.8% for TAPE-analyzed data and 50.7% for all data. However, there was one outlier where TP removal was negative. Removing this outlier gives a TAPE-LCL of 60.6% and an overall LCL of 55.4%
- The recommended Tier 2 value is 55%
- No Tier 3 value is recommended
- TSS credit is the TAPE default of 80% since the LCL was less than 80%
- Observations
- Median influent TSS and TP concentrations (62.5 and 0.123 mg/L, respectively). The TP concentration is low compared to Minnesota stormwater runoff.
- Orthophosphate data was collected, with a median influent concentration of 0.014 and a mean of 0.034. Influent concentrations exceeded 0.05 mg/L in five samples and exceeded 0.10 mg/L in two samples. Overall median removal for OP was 23.8%, with a tendency for increased removal at higher influent concentrations. Mean removal was 19%.
- TSS removal appeared to decrease at influent concentrations below 40 mg/L.
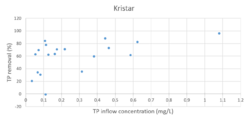
The Kraken
- Tier 1 TP = 50%; Tier 2 = 58%; no Tier 3 credit; TSS = 80%
- Does the device have a known mechanism for retaining dissolved phosphorus - No
- Does TP removal percentage decrease as influent TP concentration decreases below 0.1 mg/L - Uncertain. Only 3 samples had influent concentrations less than 0.1 mg/L. We therefore calculated an LCL for samples with influent concentrations of 0.05 mg/L and greater.
- Median removal for influent >= 0.1 mg/L - 61% (n=3); influent < 0.1 - 83% (n=11)
- p = 0.12
- The 95% boot strap LCL was 66.3% for TAPE-analyzed data and 63.9% for all data
- Using a LCL of 77.5% for TSS, the theoretical TP removal is 58%. This is the recommended Tier 2 value
- Because there is no known mechanism for removing DP, no Tier 3 credit is given
- TSS credit is the TAPE default of 80% since the LCL was less than 80%
- Observations
- Median influent TSS and TP concentrations (53 and 0.142 mg/L, respectively). The TP concentration is low compared to Minnesota stormwater runoff.
- Orthophosphate data was collected, with a median influent concentration of 0.012 and a mean of 0.016. Overall median removal for OP was 37.3% and mean removal was 35%.
- Only one TSS influent sample was less than 20 mg/L and removal for this sample was 50%.
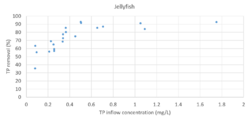
Jellyfish Filter
- Tier 1 TP = 50%; Tier 2 = 56%; no Tier 3 credit; TSS = 80%
- Does the device have a known mechanism for retaining dissolved phosphorus - No
- Does TP removal percentage decrease as influent TP concentration decreases below 0.1 mg/L - Appears to be yes. Only 3 samples had influent concentrations less than 0.1 mg/L.
- Median removal for influent >= 0.1 mg/L - 55% (n=3); influent < 0.1 - 79% (n=18)
- p = 0.004
- The 95% boot strap LCL was 66.8% for TAPE-analyzed data and 68.2% for all data
- Using a LCL of 74.1% for TSS, the theoretical TP removal is 56%. This is the recommended Tier 2 value
- Because there is no known mechanism for removing DP, no Tier 3 credit is given
- TSS credit is the TAPE default of 80% since the LCL was less than 80%
- Observations
- Median influent TSS and TP concentrations (134 and 0.338 mg/L, respectively). The TSS concentration is high compared to Minnesota stormwater runoff.
- TSS influent concentrations ranged from 13 to 755 mg/L. TSS removal was 68.8% for eight influent samples with concentrations less than 100 mg/L.
- Orthophosphate data was collected, with a median influent concentration of 0.015 and a mean of 0.016. Overall median removal for OP was 31.6% and mean removal was 33%.
Contech Stormfilter using ZPG Media
This device is GULD certified but is not promoted for phosphorus removal in Minnesota. The credits are therefore the TAPE defaults of 50% for TP and 80% for TSS
StormTree Biofiltration filter
- Tier 1 TP = 50%; Tier 2 = 51%; no Tier 3 credit; TSS = 85%
- Does the device have a known mechanism for retaining dissolved phosphorus - No
- Does TP removal percentage decrease as influent TP concentration decreases below 0.1 mg/L - Yes.
- Median removal for influent >= 0.1 mg/L - 67% (n=17); influent < 0.1 - 62% (n=27)
- p = 0.004
- The 95% boot strap LCL was 61.4% for TAPE-analyzed data and 51.4% for all data. The recommended Tier 2 value is 51%.
- No Tier 3 credit is given
- TSS credit is 85%, which is the maximum TSS credit (the LCL removal was 90%)
- Observations
- Median influent TSS and TP concentrations (38 and 0.118 mg/L, respectively). The TSS concentration is low compared to Minnesota stormwater runoff.
- TSS influent concentrations ranged from 16 to 131 mg/L. All but one sample had influent concentrations less than 100 mg/L.
- Orthophosphate data was collected, with a median influent concentration of 0.014 and a mean of 0.016. Overall median removal for OP was -40% and mean removal was -56%. These are very low influent concentrations.
- The median particle size was 83 microns, which is relatively large. This may account for the high TSS removal rates.
- Plots of TP removal (%) as a function of influent TP concentrations (mg/L) Click on an image for enlarged view.
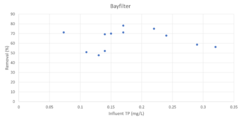
Insufficient data exist to determine if performance decreases with lower influent TP concentrations
Performance decreases with lower influent TP concentrations
It is unclear if performance decreases with lower influent TP concentrations
It is unclear if performance decreases with lower influent TP concentrations


- Plots of TP removal (%) as a function of influent TP concentrations (mg/L) Click on an image for enlarged view.
Performance decreases with lower influent TP concentrations

It is unclear if performance decreases with lower influent TP concentrations
Performance appears to decrease with lower influent TP concentrations


- Plots of TP removal (%) as a function of influent TP concentrations (mg/L) Click on an image for enlarged view.

Performance appears to decrease with lower influent TP concentrations
Performance decreases with lower influent TP concentrations
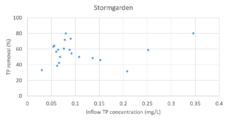
Performance appears unaffected by lower influent TP concentrations


Calculating annual volume treated
The above credits apply to water treated by a device. To determine the quantity of pollutant removed, the volume being treated must be determined. Some devices have some storage built into the system, while others do not.
Pollutant removal is often assumed to represent annual removal based on BMP design. For example, in Minnesota, a device designed to treat the first inch of runoff will typically treat about 85-90 percent of the annual runoff volume from an impervious surface, depending on soils, vegetation, and climate. The remaining runoff bypasses the device untreated. Devices tested and approved in Washington State are required to treat 91% or more of the average annual runoff. Because climatic conditions differ between Washington State and Minnesota, the annual average volume to which the credit applies in Minnesota must be determined. The following are acceptable methods for calculating the average annual volume treated by a device.


- MPCA MTD Annual volume calculator. A calculator was built to estimate annual volume treated by an mtd. The calculator is an Excel spreadsheet and utilizes rainfall data at one-hour (60 minute) intervals collected at the Minneapolis-St. Paul airport from 1988 through 2022. The spreadsheet calculates the runoff generated from an impervious surface and routes the runoff through a device. The flowrate through the device is a user input but cannot exceed the rates described in this manual, which were derived from Washington State’s TAPE monitoring and analysis for the device. See the individual websites for each device for information on the device, including the maximum flowrates.
- The spreadsheet contains separate worksheets for cartridge devices and filter devices. User inputs for cartridge devices include location in Minnesota (from a dropdown), device (from a dropdown), site area in square feet (impervious), cartridge flow rate in gallons per minute, and number of cartridges. The worksheet returns the annual volume treated in cubic feet and the percent of annual runoff treated as a percent. User inputs for filter devices include location in Minnesota (from a dropdown), device (from a dropdown), site area in square feet (impervious), treatment rates in cubic feet per second (provided by the manufacturer), surface area of the media bay in square feet, and the device storage volume in cubic feet. The worksheet returns the annual volume treated in cubic feet and the percent of annual runoff treated as a percent.
- Download the calculator: File:MPCA MTD Sizing Tool v1.xlsx
- Example 1: Cartridge device. Contech’s Stormfilter using phosphosorb is used on a one (1) acre impervious commercial site in Duluth. The unit utilizes 18 inch cartridges. The website for this device shows a maximum flow rate of 12.53 gpm per cartridge. The unit employs 10 cartridges. Annual treatment volume is 94,125 cubic feet or 89.8 percent of annual runoff. To compute the annual TSS and TP removal, multiply the concentrations of these in runoff by 85 percent for TSS and 70 percent for TP. Assuming a concentration of 75 mg/L for TSS and 0.200 for TP, annual pollutant reductions are 374 pounds for TSS and 0.82 pounds for TP.
- Example 2: Filter device. Contech’s Filterra system is used on a one (1) acre impervious commercial site in the Twin Cities. The unit is 8 ft by 8 ft for a surface area of 64 square feet. The allowable flow rate through the device is 0.148 cubic feet per second for phosphorus treatment (see this link). The device storage volume is 36 cubic feet. The unit treats 78,508 cubic feet of water annually, or 70.3 percent of annual runoff. To compute the annual TSS and TP removal, multiply the concentrations of these in runoff by 82 percent for TSS and 59 percent for TP. Assuming a concentration of 75 mg/L for TSS and 0.200 for TP, annual pollutant reductions are 301 pounds for TSS and 0.58 pounds for TP.
- Provide upstream storage. The outlet of the storage device can be sized to keep the discharge rate at the optimal rate for the MTD. An example would be an upstream retention pond designed to capture 90 percent of the annual runoff volume. If all the runoff captured by the pond is treated by the downstream device, the annual treated volume equals the volume captured by the upstream device. If the upstream device provides treatment of a pollutant, this will reduce the pollutant removal efficiency of the downstream device and the pollutant removal credit must be adjusted accordingly.
- Translators. Translators are based on a relationship between volume treated in one location to volume treated in another location. For example, 90 percent annual volume treated in Location A may be equivalent to 80 percent volume treated in Location B. In this example, to treat 90 percent of the annual volume in Location B a BMP would have to be sized up from the same BMP in Location A. Translators have not yet been established for Washington State rainfall and runoff data.
- Modeling. Using Minnesota climate data, a BMP can be sized in a continuous simulation model to determine the percent of total runoff that is captured and treated by a BMP and the runoff that bypasses the BMP.
- Monitoring. Monitoring is based on direct measurement of total runoff volumes and runoff volumes captured and treated by a device. Runoff not captured by a device bypasses the device without treatment. As an example, bypass is determined during TAPE monitoring.
- Devices approved in similar climatic conditions using approved monitoring/testing protocol. Data for devices that have been tested in climate conditions similar to Minnesota can be used to calculate annual volume captured and treated by the device if appropriate protocol have been followed and can be documented. Appropriate protocol are described here.
Analysis of TAPE data to determine applicability for deriving Minnesota credits

Monitoring data used to derive the above credits were taken from Technical Evaluation Reports (TERs) developed for Washington State's TAPE program. Most of this monitoring was conducted in Washington State and all of it was conducted in the Pacific Northwest. Rainfall in this region of the U.S. is classified as a Type 1 rainfall pattern, characterized by low intensity, long duration rain events. Minnesota has a Type 2 rainfall distribution, characterized by less frequent but higher intensity, shorter duration rain events. In addition, analysis of the data suggests pollutant characteristics of runoff differs between the two locations, with Minnesota runoff having, on average, higher concentrations of TP and DP compared to the Pacific Northwest. This may be due to greater intervals between storms in Minnesota, allowing for greater pollutant buildup prior to storms, and to vegetation differences, with many locations in Minnesota characterized by hardwood forest, which may contribute to higher TP and DP concentrations. We therefore conducted a variety of analysis to determine the suitability of using data from the TAPE program to set pollutant removal credits. We addressed the following questions.
- Is the particle size distribution for stormwater runoff similar between the TAPE monitored sites and Minnesota?
- How does total phosphorus removal correlate with concentrations of TSS and the distribution of particulate and dissolved phosphorus in runoff?
- Is performance affected by phosphorus concentration?
Data used in this analysis are found in this spreadsheet.
Is the particle size distribution for stormwater runoff similar between the TAPE monitored sites and Minnesota?
| Study | Median particle size (microns) | Primary land use |
|---|---|---|
| NURP50 (Midwest) | 34 | |
| Selbig | 95 | mixed |
| Selbig | 32 | parking |
| Selbig | 43 | arterial streets |
| Selbig | 80 | feeder streets |
| Selbig | 80 | residential |
| Gonclaves and van Seters (2012) | 23.7 | mixed |
| Gonclaves and van Seters | 12.5 | mixed |
| Gonclaves and van Seters | 16 | parking lot |
| Gonclaves and van Seters | 15 | parking lot |
| Gonclaves and van Seters | 16.4 | parking lot |
| Gonclaves and van Seters | 7.8 | parking lot |
| Kim and Sansalone | 100 (40-400) | |
| Sansalone et al. | 520 | |
| MRSC (WA) | 120 | |
| Penn State (2008) | 8 | Public works |
| Kellner ad Hubbart (MO) | 59 | mixed |
| Charters et al. | 71.5 | roof |
| Anta et al. mixed | 33.5 | |
| Literature | Median = 34.0, mean = 72.0, stdev = 113.9 | |
| Filterra System | 50 | residential |
| Stormwater Management StormFilter using PhosphoSorb media | 100 | transportation |
| Up-Flo Filter w/Filter Ribbons | 11 | transportation |
| MWS-Linear Modular Wetland | 15-45 | parking lot |
| BaySaver Technologies BayFilter w/EMC Media | 54 | commercial |
| FloGard Perk Filter | 60 | |
| StormGarden Modular Stormwater Bio-filtration System | 33 | transportation |
| BioPod | 28 | transportation |
| Flo-Gard | 60 | parking |
| The Kraken | 22 | parking |
| Jellyfish Filter | 58 | parking |
| StormTree biofiltration | 83 | transportation |
| Device summary | Median = 52, mean = 49.1, stdev = 25.8 |
Particle size potentially affects the retention of both TSS and phosphorus. If runoff from the TAPE studies has a significantly different particle size than runoff in Minnesota and particle size affects pollutant retention, TAPE data would not be appropriate for setting credits.
TAPE testing of mtds includes particle size analysis. TAPE requires a modified ASTM 3977 PSD (particle size distribution) analysis and requires that runoff have 50% or more silt-size or smaller particles (50 microns or less). The adjacent table provides a summary of PSD for runoff samples collected through the TAPE program and values from the literature. The data from TAPE sampling have a similar median particle size (41.5 microns) as data from the literature (34.0 microns). There is considerably less variation in the TAPE data (stdev = 25.5) compared to the literature values (stdev = 113.9). The data from the literature are taken from different locations in the U.S. Data from Selbig (Wisconsin) and the NURP Midwest data are potentially more representative of Minnesota runoff. Median values for these are 80 microns for the Selbig data and 34 for the NURP Midwest data.
Several factors potentially affect particle size distribution in runoff, including the following.
- Soil. Locally, soil type can affect the particle size distribution if source areas contribute to stormwater runoff. This will be more common in areas with significant construction activity and in areas with soils that contribute to runoff (e.g. compacted or non-vegetated soils).
- Land use. Studies suggest residential land uses and mixed areas with residential have greater median particle sizes compared to major roads, parking areas, and commercial areas (Selbig and Bannerman, 2012; Zhao, 2010).
- First flush. Some studies show an effect of first flush on particle size, while other studies show no effect. Some studies show increased percentage of fines in the first flush, while other studies show the opposite. Differences in particle size distribution during a runoff event are likely associated with the rainfall characteristics, particularly intensity and duration (Degroot and Weiss, 2008).
- Sampling method. DeGroot and Weiss (2008) state "Preliminary results presented by researchers at St. Anthony Falls Laboratory at the University of Minnesota have called into question the accuracy of automatic samplers, especially with respect [to] particles larger than 44 to 88 microns". We did not find specific studies that investigated the effect of sampling method on the resulting observed particle size distribution.
- Season. Season has generally not been shown to affect particle size, though some studies indicate coarser material in late winter and early spring from residential land uses.
The wide variability in particle sizes for the literature review is expected considering the wide variability in geographic locations, climate and land uses. Monitoring for the TAPE program was conducted within a similar climatic regime and over a narrow range of land use types (primarily transportation areas).
The following conclusions were drawn from our analysis.
- The central tendency for particles is in the silt range
- There is no specific pattern as to why some studies had smaller average particles compared to others
- Some studies showed larger particles in snowmelt compared to rainfall runoff and larger particles in residential compared to commercial runoff
- Season does not appear to affect PSD
- Land use appears to affect PSD, though the variability in PSDs within a given land use is greater than the variability between different land uses
Conclusion: The PSDs used to assess mtd performance were in an acceptable range for Minnesota stormwater runoff.
How does total phosphorus removal correlate with concentrations of TSS and the distribution of particulate and dissolved phosphorus in runoff?
| Summary data from the regression Measured TP removal = a + b*predicted TP removal where the predicted TP removal is calculated using Equation 1. | ||||
| Device | p-value | R2 | Intercept | Slope |
|---|---|---|---|---|
| Filterra System | < 0.001 | 0.54 | -35 | 1.29 |
| FloGard Perk Filter | < 0.01 | 0.34 | -0.94 | 0.93 |
| The Kraken | < 0.001 | 0.65 | -4.01 | 0.84 |
| Up-Flo Filter w/Filter Ribbons | < 0.001 | 0.68 | -1.85 | 0.76 |
| Jellyfish Filter | < 0.001 | 0.81 | -0.69 | 0.95 |


Particle size distributions of mtd effluent were not determined for all devices. Devices having both influent and effluent particle size data showed the devices selectively removed particles larger than silt size.
- Jellyfish Filter: 54% of influent was silt and clay size, 99% of effluent was silt and clay size
- FloGard Perk Filter: 60% of influent was silt and clay size, 94% of effluent was silt and clay size
- The Kraken: Sediment sampling showed silt and clay particles comprised 14% of the total sediment captured while making up about 65% of the total sediment in the influent
Preferential capture of coarse material is common to filtering and sedimentation practices. If a device preferentially removes coarser particles and phosphorus retention varies with particle size, a credit based on monitoring data for that device will under- or over-predict phosphorus removal, depending on which particle size fraction phosphorus preferentially sorbs to. For example, if 50% of runoff is silt size or smaller, 75% of the TP is associated with this fraction, and 25% of the particles a device removes are in this fraction, TP removal is 37.5%, compared to 50% removal if the device does not selectively remove particles and the phosphorus is evenly distributed among particle sizes.
Dissolved phosphorus concentrations are very low in runoff collected for TAPE certification (median orthophosphate concentration across six devices = 0.011 mg/L). For devices that utilize media that does not leach phosphorus, does not retain dissolved phosphorus, and does not selectively remove particle sizes to which phosphorus preferentially sorbs, retention of total phosphorus should correlate with removal of total suspended solids and the fraction of phosphorus that is in particulate form. For example, if a device retains 85% of TSS and does not selectively remove phosphorus (based on selective particle size removal), and if particulate phosphorus is 75% of total phosphorus in runoff, the total phosphorus removal should be 0.85 * 0.75 = 0.6375 or 64%. For this situation, the formula for TP removal as a percent of TP in runoff (TPR) is given by
\( TP_R = PP_F * TSS_R [Eq 1] \)
where PPF is the fraction of TP in particulate form and TSSR is the removal percent for TSS.
We plotted predicted total phosphorus removal versus observed removal for five devices which had sufficient data to calculate the particulate fraction (PPF). To do this, we assumed orthophosphate comprised 70% of dissolved phosphorus. This is based on data from stormwater runoff in Minnesota. The adjacent plot indicates that measured TP removal was generally less than predicted. Equation 1 appeared to be a reasonable predictor of measured TP removal when TP removal was 60% or greater, but the deviation from Eq. 1 increased at lower TP removal values. Summary statistics are provided in the adjacent table.
Because of variability in measured TP removal, we plotted median values for measured versus predicted TP removal. The comparison of median values shows measured and predicted values are relatively similar except for the Up-Flo Filter w/Filter Ribbons device.
In conclusion, measured values from TAPE monitoring may be somewhat skewed toward overpredicting TP removal in situations where PP is a smaller percent (fraction) of TP. Limited data across a range of PP values and uncertainty in converting OP to DP limit the utility of this analysis.
Is TP removal affected by influent phosphorus and TSS concentrations?


We conducted an extensive literature review of TP concentrations in stormwater runoff. Based on that review, the following event mean concentrations, in mg/L, are recommended. Ranges from the literature review are shown in parentheses.
- Commercial - 0.200 (0.200-0.340)
- Industrial - 0.235 (0.230-0.550)
- Residential - 0.325 (0.260-0.380)
- Freeways/transportation - 0.280 (0.250-0.450)
- Mixed - 0.290 (0.160-0.840)
- Open space - 0.190 (0.120-0.310)
- Conventional roof - 0.030 (0.010-0.200)
The default value in the Minimal Impact Design Standards Calculator is 0.35 mg/L.
The adjacent image shows TP removal for devices as a function of influent TP concentrations. TP removal decreases as influent concentration decreases below 0.1 mg/L. There is considerable scatter in the data and some indication that TP removal begins to diminish at influent concentrations below 0.2 mg/L.
Because of the low concentrations of DP, it is difficult to assess why TP performance decreases at influent concentrations less than 0.1 mg/L. The adjacent plot indicates TP removal decreases as TSS influent concentrations decrease below about 40 mg/L, with TP removal being about 60% across the devices when TSS influent is about 30 mg/L. We conducted an extensive literature review for TSS concentrations in stormwater runoff. Based on that review, the following event mean concentrations, in mg/L, are recommended. Ranges from the literature review are shown in parentheses.
- Commercial - 75 (42-164)
- Industrial - 93 (70-170)
- Residential - 73 (42-101)
- Freeways/transportation - 87 (50-90)
- Mixed - 76 (47-188)
- Open space - 21 (11-70)
- Conventional roof - <20
The default value in the Minimal Impact Design Standards Calculator is 54.5 mg/L.
The data suggest that for typical TP and TSS concentrations in Minnesota urban stormwater runoff, removal credits derived using data from the TAPE program are acceptable. For conditions where TP concentrations in runoff are less than 0.10 mg/L or TSS concentrations are less than 30 mg/L, the credits overpredict removal. Conversely, at TSS influent concentrations greater than 100 mg/L or TP influent concentrations greater than 0.4 mg/L, the credits may underpredict removal.
Rationale for and applicability of total phosphorus (TP) credits
This section provides a discussion of the rationale for deriving the Tier 1 and Tier 2 credits, and Tier 3 for the StormFilter using PhosphoSorb Media device. There is additional discussion on the recomend applicability of the credits, based primarily on likely runoff characteristics associated with different land use settings.
Rationale for Tier 1 TP credits
Tier 1 credits are based on the TAPE default value of 50% removal. The lower confidence limit of TP removal for all devices except the StormGarden Modular Stormwater Bio-filtration System and Up-Flo Filter w/Filter Ribbons devices were 50% or greater. For these two devices, rationale for giving a Tier 1 credit is based on the following.
- StormGarden Modular Stormwater Bio-filtration System: Most of the influent concentrations were below the TAPE criteria of 0.1 mg/L. In the TAPE-approval document, the reported LCL was 53.4% based on inclusion of data below 0.1 mg/L.
- Up-Flo Filter w/Filter Ribbons: The TAPE approval document noted the small median particle size (11 microns) in runoff to the device, citing multiple times when the device became clogged and required maintenance: "The system was subjected to atypical sediment loading and needed to be serviced after 4 months, or 12.7% of a water year. Monitoring personnel observed similar sediment loading and blinding issues with other systems evaluated at the Test Facility. The runoff from the Test Facility is not expected to be characteristic of other urban runoff applications". Laboratory testing for both the TAPE and NJCAT programs indicated removal rates exceeding 50%.
Public domain practices in this manual receive the following credits for TP.
- Biofiltration: 44% TP removal
- Permeable pavement: 41% TP removal
- Constructed stormwater pond: 46% TP removal (Design level 2)
- Constructed stormwater wetland: 38% TP removal
- Sand filter: 50% TP removal
- Iron enhanced sand filter: 74% (Design level 2)
These removal percentages are based on the assumption that particulate phosphorus accounts for 55% of TP. If PP accounted for 75% of TP, the removal values would be as follows.
- Biofiltration: 60% TP removal
- Permeable pavement: 56% TP removal
- Constructed stormwater pond: 63% TP removal (Design level 2)
- Constructed stormwater wetland: 52% TP removal
- Sand filter: 64% TP removal
The Tier 1 value of 50% is therefore likely to underpredict removal in some land use settings and overpredict in others. See the discussion in the following section.
Rationale for Tier 2 TP credits

Phosphorus removal by a filtration or sedimentation practice varies with TP concentration in runoff, the fraction of phosphorus in particulate form, and preferential retention of particles.
- TP concentration in runoff. As discussed above, removal efficiency of devices generally appears to decrease below TP concentrations of 0.1 mg/L. The event mean concentration of TP varies with several factors, including land use, first flush effects, season, interval between runoff events, connectedness of permeable pavement, characteristics of permeable pavement, application of deicers, and occurrence of specific sources such as industries that handle animal waste. In Minnesota, TP concentrations are typically greater than 0.2 mg/L for most urban settings. For more detailed discussion of factors affecting phosphorus concentrations in runoff, link here.
- Fraction of phosphorus in dissolved vs particulate form. Unless specifically designed to remove dissolved phosphorus, filtration and sedimentation devices do not effectively retain DP. If the practice contains media with organic matter, phosphorus may leach from the media. Thus, the removal efficiency of these devices (and all filtration and sedimentation practices) decreases as the fraction of DP increases. The adjacent figure illustrates predicted TP removal, using [Eq 1], as a function of the PP fraction and the TSS removal of the stormwater control practice. For example, a practice that removes 80% of influent TSS for runoff comprised of 75% PP, the predicted TP removal is 60%. For the same device but a PP fraction of 0.55, predicted TP removal is 44%. There is limited data on the distribution of PP and DP in stormwater runoff. Although the default value in the MIDS Calculator is 0.55 for PP and 0.45 for DP, monitoring data suggests more representative values may be 0.75 for PP and 0.25 for DP. For more discussion, link here.
- Preferential retention of particles. As discussed above, the mtds with adequate data for analysis preferentially retained particles larger than silt. This is common for filtration and sedimentation practices and the mtds do not appear to preferentially retain coarser sediment to a greater or lesser extent compared to other stormwater practices. The literature is unclear about whether phosphorus preferentially absorbs to smaller particles. Morquecho (2005) found smaller particles have somewhat elevated concentrations (due to large surface areas per mass with pollutant sorption onto surfaces) in residential and commercial area samples, while Cai (2015) observed no effect of particle size. River and Richardson (2017) provide a discussion of phosphorus sorption-desorption dynamics and indicate that particle surface area is a good predictor of phosphorus sorption, but also that phosphorus can be readily sorbed and desorbed in runoff. They note "Particle size distributions skewed towards larger particles will therefore remove PP at a faster rate than distributions skewed towards smaller particles, even if both distributions have the same mass (TSS)." Smaller particles, however, have greater sorbing capacity due to their larger surface area. Vaze and Chiew (2004) observed most of the TP in the stormwater samples attached to sediments between 11 and 150 microns for runoff in Melbourne, Australia. Analysis of data for mtds with sufficient particle size data showed a moderate preference for retaining phosphorus in smaller particles (silt size or smaller)(see discussion above).
Because of the limited data collected for TAPE certification, low concentrations of DP in runoff for the tested mtds, likely low fractions of DP in stormwater runoff, and differences in hydrology compared to Minnesota, we chose a conservative approach and assigned Tier 2 credits based on the lower of the following:
- the 95% LCL for samples with influent concentrations between 0.1 and 0.5 mg/L, calculated using Washington TAPE’s Bootstrap Calculator, or
- the 95% LCL for samples with influent concentrations between the 5th percentile TP concentration, as defined below, and 0.5 mg/L, calculated using Washington TAPE’s Bootstrap Calculator, or
- TP removal calculated using the equation TPR=(PPF∗TSSR) = (0.75∗TSSR) where PPF is the fraction of TP in particulate form, assumed to be 0.75 (75 percent) and TSSR is the 95% LCL for TSS.
Applicability of Tier 2 TP credits
We recommend that Tier 2 credits should not be applied when dissolved phosphorus (DP) accounts for more than 25 percent of total phosphorus. This is based on Equation 1, which indicates TP removal of 60% for a device that removes 80% TSS, assuming phosphorus is evenly distributed among different particle sizes. In cases where the DP fraction exceeds 25%, we recommend calculating the TP removal using Equation 1 and the appropriate TSS removal value. For example, if the DP fraction is 0.35 and TSS removal is 80%, TP removal is ((1-0.35)*80) = 52%.
Monitoring to determine distribution of phosphorus will likely not be conducted at installed practices, so guidance is needed for applying Tier 2 credits. There is insufficient information in the literature to provide specific recommended values for DP as a fraction of TP across a range of land uses and site conditions. Appropriate monitoring would be required to establish specific values. However, the following recommendations may be useful when considering whether the DP fraction is likely to exceed 0.25 (link here for more in depth discussion).
- DP ratios may exceed 0.25 under the following conditions
- Irrigated residential areas where irrigation water contains orthophosphate. This is common in areas where treated water is used for lawn irrigation. In Minnesota, nearly 400 communities add orthophosphate to drinking water, with concentrations ranging from about 1 to 5 mg/L and a median concentration of 1.85 mg/L. This will be an issue only during the irrigation season ([1], [2], [3]).
- Areas where inputs from animal waste are potentially important (e.g. areas with high wildlife densities)
- Areas or periods of time when winter runoff is important. For example, snowmelt data from Capital Region Watershed District shows a median DP fraction of 0.37 across nine sites.
- Areas with phosphorus fertilizer application. There is a ban on use of lawn fertilizers containing phosphorus in Minnesota, but phosphorus fertilizers are allowed when a soil test or plant tissue test shows a need for phosphorus, a new lawn is being established by seeding or laying sod, phosphorus fertilizer is being applied on a golf course by trained staff, or phosphorus fertilizer is being applied on farms growing sod for sale ([4]).
- Consider lower DP ratios under the following conditions
- Areas with low inputs from vegetative sources (e.g. ultra-urban settings, commercial and industrial land use settings)
- Areas with active construction and exposed soils
- Modeling or calculating loads for runoff associated with or dominated by first flush
Several studies show that organic material such as leaves is an important source of DP. Studies do not specifically indicate higher DP fractions in areas with higher leaf canopy, but this is likely due to the nature of these studies, which focus on material collected from impermeable surfaces. Organic debris captured by pretreatment practices upstream of or within an mtd are potential sources of DP. In areas with high inputs of organic material, mtd performance can be enhanced by greater maintenance frequency of pretreatment devices during times of high organic inputs, or source control practices designed to remove organic material, such as street sweeping during leaf drop and enhanced residential yard waste management.
Protocol for monitoring
As indicated for Tier 2 and Tier 3 credits, monitoring data may be used to verify mtd performance or to characterize stormwater runoff (e.g. to determine DP:TP ratios or particle size distribution). Protocol for monitoring is described in the following document: File:Monitoring protocol Version 1.docx
Technical team (Acknowledgements)
- Seth Brown, PhD, PE, Storm and Stream Solutions, LLC
- David Fairbairn, PhD, Water Quality Analyst, Natural Resource Specialist, Oregon Dept. of Environmental Quality
- Craig Fairbaugh, Regional Regulatory Manager, Contech Engineered Solutions LLC
- Chris French, National Regulatory Manager, Hydro International
- Jim Herbert, PE, Vice President, Senior Civil Engineer, Barr Engineering
- Matt Hernick, PE, Associate Engineer, St. Anthony Falls Laboratory, University of Minnesota
- Luke Martinkosky, BMP Inspector, Capitol Region Watershed District
- Jay Michels, CPESC, NGICP/IGICP, Emmons and Olivier Resources
- Randy Neprash, PE, Minnesota Cities Stormwater Coalition
- Josh Phillips, PE, Civil Engineer, Barr Engineering
- Todd Shoemaker, PE, CFM, Senior Associate, Senior Water Resources Engineer
- Udai Singh, PhD, PE, Water Resources Director, Mississippi Watershed Management Organization
- Todd Smith, PE, Minnesota Pollution Control Agency
- Scott Sobiech, CFM, PE, Vice President, Senior Water Resources Engineer, Barr Engineering
- Phillip Taylor, Technical Product Manager, Hydro International
- Mike Trojan, PhD, Hydrologist, Minnesota Pollution Control Agency (Team lead)
During development of this guidance, we consulted with and received input from numerous folks, including staff from the Washington State Technology Assessment Protocol - Ecology (TAPE) Program.
References
- Anta, J., E. Peña, J. Suárez and J. Cagiao. 2006. A BMP selection process based on the granulometry of runoff solids in a separate urban catchment. Water SA. Vol.32 (3): pp.419-428.
- Cai, Y. 2015. Full-Scale Up-Flo Stormwater Filter Field Performance Verification Tests. Tuscaloosa, AL: The University of Alabama. MSCE Thesis, Department of Civil, Construction, and Environmental Engineering.
- Charters, F.J., T. A. Cochrane, and A.D. O’Sullivan. 2015. Particle size distribution variance in untreated urban runoff and its implication on treatment selection. Water Research. 85:337-345. https://doi.org/10.1016/j.watres.2015.08.029.
- DeGroot, G., and P. Weiss. 2008. Stormwater particles Sampling – Literature Review. St. Anthony Falls Laboratory.
- Furumai, H., H. Balmer, and M. Boller. 2002. Dynamic behavior of suspended pollutants and particle size distribution in highway runoff. Water Sci. Tech. 46(11-12) 412-418.
- German, J., and Svensson, G. 2002. Metal content and particle size distribution of street sediments and street sweeping waste. Water Sci. Technol., 46: 6-7, 191-198.
- Gonclaves, C., and T.V. Seters. 2012. Characterization of Particle Size Distributions of Runoff from High Impervious Urban Catchments in the Greater Toronto Area. Totonto and Region Conservation. Ontario Ministry of the Environment.
- Kellner, E., J.A. Hubbart, and T. Smith. 2014. Quantifying Urban Land-use Impacts on Suspended Sediment Particle Size Class Distribution. Stormwater.
- Li, Y., M. Kayhanian, and M.K. Stenstrom. 2005. Particle Size Distribution in Highway Runoff. J. Environ Eng. 131:9:1267. DOI:10.1061/(ASCE)0733-9372.
- Morquecho, R. E. 2005. Pollutant Associations with Particulates in Stormwater. Tuscaloosa, AL: University of Alabama. Ph.D. dissertation, Department of Civil, Construction, and Environmental Engineering.
- Municipal Research & Services Center. 1999. Protocol for the Acceptance of Unapproved Stormwater Treatment Technologies for use in the Puget Sound Watershed. American Public Works Association, Washington Chapter – Stormwater, Managers Committee.
- Penn State Harrisburg. 2008. The Terre Hill Concrete Products Terre LeenTM 09 Treatment Device. EPA/600/R-06/136.
- Rinker Materials. 2004.Particle size distribution (psd) in stormwater runoff. Accessed November 8, 2021.
- River, M. and C.J. Richardson. 2017. [file:///C:/Users/franc/Downloads/Particle_size_distribution_predicts_particulate_ph.pdf Particle size distribution predicts particulate phosphorus removal]. Ambio 2018, 47(Suppl. 1):S124–S133. DOI 10.1007/s13280-017-0981-z.
- Selbig, W.R., M. N. Fienen, J. A. Horwatich, and R. T. Bannerman. 2016. The Effect of Particle Size Distribution on the Design of Urban Stormwater Control Measures. Water 2016, 8(1), 17; https://doi.org/10.3390/w8010017.
- Selbig, W.R., and R. T. Bannerman. 2011. Characterizing the Size Distribution of Particles in Urban Stormwater by Use of Fixed-Point Sample-Collection Methods. Open0File Report 2011-1052.
- U.S. Environmental Protection Agency. 1986. Methodology for Analysis of Detention Basins for Control of Urban Runoff Quality. Nonpoint Source Branch, Washington, DC.
- Vaze, J., and F. H. S. Chiew. 2004. Nutrient Loads Associated with Different Sediment Sizes in Urban Stormwater and Surface Pollutants. Journal of Environmental Engineering Vol. 130, Issue 4. https://doi.org/10.1061/(ASCE)0733-9372(2004)130:4(391).
- Zhao, H., X. Li, X. Wang, and D. Tian. 2010. Grain size distribution of road-deposited sediment and its contribution to heavy metal pollution in urban runoff in Beijing, China. Journal of Hazardous Materials Volume 183:1-3:203-210
This page was last edited on 1 January 2024, at 14:42.