![]()
Turf
This page includes discussion of volume and associated phosphorus and total suspended sediment reduction credits for disconnection of existing impervious surfaces and for soil improvements to enhance infiltration.
Contents
- 1 Recommended credits for impervious surface disconnection
- 2 Recommended credits for soil improvement
- 3 Spreadsheet for calculating disconnection credit
- 4 Compost
- 4.1 Benefits of compost
- 4.2 Class I compost
- 4.3 Understanding the characteristics of compost
- 4.4 Uses of compost
- 4.5 Additional information
- 4.6 References
- 4.7 Links and related sites
- 4.8 Literature review
Recommended credits for impervious surface disconnection
Impervious surface disconnection is the redirection of stormwater runoff from impervious surfaces (e.g., sidewalks, parking lots, rooftops, etc.) to vegetated areas instead of the runoff being discharged offsite via a storm sewer system or other conveyance methods. Redirection of impervious surface runoff to properly maintained vegetated areas promotes increased infiltration and reduces overall site runoff. The reduction in site runoff from impervious surface disconnection can vary considerably, depending on many factors, including the size of the contributing drainage area, size and infiltration capacity of the vegetated area receiving the additional stormwater, and numerous other site conditions such as slope and site grading.
Modeling analysis and results


To estimate the runoff reduction from impervious surface disconnection, two variables were examined:
- ratio of impervious area to pervious area (I/P Ratio); and
- infiltration capacity of the vegetated area.
A modeling analysis was performed to quantify the runoff reduction achieved from redirecting runoff from impervious areas to pervious areas of varying size and soil type. The long-term, 35-year continuous simulation XP-SWMM model developed in support of the MIDS performance goal development (Barr, 2011) was modified to represent watersheds with I/P ratios ranging from 0.2:1 to 50:1 and hydrologic soil types of A, B, C, and D. See the Assessment of MIDS Performance Goal Alternatives: Runoff Volumes, Runoff Rates, and Pollutant Removal Efficiencies report for additional information on the hydrologic model input parameters utilized for this model. As described in the report, all soil types were assumed to be frozen and impervious to infiltration each year from December 6 to April 7. Hydrologic soil type and I/P ratio are therefore assumed to have no effect on runoff volume during the frozen ground period.
The figures to the right show the average annual runoff depths for all modeled I/P ratios and soil types and the average annual runoff reductions for all modeled I/P ratios and soil types. Note that the annual runoff depths are based on the assumption that runoff from the frozen ground period is 4.0 inches for all I/P ratios and soil types. The runoff reduction is greatest from the sites with the smallest I/P ratio of 0.2:1 (for example, 100 square feet of impervious surface redirected to 500 square feet of pervious area) and decreases as the I/P ratio increases. For a given I/P ratio, the runoff reduction is greatest for A soils and least for D soils, as would be expected.
Suggested credit calculations
Impervious surface disconnection spreads runoff generated from parking lots, driveways, rooftops, sidewalks and other impervious surfaces onto adjacent pervious areas where it can be infiltrated. The larger the pervious area is in comparison to the redirected impervious area, the greater the runoff reduction achieved. However, when applying the modeling results it is important to recognize that the “effective” pervious area on a site may be less than the available pervious area, as redirected flows will tend to channelize at flow lengths greater than 100 feet (WinTR-55, 2009) and prevent runoff from being distributed over the entire available area. To prevent overestimating the effectiveness of impervious surface disconnection, we suggest that the “effective” pervious area be limited to a flow length of 100 feet beyond the impervious surface runoff discharge point and have less than a 5 percent slope.
Conformance with the MIDS performance goal
For new developments that create more than one acre of new impervious surface on sites without restrictions, the MIDS performance goal is that stormwater runoff volumes will be controlled and the post-construction runoff volume shall be retained on site for 1.1 inches of runoff from impervious surfaces statewide. Our suggested approach for quantifying the volume reduction benefit achieved from impervious surface disconnection in terms of the MIDS performance goal is summarized below. An example calculation is included below.
Step 1
Pre−disconnectionRO=(Areap)(RDp)+(Areai)(RDi)
where:
- Pre-disconnection RO = runoff volume (cubic feet) from site if impervious surface is not redirected to pervious area;
- Areap = total pervious area (square feet);
- RDp = runoff depth (feet) from pervious area (4.4 inches for A soil, 5.7 inches for B soil, 6.1 inches for C soil, 7.2 inches for D soil);
- Areai = impervious area (square feet); and
- RDi = runoff depth (feet) from impervious area (22.5 inches).
Step 2
I/PRatio=(Areairedirect)/(Areapeff)
where:
- I/P Ratio = ratio of redirected impervious area to "effective" pervious area;
- Areai redirect = impervious area (square feet) redirected to pervious area; and
- Areap eff = “effective” pervious area (square feet) receiving redirected impervious runoff.
The "effective" pervious area is the area over which infiltration of redirected water occurs. In calculating the effective pervious area, the maximum width should be 100 feet. See the discussion of effective pervious and the schematic to the right.
Step 3
Post−disconnectionRO=(Areairedirect+Areapeff)(RDredirect)+(Areapnoneff)(RDp)+(Areainonredirect)(RDi)
where:
- Post-disconnection RO = post-disconnection runoff volume (cubic feet) from entire site;
- RDredirect = runoff depth (feet) from redirected impervious area and effective pervious area (determined from modeling results based on soil type and I/P ratio);
- Areap noneff = pervious area (square feet) not considered “effective” for receiving redirected impervious runoff;
- RDp = runoff depth (feet) from pervious area (4.4 inches for A soil, 5.7 inches for B soil, 6.1 inches for C soil, 7.2 inches for D soil);
- Areai nonredirect = impervious area (square feet) not redirected to pervious area; and
- RDi = runoff depth (feet) from non-redirected impervious area (22.5 inches).
To calculate RDredirect, use the figure on the right. For example, a B soil with an I/P ratio of 2:1 has an RDSubscript text of 10.1 inches.
Step 4
AdjustedimperviousRO=(Post−disconnectionRO)−(Areap)(RDp)
where:
- Adjusted impervious RO = adjusted runoff volume (cubic feet) from impervious area as a result of redirection to pervious area;
- Post-disconnection RO = post-disconnection runoff volume (cubic feet) from entire site;
- Areap = total pervious area (square feet); and
- RDp = runoff depth (feet) from pervious area (determined from model results based on soil type).
Step 5
Areai,adj=(AdjustedimperviousRO)/(RDi)
where:
- Areai,adj = adjusted impervious area (square feet) for calculation of performance goal conformance;
- Adjusted impervious RO = adjusted runoff volume (cubic feet) from impervious area as a result of redirection to pervious area; and
- RDi = runoff depth (feet) from impervious area (determined from model results).
Step 6
BMPvolumecredit=0.092(Areai−Areai,adj)
where:
- Areai = impervious area (square feet);
- Areai, adj = adjusted impervious area (square feet) for calculation of performance goal conformance; and
- 0.092 is a conversion factor. Note this conversion factor is for the 1.1 inch performance goal.
Annual volume reduction

The approach described in the steps above results in an equivalent BMP volume credit that can be used to evaluate conformance with the MIDS performance goal. To estimate the annual runoff volume reduction that is achieved by implementation of impervious surface disconnection, we recommend applying the performance curves developed for assessing annual performance of bioretention basins. These performance curves, which were developed for sites ranging from 10 to 90 percent imperviousness and hydrologic soils groups A, B, and C, allow for estimation of the average annual runoff volume reduction based on an equivalent BMP volume per tributary drainage area.
Annual pollutant removal
The MIDS calculator estimates the average annual removal of total phosphorus (TP), dissolved phosphorus (DP), and total suspended solids (TSS) from stormwater runoff as a result of BMP implementation. For runoff that is infiltrated as a result of the impervious surface disconnection, 100 percent pollutant removal is suggested. For runoff that is not infiltrated, but conveyed across the effective pervious area, pollutant removal consistent with that of a filter strip is suggested (current draft of MIDS calculator uses 68 percent annual TSS removal and 0 percent TP and DP removal). If pollutant removal credit is included in the calculator for runoff conveyed over the effective pervious area, additional definition of effective pervious area may be warranted to ensure that the pervious flow length is sufficient to achieve the sedimentation expected to occur during flow through a filter strip. For pervious areas that extend beyond the effective pervious area, a treatment train approach could be used in the MIDS calculator by treating the additional pervious area as a filter strip.
Recommended credits for soil improvement
The amount of runoff from pervious surfaces is dependent on many characteristics, with a primary factor being the infiltration capacity of the soil. While the infiltration capacity and runoff potential vary among soil types, other factors such as compaction or soil loosening can result in more or less runoff for a given soil type or texture. Maintaining and/or amending soils in vegetated areas to increase infiltration, termed “Soil Improvements” in this memorandum, is a method of reducing runoff from pervious areas. Soil maintenance and amendment includes loosening or ripping of existing soils to decrease the soil density or modifying or replacing existing soil to achieve increased infiltration.
Modeling analysis and results

Barr conducted a modeling analysis to estimate the runoff reduction from maintaining and/or amending soils in vegetated areas using the long-term, 35-year continuous simulation XP-SWMM model developed in support of the MIDS performance goal development (Barr, 2011). To assess the difference in average annual runoff depths under compacted, average, and loosened soil conditions, the saturated hydraulic conductivity (Ksat) values in the XP-SWMM model were adjusted. “Average” values represent the mean Ksat values for each soil texture based on a national database of over 1,000 observed saturated hydraulic conductivities (Rawls, 1998). “Compacted” and “loosened” values represent the geometric mean Ksat values for soils within the national database developed by Rawls that have bulk densities higher and lower than the NRCS recommended value for the soil texture class, respectively (Rawls, 1998). The figure to the right shows the average annual runoff depths under compacted, average, and loosened soil conditions for A, B, and C hydrologic soil groups, as well as average conditions for D soils.
Saturated hydraulic conductivity values used in long-term continuous simulation modeling analysis
Link to this table.
| Hydrologic soil group | Representative soil texture | Saturated hydraulic conductivity (in/hr) | ||
|---|---|---|---|---|
| Compacted | Average1 | Loosened2 | ||
| A | sandy loam | 0.50 | 0.90 | 2.20 |
| B | loam | 0.15 | 0.205 | 0.24 |
| C | sandy clay loam | 0.11 | 0.14 | 0.30 |
| D | silty clay | N/A | 0.06 | N/A |
1
The Ksat values termed “average” for the modeling analysis represent the mean Ksat values for each soil texture based on a national database of over 1,000 observed saturated hydraulic conductivities (Rawls, 1998).
2The Ksat values termed “compacted” and “loosened” for the modeling analysis represent the geometric mean Ksat values for soils within the national database developed by Rawls that have bulk densities higher and lower than the NRCS recommended value for the given soil texture class, respectively (Rawls, 1998).
Suggested credit calculations
For new developments that create more than one acre of new impervious surface on sites without restrictions, the MIDS performance goal is that stormwater runoff volumes will be controlled and the post-construction runoff volume shall be retained on site for 1.1 inches of runoff from impervious surfaces statewide. Our suggested approach to quantifying the volume reduction benefit achieved from maintaining and/or amending soils in vegetated areas in terms of the MIDS performance goal is summarized below. Note that the determination of appropriate soil conditions prior to and following soil improvements will be site dependent.
Step 1
Pre−soilimprovementRO=(Areap)(RDpo)+(Areai)(RDi)
where:
- Pre-Soil Improvement RO = runoff volume (cubic feet) from site if soils not improved;
- Areap = total pervious area (square feet);
- RDpo = runoff depth (feet) from pervious area reflecting pre-project soil conditions, typically compacted or average (determined from model results);
- Area i = impervious area (square feet); and
- RDi = runoff depth from impervious area (1.875 feet (22.5 inches)).
Step 2
Post−soilimprovementRO=(Areapimp)(RDpimp)+(Areapunimp)(RDpo)+(Areai))(RDi)
where:
- Post-Soil Improvement RO = runoff volume (cubic feet) from site following soil improvements;
- Areap imp = pervious area (square feet) with improved soils;
- RDP imp = runoff depth (feet) from pervious area reflecting improved soil conditions, typically average or loosened (determined from model results);
- Areap unimp = pervious area (square feet) without improved soils;
- RDpo = runoff depth (feet) from pervious areas with unimproved soil conditions, typically compacted or average (determined from model results);
- Areai = impervious area (square feet); and
- RDi = runoff depth from impervious area (1.875 feet (22.5 inches), based on impervious surface disconnection modeling).
Step 3
AdjustedimperviousRO=post−soilimprovementRO−(Areap)(RDpo)
where:
- Adjusted impervious RO = adjusted impervious runoff volume (cubic feet) to represent equivalent runoff reduction from pervious soil improvements;
- Post-soil improvement RO = runoff volume (cubic feet) from site following soil improvements;
- Areap = total pervious area (square feet); and
- RDpo = runoff depth (feet) from pervious areas with unimproved soil conditions, typically compacted or average (determined from model results).
Step 4
Areaiadj=(AdjustedimperviousRO)/RDi
where:
- Areai adj = adjusted impervious area (square feet) for calculation of performance goal conformance;
- Adjusted impervious RO = adjusted impervious runoff volume to represent equivalent runoff reduction from pervious soil improvements; and
- RDi = runoff depth from impervious area (1.875 feet (22.5 inches)).
Step 5
BMPvolumecredit=0.092(Areai−Areaiadj)
where:
- Areai = impervious area (square feet); and
Areai adj = adjusted impervious area (square feet) for calculation of of performance goal conformance.
Annual volume reduction
The approach described in the steps above results in an equivalent BMP volume credit that can be used to evaluate conformance with the MIDS performance goal. To estimate the annual runoff volume reduction that is achieved by implementation of soil improvements, we recommend applying the performance curves developed for assessing the annual performance of bioretention basins. These performance curves, which were developed for sites ranging from 10 to 90 percent imperviousness and hydrologic soils groups A, B, and C, allow for estimation of the average annual runoff volume reduction based on an equivalent BMP volume per tributary drainage area.
Annual pollutant removal
The MIDS calculator estimates the average annual removal of total phosphorus, dissolved phosphorus, and total suspended solids from stormwater runoff as a result of BMP implementation. For runoff that is infiltrated as a result of soil improvements in the vegetated pervious areas, 100 percent pollutant removal is suggested. For runoff that is not infiltrated, 0 percent pollutant removal is suggested. For example, if a 5 percent annual runoff volume reduction is estimated as a result of soil improvements, the average annual total phosphorus, dissolved phosphorus, and total suspended sediment reductions will be 5 percent. For the 95 percent of annual runoff discharged from a site, no additional pollutant removal will be credited.
Example calculations

Three example calculations are presented below. The 1st two examples are for disconnected impervious surfaces (A and B soils, respectively) and the 3rd is for improved soil.
Scenario 1
- 3 acres consisting of 1.5 acres of impervious parking lot and 1.5 acres of pervious turf
- 50 percent impervious
- A soils, with all of the impervious area draining to the pervious area next to a parking lot. The length of the impervious area is 350 feet.
- Calculate conformance with the performance goal (1.1 inches)
- Calculate the effective pervious area: Effective pervious area = (100 feet)(350 feet) = 35,000 square feet or 0.8 acres
- The runoff depth from impervious area (RDi = 22.5 inches (from model results))
- Step 1: Pre-disconnection site runoff = ((1.5 acres)(4.4 inches) + (1.5 acres)(22.5 inches))(43560 square feet per acre)(1 foot/12 inches) = 146471 cubic feet
- Step 2: I/Peff ratio = (1.5 acres)/(0.8 acres) = 1.9
- Step 3: Post-disconnection site runoff volume = ((1.5 acre + 0.8 acre)(6.55 inches)+(1.5 acre – 0.8 acre)(4.4 inches))(43560 square feet/acre)(1 foot/12 inches) = 65866 cubic feet
- Step 4: Adjusted impervious runoff = (65866 cubic feet)-(1.5 acre)(4.4 inches)(43560 square feet/acre)(1 foot/12inches) = 41908 cubic feet
- Step 5: Adjusted impervious area = (41908 cubic feet)/((22.5 inches)(1 foot/12 inches)) = 22351 square feet
- Step 6: BMP volume credit = (1.5 acre - 0.51 acre)(1.1 inches)(43560 square feet/acre)(1 foot/12 inches)) = 3941 cubic feet
- Calculate annual volume reduction using performance curve for 50 percent impervious site.
- BMP Volume /Drainage Area = (3941 cubic feet)/(43560 aquare feet/acre)/(3 acres) = 0.03
- Corresponding annual volume removal (from performance curve, for A soils, 50% impervious site) = 91 percent
- Annual TP removal = annual volume removal = 91 percent
- Annual TSS removal = (91 percent)(100 percent) + (9 percent)(68 percent) = 97 percent
Scenario 2
- 3 acres consisting of 1.5 acres of impervious parking lot and 1.5 acres of pervious turf
- 50 percent impervious
- B soils, with all of the impervious area draining to the pervious area next to a parking lot. The length of the impervious area is 350 feet.
- Calculate conformance with the performance goal (1.1 inches)
- Calculate the effective pervious area: Effective pervious area = (100 feet)(350 feet) = 35,000 square feet or 0.8 acres
- The runoff depth from impervious area (RDi = 22.5 inches (from model results)
- Step 1: Pre-disconnection site runoff = ((1.5 acres)(5.7 inches) + (1.5 acres)(22.5 inches))(43560 square feet per acre)(1 foot/12 inches) = 153549 cubic feet
- Step 2: I/Peff ratio = (1.5 acres)/(0.8 acres) = 1.9
- Step 3: Post-disconnection site runoff volume = ((1.5 acre + 0.8 acre)(9.84 inches)+(1.5 acre – 0.8 acre)(5.7 inches))(43560 square feet/acre)(1 foot/12 inches) = 65601 cubic feet
- Step 4: Adjusted impervious runoff = (96638 cubic feet)-(1.5 acre)(5.7 inches)(43560 square feet/acre)(1 foot/12inches) = 65601 cubic feet
- Step 5: Adjusted impervious area = (65601 cubic feet)/((22.5 inches)(1 foot/12 inches) = 34987 square feet
- Step 6: BMP volume credit = (1.5 acre - 0.8 acre)(1.1 inches)(43560 square feet/acre)(1 foot/12 inches)) = 2795 cubic feet
- Calculate annual volume reduction using performance curve for 50 percent impervious site.
- BMP Volume /Drainage Area = (2795 cubic feet)/(43560 aquare feet/acre)/(3 acres) = 0.02
- Corresponding annual volume removal (from performance curve, for B soils, 50% impervious site) = 68 percent
- Annual TP removal = annual volume removal = 68 percent
- Annual TSS removal = (68 percent)(100 percent) + (32 percent)(68 percent) = 90 percent
Scenario 3
- 10-acre, 50% impervious site
- B soils, with all of the impervious area being "improved" from "compacted" to "average".
To perform the calculations to determine volume credits for improved turf, runoff depth must be known for the three soil conditions (compacted, average, loosened) and the three soil types being considered (A, B, C. Note that D soils are not considered for this credit.). These values were determined from continuous simulation modeling using XP-SWMM and they are summarized below:
- A soil
- Compacted soil = 4.4 inches
- Average soil = 4.1 inches
- loosened soil = 4.0 inches
- B soil
- Compacted soil = 5.2 inches
- Average soil = 4.9 inches
- loosened soil = 4.7 inches
- C soil
- Compacted soil = 5.5 inches
- Average soil = 5.2 inches
- loosened soil = 4.9 inches

The runoff depth from impervious surfaces is 22.5 inches.
- Calculate conformance with performance goal
- Treatment volume required to meet 1.1-inch performance goal = (10 acres)(0.50)(43560 square feet/acre)(1.1 inches)(1 foot/12 inches) = 19965 cubic feet
- Step 1: Calculate site runoff prior to soil improvements = (Areap)(RDpo) + (Areai)(RDi) = (5 acres)(5.2 inches)(43560 square feet/acre)(1 foot/inch) = 502755 cubic feet
- Step 2: Calculate site runoff following improvements = (Areap imp)(RDp imp) + (Areap unimp)((RDpo) + (Areai)(RDi) = (5 acres)(43560 square feet/acre)(4.9 inches)(1 foot/inch) + (5 acres)(43560 square feet/acre)(22.5 inches)(1 foot/acre) = 497310 cubic feet
- Step 3: Calculate adjusted impervious runoff to determine credit = (Post-soil improvement runoff) - ((Areap)(RDpo)) = 497310 - (5 acres(43560 acres/square feet)(5.2 inches)(1 foot/12 inches) = 402930 square feet
- Step 4: Calculate ajusted impervious area = (Adjusted impervious runoff)/(RDi) = (402930)/((22.5inches)(1 foot/12 inches)) = 214896 square feet
- Step 5: Calculate performance goal credit = (217800 - 214896)(1.1 inches)(1 foot/12 inches) = 266.2 cubic feet
- BMP volume credit in inches off impervious surface = (performance goal credit)/(performance goal volume) = 266.2/19965 = 0.013 inches
The figure at the right summarizes BMP volume credits for a range of site conditions (20, 50, and 80% impervious) and soil types (A, B, and C soils).
Spreadsheet for calculating disconnection credit

A simple calculator allows you to calculate the credit for impervious surface disconnection (File:Disconnection credit calculator.xlsx). You will need the following information to use the calculator:
- soil type;
- area of non-redirected impervious surface (the impervious area that does not run off to the pervious area);
- area of redirected impervious surface (the impervious area that runs off to the pervious area);
- effective pervious area (the pervious area that receives runoff from the redirected impervious); and
- ineffective impervious area.
Another input in the spreadsheet, the I/P ratio, is the area of redirected impervious surface to effective pervious area. Using the I/P ratio for the appropriate soil in the figure to the right allows determination of the runoff depth, which is input into the spreadsheet.
Note that the spreadsheet generates a volume credit for disconnection. It does not calculate the percent credit toward the performance goal. The performance goal includes runoff from both the non-redirected and redirected impervious areas. Thus, the greater the percent of redirected impervious area relative to total impervious area at a site, the greater the volume credit as a percent of the performance goal.
Compost


Compost is the product resulting from the controlled biological decomposition of organic materials that have been sanitized (pathogens removed) through the generation of heat and stabilized to the point that it is beneficial to plant growth. It is an organic matter resource that can improve the chemical, physical, and biological characteristics of soil. It is derived from several sources, including composted yard waste, food waste, manure, leaves, grass clippings, straw, or biosolids. Media mixes specified in this manual call for leaf compost or MnDOT Grade 2 compost (See Specification 3890).
Undisturbed soils provide important stormwater management functions including efficient water infiltration and storage, adsorption of excess nutrients, filtration of sediments, biological decomposition of pollutants, and moderation of peak stream flows and temperatures. In addition, healthy soils support vigorous plant growth that intercepts rainfall, returning much of it to the sky through evaporation and transpiration. Common development practices include removal of topsoil during grading and clearing, compaction of remaining soil, and planting into unimproved soil or shallow depths of poor quality imported topsoil. These conditions typically produce unhealthy plants that require excessive water, fertilizers and pesticides, further contaminating runoff.
To maintain the natural soil qualities, impacts to undisturbed soils should be avoided and minimized during the construction process. When impacts are unavoidable and soils have been compacted or otherwise disturbed, compost can be used as an amendment to regain some of the characteristics of undisturbed soils.
Compaction of soils significantly affects infiltration of water into sandy and clay soils. When compacted, soil infiltration rates decrease by 90 percent or more. Compacted soils contribute a significantly greater volume of runoff to the storm water system. Compost can help to off-set the effect of compaction.
Establishing soil quality and depth regains greater stormwater function in the post development landscape, provides increased treatment of pollutants and sediments that result from development and habitation, and minimizes the need for some landscaping chemicals, thus reducing pollution through prevention. Establishing a minimum soil quality and depth is not the same as preservation of naturally occurring soil and vegetation. However, establishing a minimum soil quality and depth will provide improved onsite management of stormwater flow and water quality.
Benefits of compost
Compost can be used as a soil amendment to
- improve soil aggregation,
- increase soil infiltration rate,
- reduce runoff,
- improve porosity (f),
- increase soil moisture holding capacity (reduce water demand of lawns and landscaping),
- reduce erosion,
- absorb or aid in degradation of certain pollutants, including hydrocarbons, solvents and heavy metals (due to increased cation exchange capacity),
- reduce fertilizer needs by improving soil nutrient holding capacity,
- reduce pesticide and herbicide needs,
- lower cost,
- reduce maintenance needs, and
- alleviate compaction from construction activities (improved infiltration).
Class I compost
Minnesota has about 8 large-scale compost sites that actively accept food waste and are permitted. There are also several yard waste compost sites that have a permit by rule to compost yard-waste only. All of these permitted sites annually report to the MPCA. They are required to test their compost products for pathogens and for maturity to prove their compost meets “Class 1 “ standards as described by the compost rule.
If a site does not meet class 1 standards, they must seek commissioner approval from MPCA in order to distribute their material. Compost from permitted compost sites must meet the following criteria:
- Maturity Standards - Mature Compost must be tested for pH; moisture content; particle size; NPK ratio; soluble salt content
- Testing for exceedances of criteria for arsenic, cadmium, copper, lead, mercury,molybdenum, nickel, selenium, PCB, zinc
- Less than 3% inert material (most have 1% or less)
- More information can be found in the compost rule. Class I compost should not to be confused with Grade 2 compost for MnDOT which is compost derived from yard waste or food waste.
Understanding the characteristics of compost


When amending disturbed soils with compost, it is important to use a compost product that fits the specific situation. In Minnesota, compost is made from a variety of feed-stocks, including yard and leaf debris, residential or commercial food residuals, and animal manure. Each type of feedstock produces a slightly different compost. For example, a yard and leaf compost is lower in nutrients and the particle size is generally coarser than a manure compost, which has higher nutrient content and a finer, more uniform particle size. Thus, a yard-leaf compost may be more appropriate when applying compost to a project site close to a water source impaired for phosphorus. Because of the coarser texture, a yard-leaf compost is a better choice for a blanket, filter sock, or berm to control erosion. Both yard–leaf compost and the manure compost could be used for turf applications.
Compost maturity
Compost maturity is another important factor. Using compost that has been properly aged or "cured" as a post-construction soil amendment promotes healthy root and plant growth and will prevent damage to turf and plantings. When immature compost is applied to soils it continues to decompose and the process of decomposition robs nitrogen from the plants and stunts plant growth, possibly even killing the plant. To facilitate the creation of consistent compost products throughout the United States, the U.S. Composting Council (USCC) created the Seal of Testing Assurance Program (STA). This voluntary program requires participating compost facilities to perform a uniform set of tests on their compost products. Composters who are STA participants are required to furnish test information to compost buyers. This gives the purchaser of the compost the agronomic information needed (such as pH, particle size and test results from a number of other parameters) to successfully use the compost. If a compost site in Minnesota accepts food waste, they are also required to have a permit from the MPCA. This permit requires the compost site to comply with the compost rule thereby meeting the process to further reduce pathogens (PFRP) and for the compost to spend time “curing” until it reaches maturity which is documented by solvita testing. Compost operators are required to submit annual reports to the MPCA to ensure they are meeting these health and safety standards. For more information on compost maturity, link here.
Nutrient precaution
Leaching is the process of removing soluble constituents. In nature, leaching occurs as water passes through a material such as soil. Leached constituents may then be transported with water, where the constituents may enter surface water or groundwater. Leaching of nutrients, specifically phosphorus and nitrogen, may be harmful to a receiving water.
Most soil phosphorus exists in stable chemical compounds with only a small amount dissolved into the soil solution which makes itself available to plants. This dissolved phosphorus is also the phosphorus that can leach and cause environmental concerns. Phosphorus is provided through the weathering of phosphorus rich minerals naturally found in soil and also through the addition of chemical or inorganic forms of phosphorus fertilizer.
A number of factors can contribute to the potential for phosphorus leaching. These include:
- Soil organic matter. Mineralization of organic matter results in the slow release of phosphorus to the soil solution during the growing season, making it available for plant uptake.
- Soil pH levels: Phosphorus is most available to plants when the soil pH is between 6 and 7. At a lower pH, phosphorus is bound to iron and aluminum compounds in the soil and at a higher pH, is bound to calcium, both limiting the plant’s ability to absorb phosphorus.
- Soil texture: Phosphorus is readily bound in fine textured soils, making it difficult for plants to access. This often results in over application of phosphorus to try and get plants the required amount for optimal growth. When considering phosphorus movement, it is important to keep in mind that phosphorus is more susceptible to leaching in sandy soils, and more susceptible to run-off (through erosion) in clay/heavier soils (O’Connor, G., 2013).
Nutrients in compost are subject to leaching. The extent of leaching varies with the characteristics of the compost, such as the source and age of compost. Compared to composted tree and grass material, peat (Glader, 2013) and coir (Lucas, 2012) compost are lower in phosphorus and do not typically leach phosphorus.
The test methods used to determine the phosphorus content in chemical phosphorus (inorganic) fertilizers are not the most appropriate methods for determining the phosphorus content in carbon-based products (e.g., compost, biosolids, manure). The amount of WEP (Water extractable phosphorus) is a good predictor of runoff P loss from surface applied organic materials. The table below shows the WEP in various organic matter sources.
Water extractable phosphate in composts and land-applied organic materials
Link to this table.
| Feedstock | Biosolids treatment | Total solids(%) | pH | P2O5 (% dry wt) | P (% dry wt) | WEPa(% of Total P) |
|---|---|---|---|---|---|---|
| Leaf / yard wastes | NA | 39.4 | 7.7 | 0.34 | 0.15 | 8.4 |
| Leaf / yard wastes / food | NA | 47.5 | 7.4 | 0.42 | 0.18 | 7.4 |
| NA | 53.9 | 7.4 | 0.43 | 0.19 | 6.8 | |
| Biosolids / wood chips2 | No P removal | 39.8 | 7.2 | 0.78 | 0.34 | 20.5 |
| An. digest /No P removal | 59.2 | 7.2 | 1.87 | 0.82 | 7.7 | |
| No P removal | 48.1 | 6.7 | 1.6 | 0.7 | 22.3 | |
| Chemical P removal | 38.8 | 5.5 | 3.65 | 1.59 | 1.8 | |
| Biosolids / wood chips / yard wastes2 | No P removal | 72.1 | 6.6 | 0.81 | 0.35 | 12.2 |
| Biosolids / yard wastes / WTRb2 | No P removal | 53.5 | 8.3 | 1.67 | 0.73 | 4.6 |
| No P removal | 47.8 | 7.9 | 1.68 | 0.73 | 4.1 | |
| Leaf / yard wastes / gelatin residuals | NA | 51.1 | 8.3 | 2.19 | 0.96 | 2.0 |
| Biosolids / wood shavings2 | Biological P removal | 42.8 | 5.7 | 2.41 | 1.05 | 13.3 |
aWEP = Water extractable phosphorus, bWTR = water treatment residuals (Source: Phosphorus and Compost Use Dynamics, Alexander, 2016)
2Minnesota does not compost biosolids per rule. Only source separated organic matter and yard waste are allowed in compost.
Data generated through product testing by Agresource, Inc. (Rowley, MA), and distilled by Dr. John Spargo at Penn State University, illustrates the following (Alexander, 2016).
- The amount of phosphorus, whether P2O5 or WEP, in the compost varies.
- The amount of phosphorus that is WEP ranges from about 2% to 22% of the total P.
- The amount of WEP is only loosely correlated with total P. As expected, the leaf and yard waste composts have lower total P and generally lower WEP than the biosolids composts. However, among the various biosolids composts there is a wide range of both total P and WEP, and some of the biosolids composts with the highest levels of total P have among the lowest levels of WEP.
- The percentage of P that is WEP is very closely correlated with the amount of iron (Fe) and aluminum (Al) in the compost. Further, the data set supports other studies that indicate that for biosolids products, WEP is dependent upon how the biosolids are treated at the wastewater treatment plant.
- If we assume that WEP is a predictor of P losses, the data indicates that some biosolids composts, despite the relatively high total P, could be used to build soil organic matter levels with no more risk of phosphorus leaching than leaf composts that have lower total P.
At active construction sites, practices such as compost socks or filter bags may leach phosphorus but retain sediment. Consequently, these practices may lead to elevated phosphorus concentrations in runoff but reduced total phosphorus export from the site due to sediment retention. Exercise the following cautions when considering compost near receiving waters where nutrients are a concern.
- Compost as a filter material in such things as compost socks or filter bags should be avoided whenever excess nutrient (see material specifications) content of water flowing through the filter and into a receiving water would cause a problem. *Specification of compost without extractable phosphorus is recommended in cases when nutrients are a receiving water concern.
- Avoid compost high in leachable phosphorus in permanent stormwater practices having an underdrain.
General Best Management Practices to reduce phosphorus migration in compost surface applications
- Consider the use of compost that contains a lower volume of water extractable phosphorus and total phosphorus.
- Use erosion and sediment control devices to avoid compost eroding to surface waters.
- Consider whether the application of inorganic P fertilizers can be avoided.
Uses of compost
Compost has several beneficial uses, including improving the stormwater management functions of compacted soils. Many of the uses of compost overlap and can serve both construction and post-construction purposes.
Soil amendment and turf establishment
A. Description: Compost is a popular soil amendment used to improve the physical, chemical and biological properties of soil. It is primarily used as a means to improve soil structure, especially in areas where soil compaction is a common concern due to construction practices or land usage patterns (e.g., athletic fields), but also contains plant required nutrients such phosphorus, nitrogen, and potassium.
B. Materials: When purchasing compost to be used for turf establishment or incorporation into soil as a post-construction soil amendment, look for a Class 1 compost with the specifications listed in the table below.
Product parameters for compost used for soil amendment and turf establishment
Link to this table.
| Parameter | Parameter definition | Range (Provided by G. Black, MPCA, 2007) |
|---|---|---|
| Source mater/nutrient content | Compost typically comes from biosolids/animal manure or yard wastes. Compost made from biosolids and animal manure typically contains more nutrients.1 |
|
| Maturity | Maturity refers to the level of completeness of the composting process. Composts that have not progressed far enough along the decomposition process may contain phytotoxic compounds that inhibit plant growth.2 | Seed emergence and seed vigor = minimum 80% relative to positive control |
| Stability | Compost stability refers to the biological activity in the composted material. Unstable composts may use available nitrogen in the soil and stunt plant growth. | CO2 Evolution rate: < 8 mg CO2-C/g-OM/day |
| pH | pH is a measure of acidity/alkalinity. Amending soil with compost can alter soil pH, which in turn can improve plant growth. | 5.5-8.5 |
| Soluble salts | The term “soluble salts” refers to the amount of soluble ions in a solution of compost and water. Because most plant nutrients are supplied in soluble form, excess non-nutrient soluble salts can inhibit plant growth. | Varies widely according to source materials for compost, but should be < 10 dS/m (mmhos/cm) |
| Organic matter | Organic matter is a measure of the amount of carbon-based materials in compost. There is no ideal range of organic matter for compost, but knowing the amount of organic matter in compost may help determine application rates for specific applications. | 30-65% dry weight basis |
| Particle size | It is helpful to know the size of particles in a compost product. There is no ideal range for particle size, as it varies according to use. Specifications can be found on the USEPA web site and MnDOT Grade 2 compost (See Specification 3890). | Pass through 1-inch screen or less; 3/4 inch is preferable per MnDOT Specification 3890 |
| Biological contaminants (weed seeds and pathogens) | Biological contaminants consist of pathogens (disease causing organisms) and weed seeds. High temperatures will inactivate both types of biological contaminants. Minnesota State composting rules require commercial composting operations to hold temperatures over 55 degrees C over an extended period of time to destroy pathogens. In addition, compost operations must monitor the process to prove that these conditions have been met. | Meet or exceed US EPA Class A standards, 40 CFR §503.32(a) levels |
| Physical contaminants (inerts)3 | Inerts are materials (e.g. rocks, plastic, glass) that do not decompose. There is no ideal range but they may be aesthetically unpleasing and add no value to the compost. | < 1% dry weight basis4 |
| Trace metals | Trace metals are elements that can be toxic to humans, animals, or plants at elevated concentrations | Meet or exceed US EPA Class A standards, 40 CFR §503.32(a) levels |
1MnDOT Grade 1 compost is derived from animal material; Grade 2 compost is derived from leaves and yard wastes, and/or SSOM compost with STA certification. See MnDOT Specification 3890
2MnDOT Specification 3890 states: "Considered mature and useable when 60 percent decomposition has been achieved as determined by an ignition-loss analysis test method and any one additional test method including the Solvita test value of equal to or greater than 5. This means that the compost product has no offensive smell, no identifiable organic materials, and will not reheat to more than 20 °F [11 °C] above the ambient temperature." Note, however, that desired maturity may vary depending on the application and time of application.
3Inert material should not be present in adequately screened, vegetated waste compost. Caution should be used when the compost originates as mixed municipal or unscreened compost.
4MnDOT Specification 3890 states: "< 3% at 0.15 in [4 mm]"

C. Application Guidelines: The goal in amending compacted soils with compost is to reach or exceed the stormwater management benefits of naturally occurring soil and vegetation. Compost amended soils will improve on-site stormwater management and reduce long term operation and maintenance costs for off-site water treatment best management practices. Developing a Soil Management Plan is an important first step in minimizing and mitigating impacts to native soils and maximizing onsite stormwater management benefits.
Guide to developing a soil management plan
- Step 1 - Determine soil conditions
- Soil type
- Organic and moisture content
- Degree of compaction
- Step 2: Develop site and grading plans
- Minimize limits of grading
- Minimize construction limits
- Minimize compaction and construction disturbance
- Minimize soil cut and filling
- Maximize green space
- Maximize preservation of soils with high infiltration rates
- Step 3 – Determine/identify the following
- Areas where native soil and/or vegetation will be retained in place;
- Areas where topsoil or subsoil will be amended in place;
- Areas where topsoil will be stripped and stockpiled prior to grading for reapplication; and
- Areas where imported topsoil will be applied.
- Step 4: Identify available material source
- Step 5: Select amendment options and application
- Step 6: Calculate application volumes
- Step 7: Specify as-built testing procedures
In areas where remaining topsoil or subsoil will be amended in place, it is important that, at a minimum, certain soil quality and depth improvements are achieved, as follows.
- Soil Quality: For soils in planting areas, a minimum dry weight organic matter content of 10 percent is recommended. For soils in turf areas, a minimum dry weight organic matter content of 5 percent is recommended. Soil pH should range from 6.0 to 8.0 or match the pH of the original topsoil (WDOE, 2005).
- Depth: Within the construction limits, a minimum, uncompacted depth of 12 inches is recommended (Kunz and Jurries, 2001; WDOE, 2005). In high traffic areas, a minimum uncompacted depth of 18 inches is recommended.
O&M Performance Standards
Warning: Immature compost will not provide the benefits of mature compost. When immature compost is applied to soils it will continue to decompose and the process of decomposition and the by-products it creates and nutrients it demands may be harmful to plants growing in the soil (Garland and Grist, 1995). These effects may be eliminated by adding additional fertilizer, thereby supplying the nitrogen needed for the continued decomposition of the compost and plant needs. You can ensure that you are receiving a mature compost if the composter is permitted as a solid waste or source-separated organics facility by the MPCA and/or if they have passed their Seal of Testing Assurance testing. You can always ask a composter to see their data sheets from their solvita testing for compost maturity.
Application guidelines for compost.
Link to this table
| Planting areas | Turf areas | |
|---|---|---|
| High-traffic areas | (18 inch uncompacted depth) Incorporate 3 inches of compost into the top 5 inches of compacted soil to create a topsoil layer with a minimum depth of 8 inches. Soils below the top soil layer should be scarified to at least 10 inches. | Incorporate 1.75 inches of compost into the top 6.25 inches of compacted soil to create a topsoil layer with a minimum depth of 8 inches. Soils below the top soil layer should be scarified to at least 10 inches |
| Construction limits | (12 inch uncompacted depth) Incorporate 3 inches of compost into the top 5 inches of compacted soil to create a topsoil layer with a minimum depth of 8 inches. Soils below the top soil layer should be scarified to at least 4 inches | Incorporate 1.75 inches of compost into the top 6.25 inches of compacted soil to create a topsoil layer with a minimum depth of 8 inches. Soils below the top soil layer should be scarified to at least 4 inches |
Best management practices to reduce phosphorus migration in soil incorporation applications
- Once applied, incorporate compost into soil before significant rains commence.
- Apply compost in finer textured soil (i.e. clays, silts) and those containing significant amounts of calcium, iron, and/or aluminum, which effectively bind phosphorus.
- Use erosion prevention and sediment control practices to avoid compost or compost amended soil from eroding to surface waters.
- Do not over apply fertilizer phosphorus after compost has been applied.
- Vegetate the site as soon as possible
Success Stories
- In a Virginia field research study on a clay loam soil where biennial applications of biosolids and poultry manure composts were completed, compost treatments significantly increased soil carbon, decreased bulk density, and increased phosphorus levels in the soil. The concentration of phosphorus in runoff was highest in compost treatments, but the mass of dissolved phosphorus was not different among treatments because infiltration was higher and runoff lower in compost amended soil (compared to the control and fertilizer only treatment)(Spargo, J.T., 2006).
- Field research on turf plots completed on soil amended with compost from yard trimmings in Washington State (University of Washington, 1997) illustrated that amended soils increased soil water holding capacity and porosity, thereby reducing runoff volumes. This delayed peak flow of water off of the slope, and reduced total phosphorus migrating from the slope. Overall, the runoff from the compost-amended soils showed the following: 70 percent less total phosphorus, 58 percent less soluble-reactive phosphorus and 7 percent less nitrate in the runoff compared to the runoff from the till-only soil.
- A field research project sponsored by the Texas DOT ([Center for Transportation Research, 2003) evaluated water holding capacity and water quality impacts of biosolids and manure-based composts. The results of the extended column study indicated phosphorus concentrations in the leachate decreased over time for all compost manufactured topsoils and erosion control composts. The total phosphorus concentration in runoff after 12 months of equivalent rainfall were less than 2 mg/L for clay compost manufactured topsoil blends and less than 10 mg/L for sand compost manufactured topsoils and erosion control composts.
Compost blanket

A. Use and description: A compost blanket is a layer of loosely applied composted material placed on the soil in disturbed areas to reduce stormwater runoff and erosion (EPA). The use of compost as an erosion control blanket has become a popular tool for managing both soil erosion and storm water on sloped surfaces. Compost blankets should only be used in applications where water moves as a sheet (not concentrated) flow. Link to compost blanket as an erosion control practice for construction stormwater.
B. Materials: If you are considering using compost as a “blanket” to reduce or prevent erosion the soil blanket should be a composted, weed free organic matter source derived from agricultural, food, or industrial residuals; yard trimmings; or source-separated or mixed solid waste. Particle size shall be as described below in the product parameters table. The compost should meet Class 1 standards.
Well-composted product will provide the best planting medium for grass, wildflower, legume seeding or ornamental planting. Very coarse composts may need to be avoided if the slope is to be landscaped or seeded, as it will make planting and crop establishment more difficult. Composts containing fibrous particles that range in size produce a more stable mat.
Product parameters for compost blanket
Link to this table
| Parameters1,4 | Reported as (units of measure) | Blanket Media to be Vegetated | Blanket media to be left Unvegetated |
|---|---|---|---|
| pH2 | pH units | 6.0 - 8.5 | N/A |
| Soluble Salt Concentration2 (electrical conductivity) | dS/m (mmhos/cm) | Maximum 5 | Maximum 5 |
| Moisture Content | %, wet weight basis | 30 – 60 | 30 – 60 |
| Organic Matter Content | %, dry weight basis | 25 – 65 | 25-100 |
| Particle Size | % passing a selected mesh size, dry weight basis |
|
|
| Stability3 Carbon Dioxide Evolution Rate | mg CO2-C per g OM per day | < 8 | N/A |
| Physical Contaminants (man-made inerts) | %, dry weight basis | < 1 | < 1 |
1 Recommended test methodologies are provided in Test Methods for the Examination of Composting and Compost (TMECC, The US Composting Council)
2 Each specific plant species requires a specific pH range. Each plant also has a salinity tolerance rating, and maximum tolerable quantities are known. When specifying the establishment of any plant or turf species, it is important to understand their pH and soluble salt requirements, and how they relate to the compost in use.
3 Stability/Maturity rating is an area of compost science that is still evolving, and as such, other various test methods could be considered. Also, never base compost quality conclusions on the result of a single stability/maturity test.
4 Landscape architects, plant specialists and project (field) engineers may modify the allowable compost specification ranges based on specific field conditions and plant requirements.
C. Application Guidelines: Compost mulch shall be uniformly applied to a depth described below. Areas receiving greater precipitation, possessing a higher erosivity index, or which will remain unvegetated, will require greater application rates.
When placing compost blanket on a 1:2 (V:H) slope, place and anchor open weave textile netting over the top. Alternatively, apply compost using a pneumatic (blower) or slinger type spreader unit. Project compost directly at soil surface, thereby preventing water from moving between the soil-compost interface. Apply compost layer approximately 3 feet beyond the top of the slope or overlap it into existing vegetation. On highly unstable soils, use compost in conjunction with appropriate structural, stabilization and diversion measures. Follow by seeding or ornamental planting if desired.
Summary of construction requirements: Compost blanket application.
Link to this table
| Annual Rainfall/Flow Rate | Total Precipitation & Rainfall Erosivity Index | Application Rate For Vegetated1 Compost Surface Mulch | Application Rate For Unvegetated Compost Surface Mulch |
|---|---|---|---|
| Low | 1-25”, 20-90 | ½ - ¾ ” (12.5 mm – 19 mm) | 1” – 1 ½” (25 mm – 37.5mm) |
| Average | 26-50”, 91-200 | ¾ - 1” (19 mm – 25 mm) | 1 ½” – 2” (37 mm – 50 mm) |
| High | 51” and above, 201 and above | 1-2” (25 mm – 50 mm) | 2-4” (50mm – 100mm) |
1These lower application rates should only be used in conjunction with seeding, and for compost blankets applied during the prescribed planting season for the particular region.
Best management practices to reduce phosphorus migration in soil surface applications
- Use properly sized compost for an erosion control blanket application; as it will resist eroding.
- Vegetate the compost blanket as soon as possible.
- Use erosion and sediment control devices to avoid compost eroding to surface waters.
- Consider whether the application of inorganic phosphorus fertilizers can be avoided.
- Example of seeding and use of a compost blanket. Click on an image for enlarged view.

Example of dormant seeding - a compost blanket at a Two Harbors site in late November.
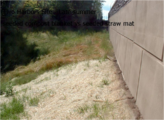
The Two Harbors site in early spring. Compost blanket on left, seeded straw mat on right

The Two Harbors site in late summer shows the relative success of the two methods


Compost filter berm

A. Description and use: This work consists of constructing a raised berm of compost on a soil surface to contain soil erosion, control the movement of sediment off site, and to filter storm water. Filter berms are most effective in managing sediment from sheet flows of water, while filter socks can be used to remove sediment from both sheet and concentrated flows of water.
B. Materials: Filter berm media should be a composted, weed free organic matter source derived from: agricultural, food, or industrial residuals; yard trimmings; source-separated or mixed solid waste. Particle size may vary widely. The compost shall be Class 1 material and will meet the product parameters outlined below.
Where seeding of the berm is planned, use only well composted product that contains no substances toxic to plants. Avoid coarse composts if the berm is to be seeded, as it will make establishment more difficult.
The Landscape Architect/Designer shall specify the berm dimensions depending upon specific site (e.g., soil characteristics, existing vegetation) and climatic conditions, as well as particular project related requirements. The severity of slope grade, as well as slope length, will also influence compost application.
Product parameters for compost filter berm application
Link to this table
| Parameters1,4 | Reported as (units of measure) | Filter Berm to be Vegetated | Filter Berm to be left Un-vegetated |
|---|---|---|---|
| pH2 | pH units | 6.0 - 8.5 | N/A |
| Soluble Salt Concentration2 (electrical conductivity) | dS/m (mmhos/cm) | Maximum 5 | N/A |
| Moisture Content | %, wet weight basis | 30 – 60 | 30 – 60 |
| Organic Matter Content | %, dry weight basis | 25 – 65 | 25-100 |
| Particle Size | % passing a selected mesh size, dry weight basis |
|
|
| Stability3 Carbon Dioxide Evolution Rate | mg CO2-C per g OM per day | < 8 | N/A |
| Physical Contaminants (man-made inerts) | %, dry weight basis | < 1 | < 1 |
1Recommended test methodologies are provided in Test Methods for the Examination of Composting and Compost (TMECC, The US Composting Council)
2Each specific plant species requires a specific pH range. Each plant also has a salinity tolerance rating, and maximum tolerable quantities are known. When specifying the establishment of any plant or turf species, it is important to understand their pH and soluble salt requirements, and how they relate to the compost in use.
3Stability/Maturity rating is an area of compost science that is still evolving, and as such, other various test methods could be considered. Also, never base compost quality conclusions on the result of a single stability/maturity test.
4Landscape architects, plant specialists and project (field) engineers may modify the allowable compost specification ranges based on specific field conditions and plant requirements.
C. Construction Requirements: Parallel to the base of the slope or other affected areas, construct a berm of compost to size specifications. In extreme conditions and where specified by the Landscape Architect/Designer, a second berm shall be constructed at the top of the slope or silt fencing shall be installed in conjunction with the compost berm. Where the berm deteriorates, it shall be reconstructed. Do not use filter berms in any runoff channels (concentrated flows).
Construction requirements for compost filter berm.
Link to this table
| Annual Rainfall/Flow Rate | Total Precipitation & Rainfall Erosivity Index | Dimensions for the Compost Filter Berm (height x width) |
|---|---|---|
| Low | 1-25”, 20-90 | 1’x 2’ – 1.5’ x 3’ (30 cm x 60 cm – 45 cm x 90 cm) |
| Average | 51” and above, 201 and above | 1’x 2’ - 1.5’ x 3’ (30 cm x 60 cm – 45 cm x 90 cm) |
| High | 51” and above, 201 and above | 1.5’x 3’ – 2’ x 4’ (45 cm x 90 cm – 60cm x 120 cm) |
Best management practices to reduce phosphorus migration in compost berm applications
- Use properly sized compost for a berm application; reduce the content of fine compost in the compost (as possible, while maintaining efficacy).
- Consider vegetating the compost berm.
- Consider not using compost filter berms as the most downstream BMP or the last BMP before runoff enters a receiving water at risk of nutrient impairment.
- Do not fertilize a berm that has established vegetation.
Compost Filter Sock

A. Description and use: The compost filter sock is a tubular mesh sleeve that contains compost of a particular specification suitable for stormwater filtration applications. The compost filter sock is a linear, land-based treatment that removes stormwater pollutants through filtration of soluble pollutants and sediments and by deposition of suspended solids (USDA, 2010).
The flexible nature of filter socks allow them to be filled in placed or filled and moved into position, allowing them to be placed on rocky or steep slopes where installation of other erosion control tools is not feasible. The three dimensional shape allows for greater surface contact as well, reducing the potential for runoff to create rills under the device or channels to carry unfiltered sediment.
B. Materials: Filter socks are applicable to construction sites or other disturbed areas where stormwater runoff occurs as sheet flow. In areas where the receiving waters contain high nutrient levels, the site operator should choose a mature, stable compost that is compatible with the nutrient and pH requirements of the selected vegetation. This will ensure that the nutrients in the composted material are in organic form and are therefore less soluble and less likely to migrate into receiving waters. Very coarse (woody) composts that contain less than 30 percent of fine particles (1mm in size) should be avoided if optimum reductions in total suspended solids (TSS) is desired or if the berm is to be seeded.
MnDOT 3897.2 E requires the following characteristics in sediment control logs containing compost.
- Consisting of the following blend of compost and wood chips
- Encased in photodegradable synthetic woven or natural fiber casing with 1/8 to 3/8 inch openings, with a target service life from 12 to 24 months
- Diameter of 7 to 9 inches
C. Construction Requirements: The filter sock is placed perpendicular to sheet-flow runoff to control erosion and retains sediment in disturbed areas, often placed along the perimeter of a site or at interval along a slope. They can also be placed adjacent to each other and perpendicular to stormwater flow to reduce velocity and soil erosion, and as inlet protection.
Compost filter socks can be used on steeper slopes with faster flows than other compost filter devices if spaced closely, stacked beside and/or on top of each other, made larger diameters or used in combination with other stormwater BMPs such as compost blankets.
Filter socks are round to oval in cross section; they are assembled by tying a knot in one end of the mesh sock, filling the sock with the composted material (usually using a pneumatic blower), then knotting the other end once the desired length is reached.
Construction requirements for compost filter sock.
Link to this table
| Parameters1, 4 | Reported as (units of measure) | Vegetated Filter Sock5 | Unvegetated Filter Socka6 |
|---|---|---|---|
| pH2 | pH units | 5-8.5 | 6-8 |
| Soluble Salt Concentration2(electrical conductivity) | dS/m (mmhos/cm) | Maximum 5 | NA |
| Moisture content | %, wet weight basis | 30-60 | 30-60 |
| Organic matter content | %, dry weight basis | 25-65 | 25-65 |
| Particle size | % passing a selected mesh size, dry weight basis |
|
|
| Stability3 Carbon Dioxide Evolution Rate | mg CO2-C per g OM per day | <8 | <8 |
| Physical Contaminants (man-made inerts) | %, dry weight basis | <1 | <1 |
1Recommended test methodologies are provided in Test Methods for the Examination of Composting and Compost (TMECC, The US Composting Council)
2Each specific plant species requires a specific pH range. Each plant also has a salinity tolerance rating, and maximum tolerable quantities are known. When specifying the establishment of any plant or turf species, it is important to understand their pH and soluble salt requirements, and how they relate to the compost in use.
3Stability/Maturity rating is an area of compost science that is still evolving, and as such, other various test methods could be considered. Also, never base compost quality conclusions on the result of a single stability/maturity test.
4Landscape architects, plant specialists and project (field) engineers may modify the allowable compost specification ranges based on specific field conditions and plant requirements.
5Alexander, 2003
6Personal communication, B. Faucette, R. Tyler, N. Goldstein, R. Alexander, 2005
Suggested compost filter sock flow rates. Source: Alexander, R. (2006)
Link to this table
| Annual Rainfall/Flow Rate | Flow rates |
|---|---|
| Low | 4-6 gallons/minute |
| Average | 6-10 gallons/minute |
| High | >10 gallons/minute |
Best management practices to reduce phosphorus migration in compost sock applications
- Use properly sized compost for a sock application; reduce the content of fine compost in the compost (as possible, while maintaining efficacy).
- Consider not using compost filter berms as the most downstream BMP or the last BMP before runoff enters a receiving water at risk of nutrient impairment.
- Consider the incorporation of additives into the compost that bind soluble P (e.g., Fe or Al rich materials, specific polymers, etc.).
Success Stories
- Faucette (University of Georgia) completed sediment and P removal research with straw bales, mulch filter berms, compost filter socks, and compost filter socks + polymer used as perimeter sediment control devices under high intensity/duration single storm event conditions. His research found that:
- All treatments discharged significantly lower total solids (concentration and load) than the bare soil, while all compost sock treatments were significantly lower (concentration and load) than the mulch filter berm and straw bale.
- All compost filter socks had significantly lower (water) turbidity relative to bare soil, and the addition of the polymer to the compost filter sock treatments had significantly lower turbidity relative to the compost filter socks without the polymer.
- A related study found that with the addition of polymers to the compost filter socks improved sediment removal efficiencies from 91% to 99%. Further, when polymers were added to the filter socks and installed on P fertilized soils, P removal efficiencies increased to 92% to 99% (Alexander, 2019).
Engineered media in stormwater BMPs

A. Description and uses: In many jurisdictions, compost is a major component to the primarily sand-based bioretention media. Compost can act as a carbon filter for the media. Since it possesses a high cation exchange capacity, it can bind certain heavy metals, and through its biologic activity, it can degrade certain petroleum hydrocarbons. That stated, compost does contain both P and N, and since they are considered to be contaminants to potable and non-potable water resources, concern exists about their leaching from the bioretention media.
B. Specifications: Engineered media mixes described in this manual contain from 2 to 30 percent organic matter. MnDOT Grade 2 compost (See Specification 3890) is recommended as the organic matter source. Specifications for engineered media mixes are discussed on this page.
C. Application Guidelines: Although the bioretention soil mix is effective at removing pollutants through sedimentation, filtration, and adsorption, the media itself can act as a pollutant source if not properly configured. Fine sands and associated bound pollutants will export during a flushing period of variable duration. Additionally, labile nutrients and other bound pollutants will leach from the compost fraction for an undetermined amount of time (Herrera Environmental Consultants, Inc., 2004). Lab studies looking at both pure compost products and compost/sand based bioretention media found that concentrations of nitrogen, phosphorus, and copper were high in the initial few storms and then decreased (Flury, et, al., 2015).
When considering the risks of loss of phosphorus through leaching, it is important to consider the compost may only make up 10 to 30 percent of the media. It’s presence in the media can be an effective method to capture heavy metals and can aid in keeping vegetation alive in the bioretention feature, which improves the overall functionality of the feature. Additionally, research indicates that the addition of iron or aluminum rich water treatment residuals to bioretention media containing compost and biosolids treated solids can substantially bind soluble phosphorus (O’Connor & Chinault, 2007).
BMP’s to reduce P migration in bioretention media applications
- Use a smaller percentage of compost in the media (e.g. Mixes C and D).
- Use compost with a reduced content of fine compost (as possible, while maintaining efficacy).
- Establish vegetation as soon as possible.
- Consider growing vegetation which can be harvested to remove excess nutrients.
- Mulch over the bioretention media with a non-floating (minimally-floating) organic mulch.
- Consider the incorporation of additives into the compost that bind soluble phosphorus (e.g., iron or aluminum rich materials, specific polymers, etc.).
- Only fertilize when establishing vegetation and use slow-release fertilizer products.
Other uses
In addition to improving the stormwater management functions of compacted soils, compost has several other beneficial uses.
- Soil reclamation: Compost can be used to reclaim highly disturbed and low quality soils on sites of old factories, landfills, and brownfields. Application rates in such situations often range from 25 to 175 tons per acre, much higher than typical compost application rates. Benefits include improved soil quality and enhanced plant establishment (Alexander, 1999).
- Wetland construction: Due to its similar physical and chemical properties to certain wetland soils, compost is being used to mimic hydrology, soil properties and plant community composition wetland functions.
- Pollution remediation: Compost has been shown to be effective in degrading or immobilizing several types of contaminants, including hydrocarbons, solvents, and heavy metals (Alexander, 1999).
- Pollution prevention: Compost has been included as a component of biofilters and bioswales to treat contaminated air and water with great success (Alexander, 1999). Compost treated areas have also be shown to be effective at reducing erosion and stormwater runoff (Glanville, et. al., 2003).
Additional information
- Minnesota Pollution Control Agency
- Washington Department of Ecology. 2005. Guidelines and Resources for Implementing Soil Quality and Depth BMP T5.13
- Soils for Salmon
- U.S. Composting Council
- U.S. Composting Council Seal of Testing Assurance Program
- USEPA Construction Site Storm Water Runoff Controls; Compost Blankets
- Organic Recycling Outreach Guide
- International Stormwater BMP Database Summary Statistics
- Green Roof Pollutant Removal
- Addressing phosphorus concerns with media mixes
- SERA
References
- Herrera Environmental Consultants, Inc. (2014). 185th Avenue NE Bioretention Stormwater Treatment System Performance Monitoring. Prepared for City of Redmond Public Works, Natural Resources Division.
- Center for Transportation Research, the University of Texas at Austin. (2003). 23 Characteristics of Composts: Moisture Holding and Water Quality Improvement.
- Alexander, R. 1999. Compost Markets Grow with Environmental Applications. BioCycle. Vol. 40, No. 4, pp. 43-48.
- R. Alexander, Phosphorus and Compost Use Dynamics. BioCycle, December 2016
- Alexander, R. American Association of State Highway & Transportation Officials (AASHTO). (2006). Filter Berm and Filter Socks: Standard Specifications for Compost for Erosion/Sediment Control.
- Barr Engineering Company. 2011. Assessment of MIDS Performance Goal Alternatives: Runoff Volumes, Runoff Rates, and Pollutant Removal Efficiencies.
- Markus Flury, Jessica M. Mullane, Maninder K. Chahal, Craig G. Cogger. Experimental Evaluation of Compost Leachates. Department of Crop and Soil Sciences, Washington State University, Puyallup, WA.
- Field Test of Compost Amendment to Reduce Nutrient Runoff. (1997). Prepared for the City of Redmond (WA) Public Works by the University of Washington, Forest Resources.
- Garland, G. and Grist, T.1995. The Compost Story: From Soil Enrichment to Pollution Remediation. BioCycle. Vol. 36, No. 10, pp. 53-56.
- Glader, Kerry. 2013. Personal communication: soil tests of bioretention soil media with peat compost.
- O’Connor, G. and Chinault, S. 2007. Characterization of Milorganite Related to Phosphorus Potential for Soil Water Movement. University of Florida.
- Glanville, T., Richard, T., and Persyn, R. 2003. Impacts of Compost Blankets on Erosion Control, Revegetation, and Water Quality at Highway Construction Sites in Iowa. Iowa State University.
- Kunz, D. and D. Jurries. 2001. Restoring Soil Health. Oregon Department of Environmental Quality.
- Lucas, W. C. and M. Greenway. 2011. Phosphorus Retention by Bioretention Mecocosms Using Media Formulated for Phosphorus Sorption: Response to Accelerated Loads. Journal of Irrigation and Drainage Engineering 137(3): 144-152.
- McDonald, D. 2005. Soil Restoration with Organics Enters Mainstream of Storm Water Practices. BioCycle. Vol. 46, No. 4, pp. 20-22.
- Personal communications with Dr. John T. Spargo, Director, Agricultural Analytical Services Laboratory, The Pennsylvania State University. 3/8/19.
- Personal communications with Dr. George O’Connor, the University of Florida. 3/8/13.
- Rawls, W.J., D. Gimenez, and R. Grossman. Use of Soil Texture, Bulk Density, and Slope of the Water Retention Curve to Predict Saturated Hydraulic Conductivity. 1998. Transactions of the ASAE. Vol. 41(4):983-988.
- John T. Spargo,* Gregory K. Evanylo, and Marcus M. Alley. Repeated Compost Application Effects on Phosphorus Runoff in the Virginia Piedmont. Journal of Environmental Quality. 35:2342-251 (2006).
- U.S. Department of Agriculture, Natural Resources Conservation Service. 2009. Small Watershed Hydrology WinTR-55 User Guide.
- U.S. Department of Agriculture, Natural Resources Conservation Service. 2010. Utilization of Compost Filter Socks. Agronomy Technical Note No. 4.
- U.S. Environmental Protection Agency, National Pollutant Discharge Elimination System (NPDES). Construction Site Stormwater Runoff Control: Compost Filter Socks.
- Washington Department of Ecology. 2005. Guidelines and Resources for Implementing Soil Quality and Depth BMP T5.13.
- Large scale compost sites
- Small compost sites
- Composting in your backyard
- Organics drop-off sites
- MnDOT approved/qualified products
- Minnesota compost facility locator
- Minnesota Administrative Rules for compost facilities
Literature review
The literature cited below was reviewed as part of a literature review conducted for the original stormwater manual. Some of the references and material may therefore be dated or inaccurate. For example, some studies pertaining to removal of dissolved phosphorus removal were conducted with high influent phosphorus concentrations (e.g. > 1.0 mg/L) and do not reflect typical stormwater.
- Alexander, R. 1999. Compost markets grow with environmental applications. BioCycle 40(4): 43- 48. Summarizes uses of compost: erosion control, revegetation and reclamation of marginal and low quality soils, biofilters and bioswales, bioremediation, wetlands construction. The benefits of amending soil with compost include improved soil quality, reduced erosion, enhanced plant establishment, immobilization of toxic metals and supplying microbes.
- Alexander, R. 2003. Landscape Architect Specifications for Compost Utilization. The LASCU, developed for the Clean Washington Center and the US Composting Council is a guide that give specifications for specific uses of compost. Topics include turf establishment (page 40-41), planting bed establishment, backfill mix, mulch, compost blanket for erosion control (pages 48-19), and compost filter berms for sediment control (pages 40-51).
- Composting Council Research and Education Foundation. 2001. Compost Use on State Highway Applications. CCREF/USCC. Document focuses on compost use on state and local ‘roadside’ applications. Defines compost as “the product resulting from the controlled biological decomposition of organic material that has been sanitized through the generation of heat and stabilized to the point that it is beneficial to plant growth. Compost bears little physical resemblance to the raw material from which it originated. Compost is an organic matter resource that has the unique ability to improve the chemical, physical, and biological characteristics of soils or growing media” (p. 2) The addition of compost to soil provides the following benefits: improved structure, moisture management, modifies and stabilizes ph, increases cation exchange capacity, provides nutrients, provides soil biota, suppresses plant diseases, binds contaminants (p. 3). Includes info on State DOT compost specifications and a “Model DOT Compost Specification. Common specification parameters include pH, particle size, soluble salts, organic matter, moisture content, stability/maturity, pathogens, heavy metals, inerts (p. 55).The importance of each parameter is discussed on p. 61-62.
- Faucette, B. (February, 2008). Performance and Design for Compost Erosion Control and Compost Storm Water Blankets. Environmental Connection 2008: Drive Your Future. Paper presented at 39th Annual Conference and Expo of the International Erosion Control Association 18-22 February 2008, Orlando, Florida. This paper utilized the reported results from peer reviewed research papers to establish design values for compost blankets used in slope stabilization (compost erosion control blankets) on disturbed soils and for run off reduction (compost storm water blankets) for Low Impact Development (LID) design applications. It specifically reported on the effects of particle size specifications, soil loss ratio, LID design objectives, initial abstractions, runoff curve numbers and run off coefficients (recommended use of a conservative value of .28) for compost erosion control and storm water blankets.
- Garland, G. and Grist, T.1995. The compost story: From soil enrichment to pollution remediation. Bio-Cycle 36(10): 53-56.
- Defines compost as “a recycled product made from the organic portion of municipal solid waste” (p. 2). Compost is NOT peat or mulch. As organic wood mulch decays it tends to use the nitrogen already in the soil, reducing the amount available for plants. This lack of available nitrogen can retard the growth of young plants. Immature compost is nothing more than an organic mulch and does not provide the benefits of mature compost.
- Beneficial uses of compost: soil enrichment (adds organic bulk, increases earthworm populations, humus, and cation exchange capacity), pollution prevention, and pollution reduction.
- Ge, B., McCartney, D., and Zeb, J. 2006. Compost Environmental Protection standards in Canada. Journal of Environmental Engineering Science 5: 221-234.
- Canadian standards typically consider maturity, trace element (heavy metals), time-temperature requirements, microbial pathogens, and foreign matter.
- Defines stability as “the rate or degree of organic matter decomposition” (p. 223). Stability can be determined by microbial activity and/or substrate availability (examples include microbial respiration and energy release).
- Defines maturity as “the degree of decomposition of phytotoxic organic substances produced during decomposition” (p. 223). Can be determined by a plant biotest.
- Maturity and stability are important considerations because “immature compost applied to the soil will continue to decompose and may produce odorous products and are often toxic to plants.
- A trace element is a chemical element present in compost at a very low concentration (p. 224). States that there are three approaches to developing trace element standards: no net degradation, risk-based, and best achievable technology.
- Microbial pathogens: Four major categories of pathogens: bacteria, enteric viruses, protozoa, and helminthes. Some pathogens may survive in finished compost if the compost is immature or if thermophilic conditions are not achieved throughout the composting mass.
- Foreign matter: Defined as “any matter over 2 mm in dimension that results from human intervention and has organic or inorganic components such as metal, glass, synthetic polymers” (p. 230). Excludes mineral soil, woody material, and pieces of rock.
- Glanville, T., Richard, T., and Persyn, R. 2003. [Impacts of Compost Blankets on Erosion Control, Revegetation, and Water Quality at Highway Construction Sites in Iowa]. Iowa State University.
- The primary objective of this research project is to compare the performance of compost treated and conventionally treated roadway embankments. Performance was measured using the following parameters: runoff quantity, runoff quality, rill and interrill erosion, and seasonal growth of planted species and weeds.
- Study tested 3 types of compost: fine-textured biosolids compost, a coarse-textured mulch-like yard waste compost, and a medium-textured bio-industrial compost derived from paper mill and grain processing sludge (selected because of wide-spread availability in Iowa). Compost types were spread as blankets at 2 depths (5 cm and 10 cm) and were not incorporated into the underlying soil.
- Results:
- Compost treated areas produced equal amounts of plant material when compared to topsoil or compacted subsoils
- Compost treated areas produced 1/3 of the weed biomass found on conventionally treated areas
- Compost treated areas produced 0.2 millimeters of runoff or less during the first ½ hour of intense rainfall (compared to 0.15 millimeters runoff from conventionally treated areas)
- Blanket depth had a significant effect on the amount of runoff – areas treated with 5 centimeters of compost had 1.5 times the runoff of areas treated with 10 cm of compost
- Total mass of eroded material in runoff from composted plots was less than 0.02 percent of that in runoff from conventionally treated plots
- Herrera Environmental Consultants, Inc. 2015. Analysis of Bioretention Soil Media for Improved Nitrogen, Phosphorus and Copper Retention. Kitsap County Public Works.
- The study reviews at how to improve bioretention soil mixures performance for the capture and retention of N,P, and Cu. Based on the conclusions the following conclusions were provided:
- The study results indicate the treatments containing the coco coir pith are generally the best performers out of all the treatments evaluated.
- The study results also indicated that granular activated carbon and high carbon wood ash increase treatment performance for several pollutants; however, it is not clear which component provides the most benefit.
- The study reviews at how to improve bioretention soil mixures performance for the capture and retention of N,P, and Cu. Based on the conclusions the following conclusions were provided:
- Jay, J., Brown, S., Kurtz, K., and Grothkopp, F. 2017. Predictors of Phosphorus Leaching from Biretention Soil Media. Journal of Environmental Quality 46 (5): 1098-1105.
- In this study, the phosphorus saturation index (PSI) and P saturation ratio (PSR) were assessed as possible tools for predicting phosphorus leaching across a range of bioretention soil mixtures (BSMs). In this study PSI was found to be a poor predictor of P leaching while the Mehlich -3 PSR was a good predictor of total and dissolved P leaching. This study notes that the wide variety of BSMs used may indicate that PSR could be an effective predictor that could be used across different regions with difference BSM ingredients and requirements. Additional studies are needed to understand the effectiveness of the Mehlich-3 PSR and ammonium oxalate PSI as predictors of P leaching.
- Kunz, D. and Jurries, D. 2001. Restoring Soil Health. Oregon Department of Environmental Quality.
- This document explains the link between land use planning, and building and road construction, and degraded surface water. It summarizes current research on the benefits of amending soil with compost and provides information on technical specifications for using and applying compost to building and road construction projects.
- Suggests “tilling in about 4” of compost is a simple, cost-effective way to restore organic health to a site” (p. 5). Construction activities can increase stormwater runoff by compacting soil (p. 8). Discusses impacts of human activity on soils including compaction and degraded soils and suggests compost amendments to be a solution to the problems associated with compact and degraded soils. Compost amendments can increase the porosity of the soil and add beneficial organisms and nutrients back to the soil. Recommend applying four inches of compost on the surface and tilling it in to a depth of eight inches of compacted soil for a total depth of twelve inches (p. 13).
- Farfel, M., Orlova, A., Chaney, R., Lees, P., Rohde, C., Ashley, P. 2004. Biosolids Compost Amendment for Reducing Soil Lead Hazards: A Pilot Study of Orgro® Amendment and Grass Seeding in Urban Yards. Science of the Total Environment 340 (2005) 81– 95. The study looked at how biosolids compost could reduce the bioavailability and bioaccessibility of lead in urban yard soil and how it can aid in establishing vegetation. Study sites were rototilled and amended with 6-8 cm depth of Orgro® biosolid compost. The study showed a slight reduction in bioaccessible Pb concentrations after a period of 1-year at two of the four sampling lines. The other 2 sampling lines showed no reduction. Further research is needed to investigate the extent and timing biosolids may further reduce bioavailability and bioaccessibility in urban yard soils.
- Faucette, B., Cardoso, F., Mulbury, W., Millner, Pat. Performance of Compost Filtration Practice for Green Infrastructure Stormwater Applications. Water Environment Research 85(9): 806-14. The study looked at the removal efficiency of compost filter socks for soluble phosphorus, ammonium-nitrogen, nitrate-nitrogen, E. coli, Enterocuccus, and oil from urban stormwater runoff. Treatments were exposed to simulated storm water pollutant concentrations consistent with urban runoff. Results showed that filter sock with natural sorbents removed a significantly greater amount of soluble phosphorus than the filter sock alone. Both the filter sock and the filter sock with natural sorbents removed 99% of oil over 25 simulated events. The filter sock and the filter sock with natural sorbents removed E. coli and Enteroccocus at a rate of 85% and 65% respectively.
- L.B. Faucette, Jordan, C.F., Risse, L.M., Cabrera, M., Coleman, D.C. and West, L.T. Evaluation of stormwater from compost and conventional erosion control practices in construction activities. Journal of Soil and Water Conservation 2005 60(6): 288-297. Focuses on the impact of construction on soil erosion related to nonpoint source pollution in the US with relation to nutrient loss. Tests were performed with compost blankets, hydroseed, silt fence and bare soil being applied to filled test plots and seeded with Bermuda grass and rainfall simulator applied with an average rate equivalent to 50 yr hr-1 event at three intervals to note effects of new, recently established, and matured plants. Findings concluded use of compost out performed hydroseed with silt fence, generating 24% less run-off after one year, though all treatments were successful in reducing solids loss. Though materials high in inorganic nitrogen showed a great amount of nitrogen in storm runoff, they showed a reduced N loss over time, with hydroseeding generating higher total phosphorus compared to compost in storm runoff during the first storm event. Treatments higher in inorganic N showed higher N load runoffs and therefore it is recommended that compost with a higher organic N of the total N be used. Additionally compost with higher concentrations of C, organic matter, and Ca (as added gypsum) may reduce P runoff, showing that compost with higher organic matter content is likely very important in minimizing P loss.
- L.B. Faucette, J. Governo, C.F. Jordan, B.G. Lockaby, H.F. Carino, and R. Governo. Erosion control and storm water quality from straw with PAM, mulch, and compost blankets of varying particle sizes. Journal of Soil and Water Conservation 2007 62(6): 404-413. This objectives of this study was to determine how blending wood mulch with compost may affect its performance as an erosion control practice relative to a straw blanket with polyacrylamide (PAM) and if particle side distribution of the organic erosion control blanket affects runoff, erosion, and vegetation establishments. The study concluded that the greater percent of compose used in an erosion control blanket the lower run-off totals and rates, with compost erosion control blankets retaining the most rainfall (80%), wood mulch blankets the second most (34%), and straw mulch last (27%). The greater the percent of compost used in the erosion control blanket, the lower the total runoff, greater percent of rainfall absorption and the slower the runoff rate. The greater the percent of wood mulch used in the erosion control blanket, the lower the sediment and suspended sediment load, concluding that particle size distribution is the leading factor in influencing runoff and/or sediment loss, with greater amount of small particles having a greater ability to reduce run off but the greater amount of large particles having a greater ability to slow runoff rates and slower sediment loss. It was noted that the Nitrogen and Phosphorus loading from mineral fertilized used with conventional straw blankets may lead to an increase in nutrient loading of receive surface water as compared to compost and mulch blankets.
- Faucette, B., Sefton, K.A., Sadeghi, A.M, and Rowland, R.A. Sediment and phosphorus removal from simulated storm runoff with compost filter socks and silt fence. Journal of Soil and Water Conservation 2008 63(4): 257-264. This study evaluated the performance of compost filter socks for controlling storm runoff and sediment on construction sites to determine and compare the sediment removal efficiency of silt fence and compost filter socks, if the addition of polymers to compost filter socks could reduce sediment and phosphorus loads, and the relationships between compost filter media particle size distribution and pollutant removal efficiency and hydraulic flow rate. While compost filter socks, compost filter socks with polymer and silt fence treatments all significantly reduced the TSS concentrations, loads, and turbidity NTUs related to bare soils, it was shown that the addition of polymers to compost filter socks significantly had the highest reduction of TSS concentration and loads, and turbidity in runoff, with silt fence and traditional compost filter showing somewhat equal and lesser results in testing. Polymers added to compost filter socks to target sediment reduction, hydraulic flow may be restricted. Additionally, the study noted that particle size distribution specifications for compost filter media for predicting performance of filter socks and berms, but hydraulic flow through rate is a better predictor of pollutant removal efficiency performance for this technology.
- Faucette, B., Sheilds, F., Kurtz, K. 2006. Removing Storm Water Pollutants and Determining Relations between Hydraulic Flow-Through Rates, Pollutant Removal Efficiency, and Physical Characteristics of Compost Filter Media. 2nd Interagency Conference on Research in Watersheds Proceedings, May 2006. The study evaluated the pollutant removal efficiency of various compost filter media within a filter sock under laboratory conditions. The study found that with the addition of polymers to the compost filter socks improved sediment removal efficiencies. Further, when polymers were added to the filter socks and installed on P fertilized soils, P removal efficiencies increased from 6% to 93%. Results indicate that by adding polymers to a filter sock its application expands beyond only sediment control to storm runoff filtration capable of capturing target soluble pollutants, such as petroleum hydrocarbons and phosphorus.
- Glanville, T., Persyn, R.A., Richard, T. 2001. Impacts of Compost Application on Highway Construction Sites in Iowa. Agriculture and Biosystems Engineering Conference Proceeding and Presentation. Runoff rates and interrill erosion rates for three different types of composted organics was evaluated along a newly constructed roadway embankment. The study showed that runoff from plots treated with yard waste and bio-industrial waste composts were statistically lower from plots treated with topsoil. In addition, interill erosion was significantly higher on topsoil-treated plots when compared to compost-treated plots.
- McDonald, D. 2005. Soil Restoration with Organics Enters Mainstream of Storm Water Practices. Bio-Cycle 46 (4): 20-22. Features the Soils for Salmon project. The project promotes BMPs for protecting native soil and vegetation where possible, and for restoring soil functions on disturbed sites through the incorporation of organic amendments. Amending the soil with compost provides the following benefits: “increases stormwater infiltration, reducing damaging runoff, and also helps filter out urban pollutants (oils and metals from roads, pesticides and fertilizers from landscapes) while creating more successful landscapes that need less chemicals and less summer irrigation” (p. 20).
- Musick M., and Stenn, H. 2004. Best Management Practices for Post-Construction Soils. BioCycle 45 (2): 29. Summarizes new guidelines for soil quality and depth BMPs in Washington State Stormwater Manual. Benefits of undisturbed soils include: water infiltration and storage, nutrient and sediment adsorption, and pollutant biofiltration. Top priority is given to preservation of existing soils. For sites that must be cleared and graded, guidelines require that all disturbed and compacted soils shall be amended to mitigate for lost moisture infiltration and moisture holding capacity. Guidelines call for a minimum of 8 inches of topsoil over subsoil scarified to a depth of 4 inches.
- Noble, R., and Coventry, E. 2005. Suppression of soil-borne plant diseases with composts: A review. Biocontrol Science and Technology 15(1): 3-20. Reviews several studies that show the suppressive effect of compost on soil-borne diseases.
- Pitt, R., et al.1999. Infiltration Through Disturbed Urban Soils and Compost-Amended Soil Effects on Runoff Quality and Quantity. US EPA. Article examines the effects of urbanization on soil structure and how compaction affects infiltration of rainwater. Also looks at the effectiveness of using compost as a soil amendment to increase infiltration and reduce runoff. Found a “generally beneficial effect of the compost amendment in regards to nutrient content as well as soil physical properties known to affect water relations in soils” (p. 4-1). Found that “the use of compost amended soil resulted in significantly increase infiltration rates compared to soil alone” (p. 4-2). Found that “the growth rates of turf were also greater for the amended sites” (p. 4-4).
- Poland, C.J. 2018. Reviewing Compost Use in Construction and Modeling the Hydrologic Response of Vegetated Compost Blankets. Civil and Environmental Engineering, University of Wisconsin-Madison. The study evaluated the use of compost in large scale earthwork projects and presented a way to model the hydrologic response of vegetated compost blankets, as well as unvegetated compost blankets. A literature review outlining how compost can be used for soil stabilization, runoff reduction, and vegetation establishment in construction sites. Modeled results indicate that compost type and thickness does matter for runoff.
- Risse, M. and Faucette, B. 2001. Compost Utilization for Erosion Control. Cooperative Extension Service, The University of Georgia college of Agricultural and Environmental Science.
- Defines composting as “the controlled biological process of decomposition and recycling of organic material into a humus rich soil amendment known as compost. Mixed organic materials (Example: manure, yard trimmings, food waste, biosolids) must go through a controlled heat process before they can be used as high quality, biologically stable and mature compost (otherwise it is just mulch, manure or byproduct)” (p. 1). Focuses on benefits of compost for erosion control such as increasing water infiltration, reducing runoff and soil particle transport in runoff, increasing plant growth and soil cover, reducing soil particle dislodging, increasing water holding capacity of soil, which reduces runoff, buffering soil ph which can increase vegetation establishment and growth, alleviates soil compaction by increasing soil structure, new vegetation can be established directly into compost (p. 3)
- Includes recommended compost specifications for several parameters including particle size, moisture content, soluble salt, organic matter, ph, nitrogen content, human made inerts, application rate/size, maturity
- Russell, S. and Best, L. 2006. Setting the Standards for Compost. BioCycle 47(6): 53-56. Summarizes UK standards for compost (feedstocks, stability tests, monitoring procedures, and certification methods). Includes guidelines for pathogens, potentially toxic elements, stability/maturity, plant response, weed seeds and propagules, physical contaminants, stones (see page 55).
- Zabinski, C., et al. 2002. Restoration of Highly Impacted Subalpine Campsites in the Eagle Cap Wilderness, Oregon. Restoration Ecology 10(2): 275-281. Tested the use of compost in the restoration of highly impacted campsites in the Eagle Cap Wilderness plots as four campsites were scarified, amended with compost, and planted to native species. Assessed the degree to which campsite activity altered soil chemical and microbial properties relative to undisturbed soils and the degree of recovery after compost application. Found that three years after compost amendments were applied, levels of total carbon, PMN, and microbial carbon utilization profiles on campsites were equivalent to those under vegetation on undisturbed sites. Compost amendments also supplied “a slow release of macro and micronutrients, improved water-holding capacity, reduced albedo, and increased heat absorption in the spring” (p. 279).
This page was last edited on 16 February 2023, at 21:31.