Case study for using P8 to meet TMDL permit requirements Revision as of 18:12, 13 August 2019 by Mtrojan (talk | contribs) (Created page with "left|100px|alt=image File:Lake Riley TMDL image.png|300px|thumb|alt=map of Lake Riley|<font size=3>Lake Riley and subwatersheds</...")
The following case study highlights an example total maximum daily load (TMDL) and describes how a Municipal Separate Storm Sewer System (MS4) permittee can use P8 modeling to evaluate wasteload allocation WLA compliance. For guidance on using P8 to meet TMDL permit requirements, link here.
Contents
TMDL Description: Lower Minnesota River Watershed TMDLs, Lake Riley
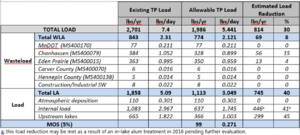
The Draft Lower Minnesota River Watershed TMDLs: Part II – Northern Watersheds: Riley-Purgatory-Bluff Creek and Nine Mile Creek Watersheds (MPCA, 2018) is a combined TMDL document which developed total phosphorus (TP), total suspended solids (TSS), and E. coli TMDLs for many streams and lakes within the Riley-Purgatory-Bluff Creek (RPBCWD) and Nine Mile Creek (NMCWD) watersheds. The draft TP TMDL developed for Lake Riley (AUID 10 0002 00) is shown in a screen shot on the right.
The TMDL is one of many TMDLs included in the combined Lower Minnesota Watershed TMDL document. All WLAs developed in the combined TMDL document are individual WLAs, meaning that allocations are assigned to each individual MS4, rather than combining the WLAs assigned to all MS4s into a single combined 9categorical) WLA. The TMDLs developed in this draft TMDL document include an estimate of existing loading (pounds of TP per year, lbs/yr), allowable TP loading, and the percent pollutant reduction required by each MS4s. TMDLs structured in this way provide clear guidance and reduction targets for MS4s.
MS4 compliance
The following subsection provides an overview of reporting related to TMDL requirements and an example of how MS4s included in the draft Lake Riley TP TMDL could use P8 modeling to evaluate and demonstrate progress towards TMDL compliance. The following links provide information related to TMDLs and permit compliance.
- Summary of TMDL requirements in storm water permits
- MS4 Permit Requirements overview and TMDL Attachment Spreadsheet
- 2019 MS4 General Permit
- Rice Marsh Lake and Lake Riley Use Attainability Analysis (Barr, 2016)
Using P8 to Demonstrate WLA Compliance: Eden Prairie
The draft TP TMDL for Lake Riley shows that two (2) MS4s are required to reduce annual TP loading (i.e., the Cities of Chanhassen (MS400079) and Eden Prairie (MS400015)). An overview of general steps which should be taken by MS4s not meeting WLAs for approved TMDLs is included below. More detailed information related to each step can be found here.
Note: the case study example developed in this section is provided as an example of how an individual MS4 can demonstrate WLA compliance using P8, and was not developed with input or coordination with the MS4 permittees.
1. Review applicable WLAs developed in the TMDL. As outlined in Appendix A of the Draft Lower Minnesota River Watershed TMDLs: Part II – Northern Watersheds: Riley-Purgatory-Bluff Creek and Nine Mile Creek Watersheds (MPCA, 2018), P8 was used to evaluate watershed loading, including evaluating existing pollutant loading from MS4s. For the Lake Riley TP TMDL, it was determined that the City of Eden Prairie needed to reduce existing TP loading to Lake Riley by 13 lbs/yr (4% from the existing load) for the 2014 water year (October 2013 to October 2014).
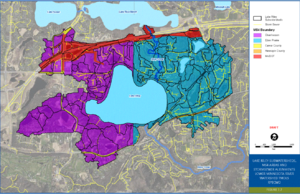
2. Review the drainage area used to develop the TMDL. Approximately 800 acres of Eden Prairie is included in the Lake Riley drainage area, which is approximately four percent (4%) of the total municipal area of Eden Prairie (see map at top of this page). It is critical to determine the drainage area the TMDL applies to, as the WLA and required pollutant reduction apply only to the area tributary to the impaired waterbody. Because the WLA applies to the impaired water, pollutant reduction achieved within the MS4 but not within the tributary area to the impaired water does not apply to the required reduction targets developed by the WLA.
Note: for TMDLs developed for large, regional waterbodies, the tributary MS4 area may be the entire municipal area. If the applicable MS4 area is not clearly outlined within the TMDL, mapping and associated digital files can be requested directly from the MPCA. The MPCA maintains a database of drainage area files which can be downloaded from the source: PLACEHOLDER FOR LINK.
3. Review the TMDL modeling period and existing BMPs incorporated into the TMDL (i.e., determine the baseline condition used to establish the WLA). In addition to determining existing loading and required pollutant reduction, it is critical to determine (a) what modeling period was used to establish the TMDL and (b) what best management practices (BMPs) were incorporated into the TMDL model used to develop WLA reduction targets. Typically, TMDLs are developed for a fixed period (e.g., the ten (10) year period prior to TMDL development) or for a “critical” period of poor water quality. The Lake Riley TP TMDL was developed for the “critical” water year of 2014 (October 2013 to October 2014). When applicable, the period used to develop the TMDL (e.g., water year 2014) should also be used as the modeling period for evaluating progress towards meeting the established WLA.
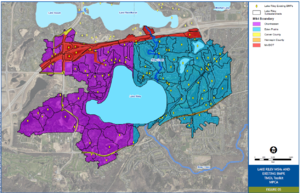
In addition to determining the modeling period, it is critical to determine what BMPs were incorporated into the TMDL and associated WLAs. For the Lake Riley TP TMDL, the existing BMPs incorporated into the TMDL model are shown in the figure to the left. Because pollutant reduction from BMPs incorporated into the TMDL model are incorporated into the WLA analysis, pollutant reduction from these BMPs does not apply to WLA target reductions. As discussed in item 5 below, the permittee should perform a review of BMPs incorporated into the TMDL model to confirm BMPs were modeled correctly (e.g., confirm outlet configuration, confirm bathymetric volumes, confirm modeled infiltration rates, etc.).
Note: many TMDLs are developed based on land use and contributing area loading without accounting for existing BMPs (i.e., no existing BMPs included in the TMDL model). For these TMDLs, all existing BMPs count towards WLA reduction targets, meaning that in some cases, the WLA has already been achieved based on existing BMPs. For this reason, it is critical to inventory BMPs in the tributary MS4 area (item #4) and to compare this inventory to BMPs incorporated into the TMDL condition model.
4. Develop an inventory of existing water quality BMPs related to the TMDL pollutant. There are many wet pond and wetland BMPs within the portion of Eden Prairie tributary to Lake Riley (52 wet ponds and wetland BMPs in Eden Prairie portion of watershed). All wet pond and wetland BMPs were incorporated into the TMDL model developed for Lake Riley, but there may be other BMPs that were not incorporated into the TMDL model. For this reason, it is critical that the MS4 develop an inventory of all structural (e.g., infiltration BMPs) and non-structural BMPs (e.g., street sweeping) within the portion of the MS4 tributary to the impaired water body. For maintenance and tracking purposes, some MS4s may already have an established BMP inventory, while other will need to create a BMP inventory for the purposes of WLA compliance evaluation and tracking. For the Lake Riley TP TMDL, a list of structural and non-structural BMPs to consider in the existing BMP inventory is listed below.
Note: more detailed descriptions and design consideration for the structural and non-structural BMPs listed below can be found in the Rice Marsh Lake and Lake Riley Use Attainability Analysis (Barr, 2016).
Examples of structural BMPs to inventory related to TP reduction (Barr, 2016) include the following.
- Wet ponds
- Bioretention (i.e., rain gardens)
- Infiltration basins and trenches
- Sand filters and iron-enhanced sand filters
- Hydrodynamic separators (i.e., grit chambers)
- Alum and ferric chloride treatment plants
- Spent lime filtration
Examples of non-structural BMPs to inventory related to TP reduction (Barr, 2016) include the following.
- Street sweeping
- City ordinances (e.g., related to fertilizer application)]
- Public education and outreach
Because the Lake Riley TMDL model contains only wet pond and wetland BMPs (see item 5), any other structural and any non-structural BMPs should be incorporated into the model. Pollutant reduction associated with any existing BMPs not originally included in the TMDL can be applied towards target WLA reductions. For example, if an existing street sweeping program was found to produce eight (8) pounds of TP during the TMDL modeling period (i.e., the 2014 water year), this could be applied to the target WLA reduction of 13 lbs/yr, reducing the required WLA target reduction to 7 lbs/yr. More information regarding street sweeping, including a calculator for estimating street sweeping sediment and pollutant removal can be found here. Information on other non-structural practices can be found here.
5. Develop P8 model to evaluate WLA compliance (or request the P8 model used to develop the TMDL from the MPCA, if applicable). After review of the TMDL and development of the existing BMP inventory, the next step is to develop a P8 model based on the TMDL modeling period and drainage area outlined in the TMDL (see step #3). Because the Lake Riley TP TMDL was developed using P8, MS4s included in the TMDL may choose to request and use the P8 model used to develop the TMDL to evaluate and track progress towards meeting the WLA.
Note: a number of methods (e.g., monitoring) and models (e.g., the MPCA Simple Estimator) can be used to evaluate TMDL compliance, however, because this section focuses on P8, the following steps reference the P8 water quality model.
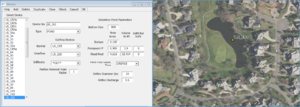
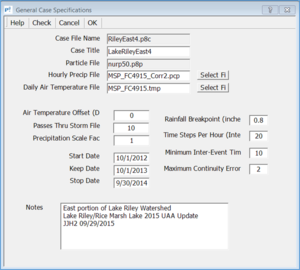
- a. Develop (or review) existing BMP inputs and model for the TMDL modeling period. In the case of the Lake Riley TP TMDL, Eden Prairie may choose to request the P8 model used to develop the TMDL. After receiving the TMDL P8 model, the City should (a) compare modeled BMPs included in the TMDL P8 model to the existing BMP inventory (step 4), (b) review and confirm model input parameters for modeled BMPs are correct and (c) generate model inputs for BMPs not included in the received model using model input guidance. An example of model inputs for wet pond LR_101 are shown in the figure to the right. After reviewing, updating, and creating all required existing BMP inputs, the job control must be updated to match the TMDL modeling period (i.e., the 2014 water year for the Lake Riley TP TMDL, see job control parameters in figure to the right). If starting from an existing TMDL P8 model, updates/edits to job control parameters (rainfall and temperature input files, start/stop date, passes through the storm file, etc.) should be avoided. If creating a new model, guidance should be used to develop model BMP and job control inputs.
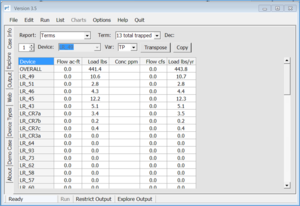
- b. Determine existing load reduction and compare to WLA. After reviewing and generating P8 model inputs, the P8 model can be run for the TMDL modeling period to determine the existing load reduction. In the case of the Lake Riley TP TMDL, the originally received P8 model which was used to develop the TMDL should be retained so that reduction values can be compared to the original TMDL P8 model. Reductions in TP loading to Lake Riley greater than original TMDL P8 model represent progress towards the target WLA load reduction (e.g., 13 lbs TP per year). An example of total sedimentation and filtration removal results l (i.e., total trapped; see here) from the TMDL P8 model is shown in the figure to the right.
Note: because TMDLs are based on loading to the impaired waterbody, an additional 13 lbs of load reduction in the watershed may not equate to 13 lbs of load reduction at the impaired waterbody. For example, if a newly incorporated infiltration basin produces 13 lbs/yr of TP reduction from its directly-contributing watershed, but is tributary to several wet pond BMPs which were included in the received TMDL P8 model, the resulting reduction in loading to Lake Riley would be less than 13 lbs/yr, as the downstream ponds reduce loading from the area directly contributing to the infiltration basin. If, however, the infiltration basin is directly contributing to Lake Riley without passing through any other BMPs originally included in the TMDL P8 model, the reduction to Lake Riley would be exactly 13 lbs/yr. For this reason, load reduction should be summarized based on total loading to the impaired waterbody, rather than at individual BMPs.
6. Review the TMDL implementation plan, Watershed Restoration and Protection Strategies report, Use Attainability Analysis (UAA) report, subwatershed assessment reports, or other relevant watershed planning documents (if applicable). The Draft Lower Minnesota River Watershed TMDLs: Part II – Northern Watersheds: Riley-Purgatory-Bluff Creek and Nine Mile Creek Watersheds (MPCA, 2018) contains an “implementation strategies” section which provides a high-level overview of structural and non-structural BMPs which can be reviewed and implemented to achieve WLA compliance, but does not provide guidance for specific TMDLs (e.g., the Lake Riley TP TMDL) or specific MS4s (e.g., Eden Prairie). However, the TMDL does reference model development and review of implementation strategies developed in the Rice Marsh Lake and Lake Riley: Use Attainability Analysis (UAA) (Barr, 2016; see table 16 in Barr report). The UAA provides a review of lake water quality, existing BMPs, and proposed BMPs that can be implemented to attain compliance with the Lake Riley TP WLA, including a detailed cost-benefit analysis (discussed further in item #7).
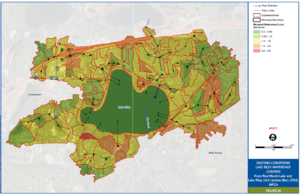
If the TMDL does not include an implementation plan or does not develop specific recommendations related to BMP implementation, results for the existing conditions P8 can be used to target areas for BMP implementation. One method of identifying and targeting areas of high pollutant loading within the modeled watershed for BMP implementation is to calculate the “watershed pollutant areal loading model wide prior to treatment (lbs/acre/year)” and “pollutant areal loading model wide after treatment (lbs/acre/year)”. Joining these results to modeled subcatchments allows the user to visualize “hot spots” of pollutant loading generated from the watershed prior to treatment and leaving modeled pipe and BMP devices after treatment. As shown in the existing conditions loading image on the left, watershed pollutant loading is correlated to land use, with more-developed portions of the watershed generating more TP loading than less-developed areas. Within Eden Prairie, the southeast portion of the watershed generates the highest TP areal loading rates, making this area a good candidate for BMP implementation.
| Proposed BMP cost-effectiveness (from Lake Riley UAA; Barr, 2016) | ||||
| Proposed structural BMPs | Modeled Load Reduction to Lake Riley from BMP (lbs/yr) | Planning Level Opinion of cost ($) | Estimated annual O&M ($) | BMP 30-Year Cost Effectiveness ($/lbs TP Removed) |
|---|---|---|---|---|
| Build new iron-enhanced sand filter basin at LR_87 | 3 | 68,700 | 550 | 1,051 |
| Build new iron-enhanced sand filter basin at LR_14 | 10 | 419,500 | 3,356 | 1,742 |
| Build new iron-enhanced sand filter basin at LR_CR7f | 27 | 133,500 | 1,068 | 203 |
| Build new iron-enhanced sand filter basins at LR_88 and LR_90 | 64 | 835,500 | 6,684 | 538 |
| Build underground spent lime treatment chamber at LR_CR7g | 4 | 394,400 | 3,155 | 3,686 |
| Build underground spent lime treatment chamber at LR_CR7h | 4 | 326,700 | 2,614 | 3,289 |
| Build new infiltration basin at LR_CR7i | 1 | 75,700 | 606 | 4,121 |
| Expand existing pond at location LR_31 and add new iron enhanced sand filter | 55 | 1,273,300 | 10,266 | 969 |
| Re-route watershed LR_CR7j's storm sewer outlet from Lake Riley to pond LR_15 | 2 | 58,200 | 466 | 1,481 |
| Modify outlet from wetland LR_6 to provide enhanced detention | 8 | 40,700 | 326 | 203 |
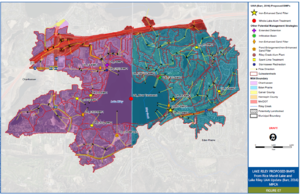
7. Utilize model to track progress towards meeting the WLA (e.g., use the model to evaluate BMPs and incorporate BMPs as they are implemented). As discussed in item #6, above, the existing conditions P8 model can be used to identify areas to target for BMP implementation, and can be updated as BMPs are constructed to track progress towards attaining WLA compliance. An example of how the existing conditions P8 model can be used to (a) evaluate proposed and newly-constructed BMP performance and (b) compare the effectiveness of proposed BMPs using a cost-effectiveness approach is presented in the Rice Marsh Lake and Lake Riley: Use Attainability Analysis (UAA) (Barr, 2016; see Table 16 in Barr report). Proposed BMPs developed in the Lake Riley UAA are shown in the figure to the leftt.
The table below shows that the most cost-effective structural BMPs evaluated with the City of Eden Prairie were the iron-enhanced sand filter basins downstream of existing ponds LR_88 and LR_90. The southeast portion of the watershed was shown to produce the highest TP areal loading rates. For this reason, many of the proposed BMPs developed for the Lake Riley UAA were targeted in this area. To evaluate this BMP alternative, the following updates were made to the existing condition TMDL P8 model.
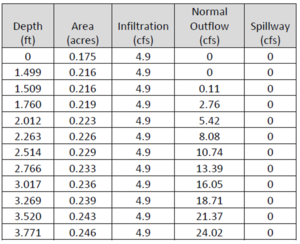
- Two new GENERAL devices were added to the model to represent the proposed iron-enhanced sand filters: LR_88-IES and LR_90-IES (example inputs for LR_90 IES shown in figure on left).
- The existing ponds LR_88 and LR_90 were updated to route to LR_88-IES and LR_90-IES, respectively.
With these updates applied, the TMDL modeling period (2014 water year, see item #3) was run and the annual removal values were calculated (see guidance). The proposed iron enhanced sand filters downstream of existing ponds LR_88 and LR_90 reduce TP loading to Lake Riley by 64 lbs/yr. Comparing to WLA target reduction values, this reduction exceeds the target reduction for Eden Prairie (13 lbs/yr) and nearly achieves the entire WLA target reduction for all MS4s (69 lbs/yr). Because the pollutant reduction far exceeds the target reduction for the City of Eden Prairie, the City could coordinate with the Riley Purgatory Bluff Creek Watershed District and other MS4s within the watershed (e.g., the City of Chanhassen) to construct and potentially cost-share construction of this project.
Related pages
- Summary of TMDL requirements in stormwater permits
- Forms, guidance, and resources for completing the TMDL annual report form
- Overview of models used to meet MS4 TMDL permit requirements
- Recommendations and guidance for utilizing P8 to meet TMDL permit requirements
- Case study for using P8 to meet TMDL permit requirements
- Recommendations and guidance for utilizing WINSLAMM to meet TMDL permit requirements
- Case study for using WINSLAMM to meet TMDL permit requirements
- Recommendations and guidance for utilizing the MIDS calculator to meet TMDL permit requirements
- MIDS calculator
- Case study for using the MIDS calculator to meet TMDL permit requirements
- Recommendations and guidance for utilizing the MPCA Simple Estimator to meet TMDL permit requirements
- MPCA Simple Estimator
- Case study for using the MPCA Simple Estimator to meet TMDL permit requirements
- Recommendations and guidance for utilizing monitoring to meet TMDL permit requirements
- Case studies for monitoring to meet TMDL permit requirements

