Recommendations and guidance for utilizing the MIDS calculator to meet TMDL permit requirements

The Minimal Impact Design Standards (MIDS) Calculator is a spreadsheet-based tool used to predict the annual pollutant removal performance of water quality best management practices (BMPs). This tool, developed by the Minnesota Pollution Control Agency (MPCA), was originally intended to assist designers and regulators evaluate compliance with MIDS performance goals The MIDS Calculator consists of a user-friendly graphical user interface (GUI) that allows users to “drag-and-drop” BMPs, assign tributary area, trace and visualize BMP routing, and quickly generate annual runoff, total suspended solids (TSS), total phosphorus (TP) loading, and removal results.
Due to the ease of use of this model, the MIDS Calculator has been used for many applications beyond its originally intended purpose, including being used by Municipal Separate Storm Sewer Systems (MS4s) as a tool to demonstrate compliance with total maximum daily load (TMDL) wasteload allocations (WLAs). Download links for the MIDS Calculator and related documentation are provided below.
Note: information provided in the following subsections does not reiterate or re-present information readily available in Model documentation files. Instead, guidance provided in this document provides engineers and planners with recommendations for development of model inputs, provides guidance for interpreting and summarizing model results, provides supplementary information not included in model documentation, and provides examples of how the MIDS Calculator can be used to demonstrate TMDL compliance.
Contents
Training and tutorials
The MIDS Calculator is a moderately complex tool. Using it likely requires some training. The following pages provide guidance and examples useful for learning the MIDS Calculator. Training workshops are periodically offered by various entities, including the MPCA.
Applicability to demonstrating WLA compliance
The MIDS Calculator is capable of predicting annual runoff, TSS and TP loading from three land cover categories (impervious area, forest/open space, and managed turf), and annual runoff and pollutant removal for a variety of BMP types. The tool is an empirical model which predicts pollutant removal based on correlation to P8 results and design-standard BMP removal rates. Because the MIDS Calculator is an empirical model which was originally developed to evaluate compliance with MIDS performance goals from individual developments, the tool is limited in its ability to evaluate
- pollutant removal through non-volume reduction BMPs in series (i.e., treatment trains) and
- bypass of runoff and pollutant from undersized BMPs.
Based on these limitations, the MIDS Calculator should be used to evaluate and demonstrate WLA compliance only for simplified study areas in which the impact of BMP treatment in series and bypass from undersized BMPs is minimal. Additionally, because the MIDS calculator reports results on an annualized basis, the tool is not capable of evaluating compliance for non-annualized WLAs (e.g., WLAs based on the growing season). In summary, the MIDS Calculator is capable of demonstrating compliance to annualized mass-based WLAs (e.g., pounds of TSS per year), concentration-based WLAs (e.g., mg/L of TSS), and areal loading based WLAs (e.g., pounds of TSS per acre per year) for both TSS and TP for simplified study areas where the impact of BMP treatment in series for non-volume reduction BMPs and bypass from undersized BMPs is considered negligible.
Special Consideration(s):
- The MIDS Calculator reports on an annualized-basis, and is therefore not suitable for evaluating WLA compliance for non-annualized WLAs.
- The MIDS Calculator is an empirical model which is limited in its ability to model pollutant removal through BMPs in series and bypass from undersized BMPs. For this reason, the MIDS Calculator should only be used to demonstrate WLA compliance for simplified study area where the impact of pollutant removal through BMPs in series and bypass from undersized, non-infiltration BMPs is considered minimal.
Model Inputs
The following subsections outline data sources and special consideration related to model inputs, model setup, and model initialization.
Note: these subsections do not represent information readily available in Model documentation, but instead highlight data sources (e.g., spatial datasets), special consideration, and important notes for engineers and planners to consider while generating model inputs.
Site information: rainfall and pollutant loading
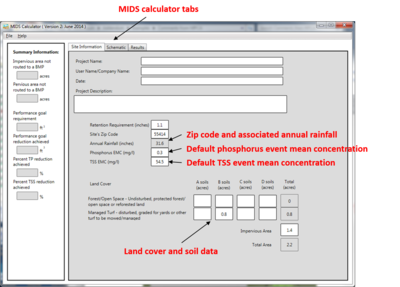
The MIDS Calculator uses a modified version of the Simple Method (Schueler, 1987; CWP & CSN, 2008) to predict runoff and associated pollutant loading. Annual rainfall (inches) is assigned via a lookup table based on the user-assigned “site zip code”. Because this tool was developed by the MPCA for use within Minnesota, only Minnesota-based zip codes exist in the rainfall lookup table (zip codes in range between 55001 and 56763).
The tool estimates TSS and TP loading based on user-defined phosphorus (TP) and TSS event mean concentration (EMC) values (mg/L). Default EMC values of 0.3 mg/L and 54.5 mg/L are assigned to TP and TSS, respectively. Comparing default EMC values to TSS and TP EMC literature values, the default TSS EMC value of 54.5 mg/L is low based on several sources for many land use types. For this reason, it is recommended that a review of literature values within the study area be conducted to assign appropriate TP and TSS EMC values. For example, if the dominant land use within an MS4 is residential, a TSS EMC value of 100-150 mg/L may be more appropriate than the default value of 54.5 mg/L.
Special Consideration(s):
- The MIDS Calculator assigns annual rainfall depth (inches) via lookup tables based on the user-assigned “site zip code”. Because the tool was designed for use in Minnesota, only Minnesota-based zip codes exist in the rainfall lookup table.
- The MIDS Calculator assigns default TSS and TP EMC values of 54.5 and 0.3 mg/L which may be low depending on the dominant land uses within the study area. For this reason, it is recommended that a review of literature values be conducted to assign appropriate TP and TSS EMC values for the land use(s) within the study area.
Site information: land cover and soil data
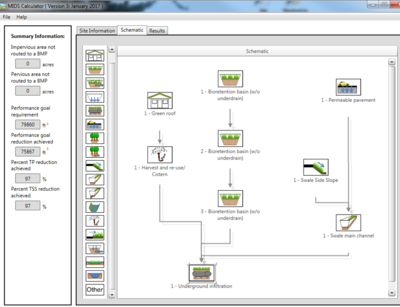
The MIDS Calculator calculates runoff and associated pollutant loading from three (3) land cover types: Forest/Open Space, Managed Turf, and Impervious Area. The total site area for each land cover type is specified in the “Site Information” tab, and portions of the total site area are then assigned to individual BMP features within the “Schematic” tab. Any area assigned in the “Site Information” tab not apportioned to a BMP in the “Schematic” tab is considered untreated. If the user assigns more area to modeled BMPs than is specified in the “Site Information” tab, an error message is displayed. A complete description of land cover types is provided in the model documentation and is summarized in the table below. Land cover should be estimated using site specific information (e.g., record drawings, parcel data, etc.), when possible. For large watershed areas where it is not feasible to develop individualized land cover estimates for all modeled subwatershed areas, it is recommended that best-available land cover and impervious area datasets be used to estimate land cover types within each subwatershed.
MIDS Calculator land cover summary
Link to this table
| Land cover | Description |
|---|---|
| Forest/open space | The undisturbed area, protected/open space or reforested land. This includes any forested or open space area protected during construction and that will remain undisturbed or will not be routinely mowed, but instead left in a natural vegetative state. |
| Managed turf |
|
| Impervious cover |
|
The “Forest/Open Space” and “Managed Turf” land use types are pervious areas. For this reason, these land cover types are additionally delineated by hydrologic soil group (HSG) type. A summary of soil texture types and corresponding Unified Soil Classification types that fall into the A, B, C, and D HSG types is shown below. If site specific information soils information is unavailable, it is recommended that the spatial NRCS Soil Survey Geographic Database (SSURGO) be used. SSURGO soils data is available for download online through the Web Soil Survey.
Design infiltration rates, in inches per hour, for A, B, C, and D soil groups. Corresponding USDA soil classification and Unified soil Classifications are included. Note that A and B soils have two infiltration rates that are a function of soil texture.*
The values shown in this table are for uncompacted soils. This table can be used as a guide to determine if a soil is compacted. For information on alleviating compacted soils, link here. If a soil is compacted, reduce the soil infiltration rate by one level (e.g. for a compacted B(SM) use the infiltration rate for a B(MH) soil).
Link to this table
| Hydrologic soil group | Infiltration rate (inches/hour) | Infiltration rate (centimeters/hour) | Soil textures | Corresponding Unified Soil ClassificationSuperscript text |
|---|---|---|---|---|
| Although a value of 1.63 inches per hour (4.14 centimeters per hour) may be used, it is Highly recommended that you conduct field infiltration tests or amend soils.b See Guidance for amending soils with rapid or high infiltration rates and Determining soil infiltration rates. |
gravel |
GW - Well-graded gravels, fine to coarse gravel GP - Poorly graded gravel |
||
| 1.63a | 4.14 |
silty gravels |
GM - Silty gravel |
|
| 0.8 | 2.03 |
sand |
SP - Poorly graded sand |
|
| 0.45 | 1.14 | silty sands | SM - Silty sand | |
| 0.3 | 0.76 | loam, silt loam | MH - Elastic silt | |
| 0.2 | 0.51 | Sandy clay loam, silts | ML - Silt | |
| 0.06 | 0.15 |
clay loam |
GC - Clayey gravel |
|
1For Unified Soil Classification, we show the basic text for each soil type. For more detailed descriptions, see the following links: The Unified Soil Classification System, CALIFORNIA DEPARTMENT OF TRANSPORTATION (CALTRANS) UNIFIED SOIL CLASSIFICATION SYSTEM
- NOTE that this table has been updated from Version 2.X of the Minnesota Stormwater Manual. The higher infiltration rate for B soils was decreased from 0.6 inches per hour to 0.45 inches per hour and a value of 0.06 is used for D soils (instead of < 0.2 in/hr).
Source: Thirty guidance manuals and many other stormwater references were reviewed to compile recommended infiltration rates. All of these sources use the following studies as the basis for their recommended infiltration rates: (1) Rawls, Brakensiek and Saxton (1982); (2) Rawls, Gimenez and Grossman (1998); (3) Bouwer and Rice (1984); and (4) Urban Hydrology for Small Watersheds (NRCS). SWWD, 2005, provides field documented data that supports the proposed infiltration rates. (view reference list)
aThis rate is consistent with the infiltration rate provided for the lower end of the Hydrologic Soil Group A soils in the Stormwater post-construction technical standards, Wisconsin Department of Natural Resources Conservation Practice Standards.
bThe infiltration rates in this table are recommended values for sizing stormwater practices based on information collected from soil borings or pits. A group of technical experts developed the table for the original Minnesota Stormwater Manual in 2005. Additional technical review resulted in an update to the table in 2011. Over the past 5 to 7 years, several government agencies revised or developed guidance for designing infiltration practices. Several states now require or strongly recommend field infiltration tests. Examples include North Carolina, New York, Georgia, and the City of Philadelphia. The states of Washington and Maine strongly recommend field testing for infiltration rates, but both states allow grain size analyses in the determination of infiltration rates. The Minnesota Stormwater Manual strongly recommends field testing for infiltration rate, but allows information from soil borings or pits to be used in determining infiltration rate. A literature review suggests the values in the design infiltration rate table are not appropriate for soils with very high infiltration rates. This includes gravels, sandy gravels, and uniformly graded sands. Infiltration rates for these geologic materials are higher than indicated in the table.
References: Clapp, R. B., and George M. Hornberger. 1978. Empirical equations for some soil hydraulic properties. Water Resources Research. 14:4:601–604; Moynihan, K., and Vasconcelos, J. 2014. SWMM Modeling of a Rural Watershed in the Lower Coastal Plains of the United States. Journal of Water Management Modeling. C372; Rawls, W.J., D. Gimenez, and R. Grossman. 1998. Use of soil texture, bulk density and slope of the water retention curve to predict saturated hydraulic conductivity Transactions of the ASAE. VOL. 41(4): 983-988; Saxton, K.E., and W. J. Rawls. 2005. Soil Water Characteristic Estimates by Texture and Organic Matter for Hydrologic Solutions. Soil Science Society of America Journal. 70:5:1569-1578.
Special Consideration(s):
- Open water area not be included in “impervious cover” or any other land cover type. The MIDS Calculator uses the conservative assumption that precipitation and evapotranspiration at the surface of these systems are neutralizing and that pollutant load additions from precipitation alone are minimal.
- Impervious Area should reflect the total site impervious area, not just the directly connected impervious area.
- Green roof and permeable pavement area should be entered as “impervious cover”. This allows the MIDS Calculator to make an accurate estimate of the runoff and pollutant removal for these BMP types.
Schematic: BMP Properties
After specifying details of the total site area in the “Site Information” tab, portions of the total site area are assigned to individual BMPs within the “Schematic” tab. This tab is the modeling space of the MIDS Calculator, where the user can “drag-and-drop” BMPs, assign tributary area to each BMP, and route flow between BMPs by connecting individual BMP features. The MIDS Calculator models runoff and pollutant reduction at BMPs based on volume-reduction processes (i.e., infiltration, filtration other than sand filter), and non-volume reduction processes (i.e., sedimentation, sand filter).
The MIDS Calculator assumes all pollutant associated with infiltrated runoff is removed. To estimate infiltration removal, the MIDS Calculator relies on lookup tables which assign a volume reduction percentage based on the ratio of BMP volume to drainage area and the user-specified soil infiltration rate. These lookup tables were developed based on iterative modeling of the BMP feature with varying soil infiltration rates in the water quality modeling program P8. Because BMP volume is required for the volume reduction lookup table, the MIDS Calculator requires user-input BMP dimensions (e.g., top area, bottom area, depth of media, etc.) for all volume-reduction BMPs.
For non-volume reduction BMPs (e.g. wet pond, sand filter with underdrain, etc.), the MIDS Calculator assigns fixed TSS, dissolved phosphorus (TDP) and particulate phosphorus (TPP) removal rates based on design-standards and published removal efficiency values for the modeled BMP type. Based on this methodology, the MIDS Calculator is not capable of modeling bypass from undersized non-volume reduction BMPs, and therefore does not require the user to input BMP dimensions for non-volume reduction BMPs. Additionally, because the MIDS Calculator assumes a fixed removal rate for non-volume reduction BMPs, the tool does not accurately account for reduced removal efficiency through BMPs in series (i.e., treatment trains) and therefore should not be used to estimate removal through non-volume reduction BMPs in series.
The following table provides a summary of removal processes, required inputs, and assumed non-volume reduction removal rates for all eighteen (18) BMPs. Additional information for each BMP type is available within the Minnesota Stormwater Manual, which can be accessed through the “HELP” button within the BMP properties box in the MIDS Calculator.
MIDS Calculator BMP summary
Link to this table
| BMP type1 | Requires input dimensions? | Volume reduction (%) | TSS reduction (%) | Total particulate phosphorus (TPP) reduction (%) | Total dissolved phosphorus (TDP) reduction |
|---|---|---|---|---|---|
| Green roof | Yes | 45 | 96 | 0 | 0 |
| Bioretention Basin (w/o underdrain) | Yes | Lookup table2 | |||
| Bioretention Basin (w/ underdrain) | Yes | Lookup table2 | 60 | 0-804 | 0-604 |
| Infiltration basin/ Infiltration Trench | Yes | Lookup table2 | |||
| Underground Infiltration | Yes | Lookup table2 | |||
| Permeable pavement | Yes | Lookup table2 | 74 | 82 | 0 |
| Tree Trench (w/o underdrain) | Yes | Lookup table2 | |||
| Tree Trench (w/ underdrain) | Yes | Lookup table2 | 68 | 0-804 | 0-604 |
| Swale Side Slope | Yes | Lookup table2 | |||
| Swale Main Channel (w/o underdrain) | Yes | Lookup table2 | 68 | 73 | 0 |
| Swale Main Channel (w/underdrain) | Yes | Lookup table2 | |||
| Wet swale | No | 68 | 0-454 | 0-604 | |
| Harvest and Re-Use Cistern | Yes | Calculated3 | |||
| Imperviousness Disconnection | Yes | Lookup table2 | 68 | 0 | 0 |
| Sand Filter (Not-Enhanced) | No | 85 | 85 | 0 | |
| Sand Filter (Enhanced) | No | 85 | 85 | 40 | |
| Constructed Wetland | No | 68 | 55 | 0 | |
| Stormwater Pond (Level 1) | No | 60 | 62 | 0 | |
| Stormwater Pond (Level 2) | No | 84 | 84 | 8 | |
| Stormwater Pond (Level 3) | No | 90 | 90 | 23 | |
| Other | No | User-defined | |||
1Based on Version 3.0 of the MIDS Calculator
2 "Lookup Table" indicates removal calculated from MIDS P8 modeling lookup tables.
3 “Calculated" indicates volume reduction is calculated based on user inputs for cistern reuse / irrigation scheduling.
4 TPP and TPD reduction variable based on design input parameters.
Special Consideration(s):
- The MIDS Calculator is not capable of modeling by-pass from non-volume reduction BMPs.
- The MIDS Calculator is does not accurately model pollutant removal through non-volume reduction BMPs in series.
Model Outputs
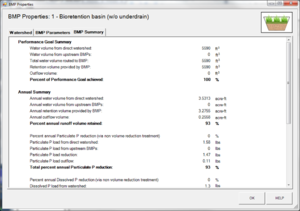
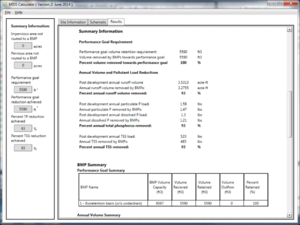
The MIDS Calculator provides annual pollutant loading and removal summaries for individual BMPs and on a model-wide basis. Loading and removal results for individual BMPs can be accessed through the “BMP Summary” tab of the BMP Properties window, and model-wide summary of loading and BMP performance can be accessed through the “Results” tab of the main MIDS Calculator display window. The following subsections provide guidance on how to interpret and QAQC model outputs.
Interpreting Model Results and Calculating WLA Reporting Terms
The following table provides a summary of how to generate common TSS and TP WLA reporting terms. The MIDS Calculator reports annualized results, and therefore cannot be used to evaluate compliance with non-annualized WLAs (e.g., WLAs based on the growing season)
Using the MIDS Calculator to generate load reduction and WLA reporting terms
Link to this table
| Reporting term | Individual BMPs (BMP Properties --> BMP Summary) | Model-Wide Summary ("Results" Tab) | |
|---|---|---|---|
| Pollutant Loading: TSS, TPP, and TDP1 | |||
| Inflow Loading (lbs) | "Annual [Pollutant] from direct watershed" & "upstream BMPs" | "Post development annual [Pollutant] load"; (A) | |
| Pollutant Removal (lbs) | "[Pollutant] load reduction" | "Annual [Pollutant] removed by BMPs"; (B) | |
| Outflow Loading* (lbs) | "[Pollutant] load outflow" | (A) - (B) | |
| Outflow Loading (ppm; mg/L) | "Annual Outflow Volume" | ["Post dev. annual runoff volume"] - ["Annual runoff volume removed by BMPs"] | |
| Outflow* (acre-feet) | [Outflow Loading*] / [Outflow*] x [CF2] | ||
| Watershed and Areal Loading Calculations | |||
| Contributing Watershed Area* (acres) | See "Watershed" tab of BMP and all upstream BMPs | See "Total Site Area" summary | |
| Watershed pollutant areal loading (pre-treatment) (lbs/acre/year) | [Watershed Loading*] / [Contributing Watershed Area*] | ||
| Outflow pollutant areal loading (post-treatment) (lbs/acre/year) | [Outflow Loading*] / [Contributing Watershed Area*] | ||
TSS=total suspended solids; TPP=total particulate phosphorus; TDP=total dissolved phosphorus
2CF = Conversion factor to convert to ppm; mg/L units = 0.367733624
QAQC of Model Results
The engineer or designer should perform a thorough review of all model inputs and outputs. Model inputs should be generated using best available datasets, including record drawings, development data, bathymetric surveys, and best-available spatial land use, land cover, and soil databases. Upon model completion, results should be reviewed to ensure BMPs were routed correctly, subwatersheds were routed correctly, and that pollutant removal and areal loading results are within typical ranges based on BMP and land use type, respectively. A general model result QAQC list and description of P8 outputs to review is provided in in the table below. Additionally, a literature review of typical average annual event mean concentration (EMC) values is provided here, and typical TSS and TP removal values for various BMP types is provided here.
General MIDS Calculator result QAQC list
Link to this table
| QAQC / Review Item | Related MIDS Calculator Output |
|---|---|
| Review device routing | Review routing in "Schematic" window |
| Confirm area routed to individual BMPs is correct | BMP Properties --> Watershed |
| Confirm total watershed area is correct | Review "Site Information" window |
| Confirm annual precipitation total is correct | Review zip code in "Site Information" window |
| Review watershed pollutant concentrations | Compare watershed areal loading to literature values |
| Review TSS/TP removal rates | Compare pollutant removal values to literature values |
| Confirm no routing between non-volume reduction BMPs | Removal estimates for non-volume reduction BMPs in series are incorrect. For this reason, routing between non-volume reduction BMPs should be disconnected |
| Review BMP sizing recommendations and review contributing watershed area | Bypass from undersized BMPs is not calculated for non-volume reduction BMPs. For this reason, only the area for which the BMP is correctly-sized should be modeled to the BMP (the remainder should be modeled as untreated) |
Related pages
- Summary of TMDL requirements in stormwater permits
- Forms, guidance, and resources for completing the TMDL annual report form
- Overview of models used to meet MS4 TMDL permit requirements
- Recommendations and guidance for utilizing P8 to meet TMDL permit requirements
- Case study for using P8 to meet TMDL permit requirements
- Recommendations and guidance for utilizing WINSLAMM to meet TMDL permit requirements
- Case study for using WINSLAMM to meet TMDL permit requirements
- Recommendations and guidance for utilizing the MIDS calculator to meet TMDL permit requirements
- MIDS calculator
- Case study for using the MIDS calculator to meet TMDL permit requirements
- Recommendations and guidance for utilizing the MPCA Simple Estimator to meet TMDL permit requirements
- MPCA Simple Estimator
- Case study for using the MPCA Simple Estimator to meet TMDL permit requirements
- Recommendations and guidance for utilizing monitoring to meet TMDL permit requirements
- Case studies for monitoring to meet TMDL permit requirements
This page was last edited on 14 February 2023, at 19:42.


