Difference between revisions of "Soil hydrologic properties and processes"
m () |
|||
| (2 intermediate revisions by the same user not shown) | |||
| Line 1: | Line 1: | ||
| − | |||
| − | |||
| − | |||
[[File:Technical information page image.png|100px|right|alt=image]] | [[File:Technical information page image.png|100px|right|alt=image]] | ||
| Line 51: | Line 48: | ||
'''Suggested reading''' | '''Suggested reading''' | ||
| − | *[ | + | *[http://swcst.or.th/Report/cooperative/Soil%20Survey%20Technical%20Notes/note6.html Saturated Hydraulic Conductivity: Water Movement Concepts] - USDA, NRCS |
| − | *[https://www.nrcs.usda.gov/ | + | *[https://www.nrcs.usda.gov/sites/default/files/2022-10/Infiltration.pdf Soil infiltration] - USDA, NRCS |
===Saturated hydraulic conductivity=== | ===Saturated hydraulic conductivity=== | ||
| Line 104: | Line 101: | ||
**[https://extension.umn.edu/soil-management-and-health/soil-orders-and-suborders-minnesota Soil orders and suborders in Minnesota] | **[https://extension.umn.edu/soil-management-and-health/soil-orders-and-suborders-minnesota Soil orders and suborders in Minnesota] | ||
**[https://www.maswcd.org/SWCDs_On_The_Web/swcds_on_the_web.htm Minnesota SWCDs on the web] | **[https://www.maswcd.org/SWCDs_On_The_Web/swcds_on_the_web.htm Minnesota SWCDs on the web] | ||
| + | |||
| + | [[Category:Level 2 - Technical and specific topic information/soils and media]] | ||
Latest revision as of 17:59, 30 January 2023
Soil hydrologic (hydraulic) properties include infiltration and water retention. These properties significantly affect plant growth, pollutant transport, and subsurface water transport (e.g. groundwater recharge).
Contents
Soil water and water retention

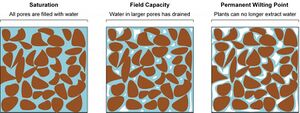
Soil properties related to water content and water retention are critical to plant establishment and growth. Understanding some basic terms related to soil water is important for understanding water storage and transport. These terms are illustrated in the adjacent schematic.
- Soil water (moisture) content can be expressed on a mass or volume basis. This video describes the two measurements and how they are related.
- Gravimetric water content: the ratio of the mass of water held in the soil to the dry soil.
- Volumetric water content: the ratio of the volume of water to the unit volume of soil. Volumetric water content can be expressed as a ratio (e.g. cm3/cm3), percentage (e.g. 50% of the soil volume), or depth of water per depth of soil (e.g. centimeters per meter of soil).
- Example: assume a wet soil weighs 50 grams, a dry soil 40 grams, and soil bulk density is 1.3. Gravimetric water content is ((0.5-0.40)/0.40) = 0.10/0.40 = 0.25 g/g. To derive volumetric water content, multiply the gravimetric water content by the bulk density and divide by density of water (1.0 g/cm3). Volumetric water content is therefore 0.25*1.3/1.0 = 0.325 cm3/cm3, or 32.5%.
- Water holding capacity: the total amount of water a soil can hold at field capacity.
- Field capacity: the amount of soil moisture or water content held in the soil after excess water has drained away and the rate of downward movement has decreased. Physically it is the water content retained in soil at −33 kPa (or −0.33 bar) of hydraulic head or suction pressure.
- Wilting point: the volumetric water content in the soil is too low for the plant's roots to extract water. When the water content of a soil is below the permanent wilting point, water is still present in the soil, but plant roots are unable to access it. Physically, it is the water content at −1,500 kPa (−15 bar) of suction pressure.
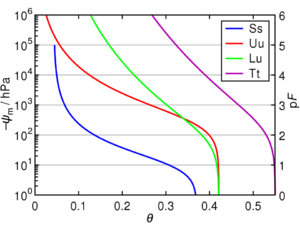
- Moisture retention curve: the relationship between the water content (θ), and the soil water potential (ψ), typically expressed as a curve. The curve is characteristic for different types of soil and is therefore also called the soil moisture characteristic.
Water infiltrates a dry soil through both gravitational forces and suction forces exerted by soil materials. Water is held in soil by suction forces exerted by materials such as clay. Water not held under suction drains freely due to gravitational forces. The time for a soil to drain due to gravity varies depending on soil texture and structure. Sands drain more quickly than clays because of more direct, well-connected drainage pathways. A soil's field capacity, or the amount of water remaining after gravity drainage, varies with soil and is not a exact value. Typical field capacity for sandy soils is 0.10-0.15 cm3/cm3 and for clays is about 0.3 cm3/cm3. Water subject to gravity drainage is available to plants, but because drainage occurs rapidly in most soils (less than 48 hours), it is generally not an important source of water to plants. Below field capacity, plant roots must exert force to extract water held to soil. As a soil dries, the amount of suction required increases until a plant can no longer extract water, typically at about-15 bars. This is called the wilting point. Water between the wilting point and field capacity is plant available water. Typical plant available water is about 0.10 cm3/cm3 for sand and clay and about 0.15-0.20 for loams. The lower values for sand is due to low water content of the soil, while the low value for clays is due to clays tightly holding water.
Water content can be measured in the lab or in the field. For point-in-time measurements, lab methods are satisfactory, being easy to take and inexpensive. Continuous measurements of soil water content require in-field methods that are often expensive and sometimes subject to inaccuracies. For information on sampling for water content, link here.
For more reading
- Soil water status: content and potential
- Understanding Soil Water Content and Thresholds for Irrigation Management
- Water content
- Soil and water
Soil infiltration

Soil infiltration refers to a soil's ability to allow water movement into and through the soil profile. Infiltration is important to movement of solutes, including pollutants, and to recharge of groundwater. Some basic terms include the following.
- Infiltration rate: a measure of how fast water enters the soil, typically expressed in inches or centimeters per hour. Although infiltration rates are often provided for different soils, the infiltration rate varies with soil water content, the rate of water application, and soil physical properties such as extent of macroporosity. Infiltration rate values provided in the literature typically represent infiltration rates under saturated soil conditions.
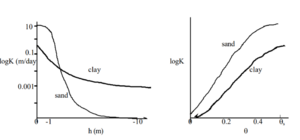
- Hydraulic conductivity: a measure of how easily water can pass through soil or rock. High values indicate permeable material through which water can pass easily, while low values indicate material that is less permeable. Conductivity varies between different soils and with water content of a soil.
- Saturated hydraulic conductivity: the amount of water that would move vertically through a unit area of saturated soil in unit time under unit hydraulic gradient. Considering water as the fluid, it is a constant for a given soil.
- Permeability: permeability has different meanings. While it often is used to describe the ease with water passes through a soil, in geophysical applications it is a quantitative property controlled solely by pore geometry. This is often called intrinsic permeability and it is independent of fluid viscosity and density.
- Preferential flow/macropore flow: the process of rapid infiltration that occurs in large pores (>75 microns) under the influence of gravity. Macropores make up a small percent of total soil pore space and flow in macropores occurs under saturated conditions, though this includes locally saturated areas within the soil micro-landscape.
In stormwater applications, the supply of water usually exceeds the infiltration capacity of the soil, resulting in ponding. Flow of water and solutes under ponded conditions differs from processes occurring under unsaturated conditions.
- A distinct wetting front forms in the soil. As the wetting front proceeds downward, the soil becomes saturated and the hydraulic conductivity decreases, eventually reaching equilibrium (i.e. saturated hydraulic conductivity).
- Soil macropores will be active in water and solute transport for most stormwater applications. Solutes present in infiltrating water therefore have the potential to be rapidly transported deep into the soil profile.
- As the wetting front proceeds, solutes present in infiltrating water may interact with soil particles, but this interaction is typically less than infiltration under unsaturated conditions. Conversely, soil-bound chemicals have greater potential to interact with infiltrating water under saturated conditions.
Because of these factors, accurately determining soil saturated hydraulic conductivity is important in predicting the performance of a stormwater practice and predicting the fate of solutes, including pollutants. Saturated conductivity is thus discussed separately below.
Suggested reading
- Saturated Hydraulic Conductivity: Water Movement Concepts - USDA, NRCS
- Soil infiltration - USDA, NRCS
Saturated hydraulic conductivity
The terms infiltration rate and hydraulic conductivity are sometimes used interchangeably, but this is incorrect. For stormwater applications, where the rate of water delivery to a stormwater practice usually exceeds the infiltration rate of the soil, saturated hydraulic conductivity (Ksat) is the property of greatest interest. Saturated hydraulic conductivity is a constant for a specific soil in a specific location. It is affected by soil texture (pore size distribution), structure, and pore characteristics (e.g. pore connectivity). These in turn can be affected by human activity at a site, such as soil compaction, tillage, and addition of amendments.
Ksat varies considerably over relatively short distances, even within an area having a single mapped soil unit. It is not uncommon for Ksat to vary by up to three orders of magnitude at a single development site ([1], [2], [3], [4], [5]). Deb and Schukla (2012, free access) provide a nice discussion of saturated hydraulic conductivity.
Ksat should be measured directly in the field, preferably with either a permeameter or double ring infiltrometer. However, it is more commonly estimated from soil borings taken in the field. Soil texture is determined from borings and Ksat, or infiltration rate, is determined from the adjacent table. If borings are used to determine Ksat at a site, it is important to take collect an appropriate number of borings and to follow proper sampling procedures. Sampling procedures are described on this page. Methods for determining soil infiltration rate in the field are described on this page.
Design infiltration rates, in inches per hour, for A, B, C, and D soil groups. Corresponding USDA soil classification and Unified soil Classifications are included. Note that A and B soils have two infiltration rates that are a function of soil texture.*
The values shown in this table are for uncompacted soils. This table can be used as a guide to determine if a soil is compacted. For information on alleviating compacted soils, link here. If a soil is compacted, reduce the soil infiltration rate by one level (e.g. for a compacted B(SM) use the infiltration rate for a B(MH) soil).
Link to this table
| Hydrologic soil group | Infiltration rate (inches/hour) | Infiltration rate (centimeters/hour) | Soil textures | Corresponding Unified Soil ClassificationSuperscript text |
|---|---|---|---|---|
| Although a value of 1.63 inches per hour (4.14 centimeters per hour) may be used, it is Highly recommended that you conduct field infiltration tests or amend soils.b See Guidance for amending soils with rapid or high infiltration rates and Determining soil infiltration rates. |
gravel |
GW - Well-graded gravels, fine to coarse gravel GP - Poorly graded gravel |
||
| 1.63a | 4.14 |
silty gravels |
GM - Silty gravel |
|
| 0.8 | 2.03 |
sand |
SP - Poorly graded sand |
|
| 0.45 | 1.14 | silty sands | SM - Silty sand | |
| 0.3 | 0.76 | loam, silt loam | MH - Elastic silt | |
| 0.2 | 0.51 | Sandy clay loam, silts | ML - Silt | |
| 0.06 | 0.15 |
clay loam |
GC - Clayey gravel |
|
1For Unified Soil Classification, we show the basic text for each soil type. For more detailed descriptions, see the following links: The Unified Soil Classification System, CALIFORNIA DEPARTMENT OF TRANSPORTATION (CALTRANS) UNIFIED SOIL CLASSIFICATION SYSTEM
- NOTE that this table has been updated from Version 2.X of the Minnesota Stormwater Manual. The higher infiltration rate for B soils was decreased from 0.6 inches per hour to 0.45 inches per hour and a value of 0.06 is used for D soils (instead of < 0.2 in/hr).
Source: Thirty guidance manuals and many other stormwater references were reviewed to compile recommended infiltration rates. All of these sources use the following studies as the basis for their recommended infiltration rates: (1) Rawls, Brakensiek and Saxton (1982); (2) Rawls, Gimenez and Grossman (1998); (3) Bouwer and Rice (1984); and (4) Urban Hydrology for Small Watersheds (NRCS). SWWD, 2005, provides field documented data that supports the proposed infiltration rates. (view reference list)
aThis rate is consistent with the infiltration rate provided for the lower end of the Hydrologic Soil Group A soils in the Stormwater post-construction technical standards, Wisconsin Department of Natural Resources Conservation Practice Standards.
bThe infiltration rates in this table are recommended values for sizing stormwater practices based on information collected from soil borings or pits. A group of technical experts developed the table for the original Minnesota Stormwater Manual in 2005. Additional technical review resulted in an update to the table in 2011. Over the past 5 to 7 years, several government agencies revised or developed guidance for designing infiltration practices. Several states now require or strongly recommend field infiltration tests. Examples include North Carolina, New York, Georgia, and the City of Philadelphia. The states of Washington and Maine strongly recommend field testing for infiltration rates, but both states allow grain size analyses in the determination of infiltration rates. The Minnesota Stormwater Manual strongly recommends field testing for infiltration rate, but allows information from soil borings or pits to be used in determining infiltration rate. A literature review suggests the values in the design infiltration rate table are not appropriate for soils with very high infiltration rates. This includes gravels, sandy gravels, and uniformly graded sands. Infiltration rates for these geologic materials are higher than indicated in the table.
References: Clapp, R. B., and George M. Hornberger. 1978. Empirical equations for some soil hydraulic properties. Water Resources Research. 14:4:601–604; Moynihan, K., and Vasconcelos, J. 2014. SWMM Modeling of a Rural Watershed in the Lower Coastal Plains of the United States. Journal of Water Management Modeling. C372; Rawls, W.J., D. Gimenez, and R. Grossman. 1998. Use of soil texture, bulk density and slope of the water retention curve to predict saturated hydraulic conductivity Transactions of the ASAE. VOL. 41(4): 983-988; Saxton, K.E., and W. J. Rawls. 2005. Soil Water Characteristic Estimates by Texture and Organic Matter for Hydrologic Solutions. Soil Science Society of America Journal. 70:5:1569-1578.
Recommended number of soil borings, pits or permeameter tests for bioretention design. Designers select one of these methods.
Link to this table
| Surface area of stormwater control measure (BMP)(ft2) | Borings | Pits | Permeameter tests |
|---|---|---|---|
| < 1000 | 1 | 1 | 5 |
| 1000 to 5000 | 2 | 2 | 10 |
| 5000 to 10000 | 3 | 3 | 15 |
| >10000 | 41 | 41 | 202 |
1an additional soil boring or pit should be completed for each additional 2,500 ft2 above 12,500 ft2
2an additional five permeameter tests should be completed for each additional 5,000 ft2 above 15,000 ft2
Preferential (macropore) pore flow in soil
Preferential flow, often called short-circuiting, is the rapid movement of water and associated solutes in large soil pores. Macropores are often defined as pores greater than 75 microns in diameter. It most commonly occurs under saturated water conditions but may occur in unsaturated soils associated with soil hydrophobicity that develops under extremely dry settings and on clay-rich textures. For stormwater applications, macropore flow occurs primarily under saturated conditions since the rate of water delivery to a soil typically exceeds the soil infiltration rate, resulting in ponding. However, soil microrelief can lead to locally saturated areas within a soil, initiating macropore flow in those areas ([6], [7], [8], [9]).
In soils with significant macroporosity, a high percentage of annual water and solute movement can occur within the macropores. This can lead to rapid movement of solutes, including pollutants of concern, deep into the soil profile and eventually into groundwater ([10], [11], [12], [13]). Beven and Germann (2013) and Zhang et al. (2018) provide discussion of preferential flow in soil, including extensive reviews of the literature.
The role of preferential flow in bioretention practices has only recently been studied ([14], [15], [16], [17], [18]). Mechanisms of macropore development in bioretention systems are not yet understood.
Related pages
- Overview and role of soil in stormwater management
- Soil classification
- Soil properties and processes
- Managing soils
- Soil measurements and methods
- Tabled values
- Soil resources and maps
This page was last edited on 30 January 2023, at 17:59.

