Case studies for monitoring to meet TMDL permit requirements
This page provides case studies for monitoring to determine compliance with total maximum daily load (TMDL) requirements. Examples include the following:
- lake monitoring;
- stream monitoring;
- stormwater outfall monitoring; and
- stormwater best management practice (BMP) monitoring.
For monitoring guidance, see Recommendations and guidance for utilizing monitoring to meet TMDL permit requirements.
Contents
Lake Monitoring Case Study: Wirth Lake
The Wirth Lake Excess Nutrients TMDL Report (MPCA, 2010) was approved in 2010 after Wirth Lake was originally listed for excess nutrient (phosphorus) impairment. Wirth Lake is a 38-acre lake with a maximum depth of 26 feet. All known phosphorus sources to Wirth Lake were considered in the development of the TMDL and the Wirth Lake Final TMDL Implementation Plan. These sources include:
- stormwater runoff from MS4s,
- permitted point sources other than MS4s,
- backflow from Bassett Creek during flood periods,
- atmospheric deposition, and
- internal phosphorus loading.
Stormwater from approximately 77 percent of the Wirth Lake watershed currently drains through some form of wet detention (e.g. wet pond) before it enters Wirth Lake. A significant untreated source of phosphorus to Wirth Lake occurs when flood flows in Bassett Creek backflow to Wirth Lake. Other sources include runoff from highway right-of-ways and sediment release of phosphorus (i.e., internal phosphorus loading).
| Comparison of historical and 10-year (1999-2008) water quality data to applicable water quality standards (MPCA, 2010) | |||
| Water quality parameter | MPCA deep lake eutrophication standards (NCHF Ecoregion) | Wirth Lake historical (1992-2008) growing season average | Wirth Lake 10-year (1999-2008) growing season average |
|---|---|---|---|
| Total phosphorus (ug/L) | < 40 | 55 | 41 |
| Chlorophyll a (ug/L) | <14 | 22 | 18 |
| Secchi disk (m) | < 1.4 | 1.8 | 2.0 |
A watershed P8 model, calculated Bassett Creek backflow phosphorus loads, and observed lake water quality data were used to calibrate the Wirth Lake BATHTUB model to average observed total phosphorus concentration during the 2005-2006 water year. The BATHTUB model calibrated to observed total phosphorus concentration (TP) was used to determine the best models for predicting the observed chlorophyll-a concentration and Secchi disc transparency (SD). The calibrated BATHTUB model was then validated for the 2006-2007 water year (i.e., results generated using the calibrated BATHTUB model were compared to in-lake water quality observations).
The adjoining table compares in-lake water quality observations to BATHTUB model results for the calibration and validation time periods. The calibrated BATHTUB model was then used to predict how the lake water quality would change if the Wirth Lake outlet were configured to completely prevent backflow from Bassett Creek. This improvement option would decrease in-lake TP concentration for the 2005-2006 water year from 46 to 38 μg/L and both TP and SD would meet the eutrophication criteria for Wirth Lake.
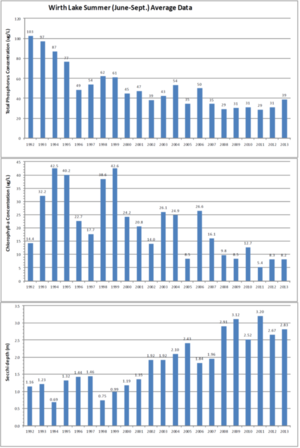
In 2012, a new lake outlet structure was installed to prevent backflow events from Basset Creek from deteriorating Wirth Lake’s water quality. In 2013, the 10-year average of the most recent water quality data (2003-2012) indicated that Wirth Lake met the MPCA deep lake standards for TP and SD. The 10-year average chl-a concentration for Wirth Lake was 14.7 µg/L, which was within 1 µg/L of the 14 µg/L chl-a criteria. If water quality monitoring data from 2013 is considered, the 10-year (2004-2013) average chl-a concentration for Wirth Lake becomes 12.9 µg/L, while the 10-year average TP (32.5 µg/L) and SD (2.56 m) are both significantly better than the respective listing criteria. Additionally, historic water quality data trend analysis indicated that, over the entire water quality monitoring data period (1992-2013), there have been significant improvements for all three water quality criteria at the 95 percent confidence level. The same is true for the trend analysis of the more recent data (2003-2012). Based on this evidence, Wirth Lake was delisted for lake eutrophication/excess phosphorus in 2014 and the tributary MS4s are no longer required to develop a compliance schedule or address this impairment in annual reporting. Wirth Lake average TP concentrations, chl-a concentrations, and SD depths for the period of 1992-2013 are shown in the adjoining figure.
Stream Monitoring Case Study: Nine Mile Creek
Nine Mile Creek was placed on MPCA’s 303(d) list of Impaired Waters in 2002 after it was determined that 32.5% of the lab turbidity data from the Metropolitan Council Environmental Services (MCES) Watershed Outlet Monitoring Program (WOMP) monitoring location exceeded the 25 NTU turbidity standard, which has since been replaced by ecoregion-based TSS standards. TSS standards for each use classification may be exceeded no more than ten percent of the time, which is the same frequency that had been specified for the turbidity standard.
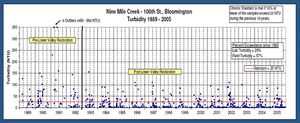
Following the 2005 monitoring season, an evaluation of the turbidity data (see adjoining figure) indicated that Nine Mile Creek turbidity levels had dropped significantly since the Lower Valley Restoration Project implementation during the winter of 1992/1993.
In 2007, the Nine Mile Creek Watershed District (NMCWD) submitted multi-site turbidity monitoring data and watershed analysis to MPCA for consideration in delisting Nine Mile Creek for turbidity. Continuous probe data from three upstream sites showed that the turbidity standard was exceeded less than 10 percent of the time. However, lab turbidity data from the MCES WOMP monitoring location indicated that the turbidity standard was still exceeded in 26 percent of samples.
Because the MCES WOMP monitoring station is biased to higher flows, Barr Engineering Co. (Barr) completed an analysis of collected monitoring data and developed a relationship between flow and lab turbidity. This relationship was applied to all MCES flow records collected between 1993 and 2005, and demonstrated that the standard would have been exceeded less than 9 percent of the time at the MCES WOMP monitoring station. Based on this analysis, the MPCA developed a future plan to reevaluate impairment status based on continuous turbidity probe data NMCWD collected at the WOMP monitoring station.
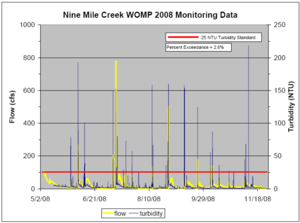
A regression relationship was used to translate continuous turbidity measurements collected in 2008 using the DTS-12 (continuous) probe into NTU units for direct comparison to the 25 NTU turbidity standard. The resulting turbidity estimates were plotted along with observed stream flow rates and showed that the turbidity standard would have been exceeded less than 3 percent of the time during 2008.
Because 2008 was a dry year, Barr compared the flow duration characteristics from 2008 to the longer-term dataset (1993-2005) from the Nine Mile Creek WOMP site. This analysis confirmed that considerably lower flows occurred during 2008 compared to the period of 1993-2005. By applying the identified turbidity-flow rate relationship to the long-term (1995-2003) flow dataset, Barr’s analysis confirmed that the 25 NTU standard would be met more than 90% of the time and approach 95% compliance. In 2010, Nine Mile Creek was delisted for turbidity/TSS impairment.
Case Study: Outfall Monitoring
| Full water quality station 2015 summary (CRWD, 2015) | ||
| Full water quality station | Subwatershed Area (ac) | TSS Annual Yield (lbs/ac/year) |
|---|---|---|
| East Kittsondale | 1,116 | 342 |
| Hidden Falls | 167 | 419 |
| Phalen Creek | 1,433 | 355 |
| St. Anthony Park | 3,418 | 125 |
| Trout Brook-East Branch | 932 | 139 |
| Trout Brook-West Branch | 2,379 | 1,059 |
| Trout Brook Outlet | 5,028 | 536 |
| Villa Park Outlet | 753 | 16 |
| Como 3 | 517 | 76 |
| Como 7 | 793 | 28 |
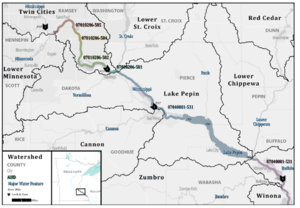
The South Metro Mississippi River TSS TMDL report (MPCA, 2015) was approved in 2016 to address aquatic life impairment related to excess turbidity (TSS). The report established TSS TMDLs for five stream reaches in the South Metro – Mississippi River (South Metro) watershed, extending from River Mile 844 (the confluence with the Minnesota River), to River Mile 780 (downstream of the confluence with the Rush River, Wisconsin) as shown in the adjoining figure. All known sources of TSS loading were considered in the development of the TMDL and general implementation strategy. These sources include
- stormwater runoff from MS4s,
- permitted point sources other than MS4s (e.g., wastewater treatment facilities),
- agricultural sources,
- internal loading (i.e., resuspension of sediments),
- streambank erosion, and
- natural background loading.
A large number of MS4s exist within the area tributary to the impaired reaches. For this reason, rather than develop individual WLAs for each MS4, the TMDL establishes a categorical wasteload allocation ( WLA) of 154 lbs/acre/year for all MS4s within the impaired watershed.
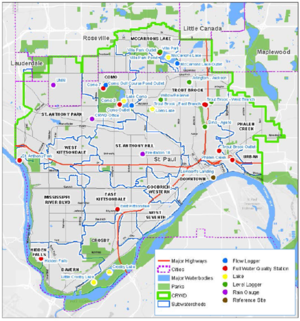
One method of evaluating compliance with the categorical TSS areal loading rate WLA established in the TMDL (i.e., 154 lbs/acre/year) is to monitor major outfalls that discharge to the Mississippi River within the South Metro watershed. An example of how outlet monitoring can be used to evaluate compliance with an areal loading rate WLA is provided in the CRWD 2015 Stormwater Monitoring Report (CRWD, 2015). The CRWD 2015 Stormwater Monitoring Report (CRWD, 2015) provides a detailed description of monitoring operations (e.g., period of operation, operation of automated ISCO samplers, area-velocity sensors used to monitor flow, etc.), sampling and laboratory analysis (e.g., delivery of sample for laboratory analysis, QAQC procedures, etc.) and total discharge and pollutant load calculations (e.g., baseflow partitioning analysis, calculation of event load and baseload, flow-weighted average concentration calculations, and pollutant yield (lbs/acre), etc.). Additionally, the document provides a detailed summary of outfall monitoring efforts conducted throughout 2015. Full water quality stations (i.e., automated sampling stations collecting flow and water quality data) were installed at ten (10) locations listed below and are shown in the adjoining figure.
- East Kittsondale
- Hidden Falls
- Phalen Creek
- St. Anthony Park
- Trout Brook-East Branch
- Trout Brook-West Branch
- Trout Brook Outlet
- Villa Park Outlet
- Como 3
- Como 7
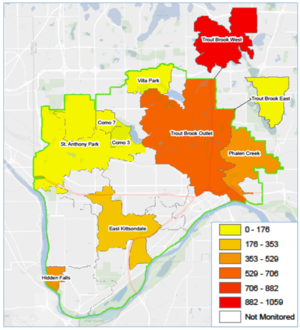
Using 2015 monitoring data collected at the ten (10) full water quality monitoring stations and flow and loading calculation procedures outlined in the report (CRWD, 2015), CRWD developed summary pollutant loading tables for the watershed district, including the TSS areal loading (lbs/acre/year) calculated at each station (see Table 5.1, of the CRWD 2015 Stormwater Monitoring Report; CRWD, 2015). The adjoining table summarizes data collected at the ten (10) full water quality monitoring stations presented in the monitoring report. Five (5) of the 10 full water quality monitoring stations are meeting the categorical TSS areal loading rate WLA established in the South Metro Mississippi River TSS TMDL report (MPCA, 2015) (i.e., 154 lbs/acre/year). The adjoining figure provides a spatial summary of monitored TSS areal loading rate throughout the CRWD. Results presented are a valuable watershed management tool and can be used to identify and prioritize individual watersheds and drainage areas for BMP implementation.
Case Study: BMP Monitoring
The Sweeney Lake Total Phosphorus TMDL (SEH and Barr Engineering Company, 2011) was approved in 2011 after the lake was originally listed for excess nutrient (phosphorus) impairment. The Sweeney Lake TMDL allocations called for a watershed phosphorus load reduction of 99 pounds from June 1 through September 31 each year. Since there is limited space available for additional stormwater treatment, TMDL implementation strategies were primarily targeted to improve the performance of existing BMPs to contribute to the watershed phosphorus reduction goal. One option in the report was modification of a pond to improve phosphorus removal performance because it is the last pond in the largest drainage area tributary to Sweeney Lake.
The Bassett Creek Watershed Management Organization initiated the development of a Feasibility Report (Barr Engineering Company, 2012) to determine if and what kind of pond modification could enhance phosphorus removal, the cost and permitting requirements of potential modifications, and identify the most cost-effective modification to the pond to partially or fully meet the applicable external phosphorus loading reduction requirements. Design alternatives provided in the feasibility report were based on the average flow conditions used for TMDL development, but it was suspected that high flows may affect performance through scouring or short-circuiting of flow through the pond.
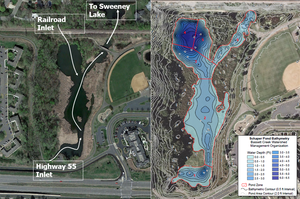
Auto samplers, level sensors, and area velocity meters were installed at the pond outlet, southern inlet (called Highway 55 inlet in the feasibility report), and northern inlet (called Rail Road inlet in the report) to evaluate the pond’s phosphorus removal performance and develop a model to evaluate how removal could be enhanced by pond modifications. Samples were collected simultaneously at both inlets and the outlet for several storm events. For all events, samples were analyzed for total phosphorus, total dissolved phosphorus, total suspended solids, and volatile suspended solids. Flow was measured continually during the summer. It cost approximately $40,000 to complete the monitoring (including field sampling and laboratory analytical work) for this study.
The monitoring determined that the Rail Road (north) inlet provided approximately 10 percent of the flow, while the Highway 55 (south) inlet contributed 90 percent of the storm event flow (and approximate TP load) to the pond. However, the pond is configured such that 65 percent of its total volume is located at the Rail Road (north) inlet (see adjoining figure).
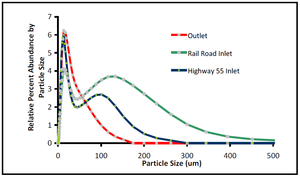
Another important monitoring finding was that particulate phosphorus (based on difference between total phosphorus and soluble phosphorus concentrations) accounts for the majority to total phosphorus loading to the pond. Collected particle settling data (adjoining figure) shows that particles entering the pond are large and settleable. Particles currently being removed by the pond are greater than 150 µm in diameter, hence, any additional performance improvements will need to be achieved by removing smaller particles (i.e., particles less than 150 µm in diameter). Because most of the phosphorus is bound to particles (particulate phosphorus = total phosphorus – total dissolved phosphorus), improved phosphorus removal could result from improved particle settling conditions in the pond.
Related pages
- Summary of TMDL requirements in stormwater permits
- Forms, guidance, and resources for completing the TMDL annual report form
- Overview of models used to meet MS4 TMDL permit requirements
- Recommendations and guidance for utilizing P8 to meet TMDL permit requirements
- Case study for using P8 to meet TMDL permit requirements
- Recommendations and guidance for utilizing WINSLAMM to meet TMDL permit requirements
- Case study for using WINSLAMM to meet TMDL permit requirements
- Recommendations and guidance for utilizing the MIDS calculator to meet TMDL permit requirements
- MIDS calculator
- Case study for using the MIDS calculator to meet TMDL permit requirements
- Recommendations and guidance for utilizing the MPCA Simple Estimator to meet TMDL permit requirements
- MPCA Simple Estimator
- Case study for using the MPCA Simple Estimator to meet TMDL permit requirements
- Recommendations and guidance for utilizing monitoring to meet TMDL permit requirements
- Case studies for monitoring to meet TMDL permit requirements
Since approximately 90 percent of the phosphorus load to the pond came from the Highway 55 inlet, but only 35 percent of the pond volume is provided to settle phosphorus from this source, diversion of influent water to the north west lobe of the pond was identified as a way to provide additional phosphorus settling time and improve overall phosphorus removal performance in the pond. This improvement option was implemented and is currently being monitored by the Bassett Creek Watershed Management Commission for treatment performance.
This page was last edited on 29 December 2022, at 01:33.

