![]()
TCMA Chloride Management Plan - TCMA Chloride Conditions
Chloride data across the TCMA was compiled and assessed to support the development of the CMP. As part of the TCMA Chloride Project, the MPCA worked with local partners to develop and implement a chloride monitoring program. The objective of the monitoring program was to better inform an understanding of chloride conditions across the TCMA, including seasonality, trends over time, and the potential for high chloride concentrations in the deepest part of lakes. Seventy-four lakes, 27 streams, and eight storm sewers were monitored as part of this effort from 2010-2013. The Chloride Monitoring Guidance for Lakes and Chloride Monitoring Guidance for Streams and Stormsewers were developed by the MPCA and local experts from the TCMA Chloride MSG and can be found on the MPCA’s TCMA Chloride Project website. The monitoring guidance provides recommendations on sample collection, times of the year to sample, as well as guidance for monitoring high risk waters. In addition to data collected in 2010-2013 following the TCMA Chloride Project monitoring program, chloride data from a host of other sources and timeframes were compiled. The data were collected by several local organizations including the MPCA, the United States Geological Survey (USGS), Capitol Region Watershed District (CRWD), Metropolitan Council Environmental Services (MCES), Minneapolis Park & Recreation Board (MPRB), Minnehaha Creek Watershed District (MCWD), Mississippi Watershed Management Organization (MWMO), Ramsey County Environmental Services, Ramsey-Washington Metro Watershed District (RWMWD), Rice Creek Watershed District, Scott County Watershed Management Organization, and Three Rivers Park District. A large portion of the data were compiled and submitted to the State of Minnesota’s Environmental Quality Information System database (EQuIS). All data collected by Metropolitan Council are available on their Environmental Information Management System (EIMS) database, and data collected by USGS are available on their water-quality data for the Nation database: waterdata.usgs.gov/nwis/qw.
The impacts of climate change create uncertainty related to winter salt application and chloride levels in TCMA waters in the future. Predictions provided by the United States Global Change Research Program for the TCMA area include warmer winter temperatures by 5 - 6 degrees Fahrenheit, longer freeze-free seasons increasing by 20-30 days, greater winter precipitation, and the likelihood of more frequent extreme events (Kunkel et al. 2013). On the one hand, these predictions of climate change may result in reduced salt use. On the other hand, more frequent snow events, more extreme events, and potentially more frequent ice storms may result in greater needs for deicing roads. Continued monitoring of climate change and chloride concentrations in the TCMA waters, tracking of salt use on all paved surfaces, and an adaptive process will be needed to restore and protect the TCMA waters from chloride impairments with the prospects of a changing climate.
The remainder of this section will present an overview of the assessments conducted based on the available data, including determinations of impairment, time and spatial trends in chloride concentrations, the TMDLs developed for impaired waters, and waters showing a high-risk for future impairment.
Contents
- 1 Condition status
- 2 Chloride sources
- 2.1 Winter maintenance activities
- 2.2 Roads
- 2.3 Commercial parking lots, driveways, and sidewalks
- 2.4 Private parking lots, driveways, and sidewalks (residential)
- 2.5 Municipal and industrial treatment facilities
- 2.6 Residential water softeners
- 2.7 Natural background sources of chloride
- 2.8 Agriculture
- 2.9 Other potential sources
- 3 Chloride trends
- 4 Chloride relationships to watershed and waterbody characteristics
- 5 Summary of data analysis
- 6 TMDL Summary
- 7 Protection of surface and groundwater
- 8 Protection of surface and groundwater
- 9 High risk surface waters
- 10 All surface waters and groundwater
- 11 Related pages
Condition status
This section describes the current status of water resources within the TCMA with respect to applicable chloride criteria. The status of surface waters including lakes, wetlands and streams is presented first. The status of groundwater resources is presented second.
View this section as a single page
Surface water


The MPCA’s approach to determining whether or not a stream, lake, or wetland is impaired by chloride relies on an assessment of available data. The MPCA conducted an assessment for chloride in the TCMA waterbodies in 2013. Two or more exceedances of the chronic criterion of 230 mg/L within a three-year period are considered an impairment. One exceedance of the acute criterion of 860 mg/L is considered an impairment. The 2013 TCMA chloride assessment resulted in 29 new chloride impairments (6 streams, 19 lakes, and 4 wetlands) added to the 2014 draft impaired waters list, resulting in a total of 39 chloride impairments in the TCMA. Shingle Creek and Nine Mile Creek were previously listed as impaired with completed chloride TMDLs. Approximately 11% of the 340 waterbodies assessed were determined to be impaired. An additional 38 (11%) were classified as high risk and 11% did not have enough data. High risk was defined as a waterbody having one sample in the last 10 years that was within 10% of the chronic criteria (207 mg/L). An interactive map showing assessed, impaired, not impaired, and high risk waters is on the MPCA Chloride Project website (MPCA Chloride Project Website Map of Assessments and Impairments). The assessed lakes, wetlands, and streams are shown on the 2014 Chloride Assessment Results in the TCMA map. The highest density of impairments is in the heavily urbanized area in Hennepin and Ramsey Counties, though three streams in the outlying suburban areas are also impaired by chloride. The chloride causing impairments in the streams in the outlying areas of the metro is largely effluent from the WWTPs, rather than deicing salt.
It is important to keep in mind that of the over 1,000 lakes, wetlands and streams in the TCMA, less than one-third had chloride data to make an assessment of impairment/attainment of water quality criteria. Also, of those waters with adequate data to make an assessment, only 30% were part of the TCMA Chloride Project monitoring program, which was developed to collect samples at critical times of the year and critical locations. As a result, data used to evaluate water quality conditions in waters not part of the TCMA Chloride Project monitoring program, may not have been representative of critical conditions. Critical times of the year for collecting chloride samples are typically during the winter snowmelt runoff (February through March) and during low flow periods, and critical areas for collecting chloride samples in a lake are near the bottom.
The impaired lakes, wetlands, and streams were compared by the concentrations of chloride ranked from highest to lowest concentrations. These rankings are presented in the Comparison of Impaired Lakes and Wetlands in the TCMA and the Comparison of Impaired Streams in the TCMA charts. These figures are not a direct reflection of the 303(d) listing assessment; they are intended to make a relative comparison of the extent of impairment across impaired waters. The values presented in these figures were calculated by identifying the maximum chloride concentration measured in a waterbody on individual sampling days, then averaging all individual sampling day maximums that exceeded the standard of 230 mg/L from 2003-2013. These figures indicate the variability in one waterbody or watershed to the next by the severity of the impairment. These rankings can be used by chloride users to prioritize management activities by area. Since only a portion of the TCMA waters have chloride monitoring data, the rankings can also be used to determine specific areas that are close to impaired and high-risk watersheds for further monitoring and higher levels of management.
Groundwater

Chloride concentrations in shallow groundwater are increasing, likely as a result of the application of deicing salt. This correlation is observed in a recent study by the MPCA, The Condition of Minnesota’s Groundwater, 2007-2011, which found that chloride concentrations were higher in wells sampled in urban areas, where salt is more commonly applied in winter months, compared to wells sampled in areas that were undeveloped (see table below).
Average chloride concentrations in groundwater based on land use
Link to this table
| Land Use | Chloride (mg/L) |
|---|---|
| Residential | 45 mg/L |
| Commercial/Industrial | 60 mg/L |
| Undeveloped | 15 mg/L |
The median chloride concentration in sand and gravel aquifers in the TCMA was 86 mg/L, compared to a median concentration of 17 mg/L in sand and gravel aquifers outside the TCMA. Twenty-seven percent of sand and gravel monitoring wells in the TCMA had chloride concentrations greater than 250 mg/L, the secondary maximum contaminant level set by the EPA (Chloride concentrations in ambient groundwater from the sand and gravel aquifers map). Very few monitoring wells outside the TCMA (about 1%) had chloride concentrations exceeding 250 mg/L.
Chloride sources
View this section as a single page


Chloride enters the TCMA lakes, streams, wetlands, and groundwater from a variety of sources. The relative significance of each source of chloride is dependent on the watershed. For highly developed urban areas, winter maintenance activities are typically the primary source. In less developed areas where point source discharges exist, the municipal wastewater treatment facilities may be the primary source of chloride, which in most cases is due to water softening. A conceptual model diagram of the primary anthropogenic sources is shown to the left. A chloride budget for the TCMA estimated that only 22%-30% of the chloride applied in the TCMA was exported out of the TCMA via streamflow in the Mississippi, Minnesota, and St. Croix Rivers (Stefan et al., 2008). Therefore, 70%-78% of the applied chloride remains in TCMA lakes, wetlands, and groundwater and it may also be stored in soil-water where infiltration is slow. Since chloride is an element and does not breakdown over time, the high percentage retained in the TCMA suggests that chloride will continue to accumulate and eventually make its way to the deep aquifers. This implies that, on average, chloride concentrations in the TCMA waterbodies are increasing with time. If the chloride loading remains steady, the concentrations will level out when equilibrium develops between loadings and transport out of the TCMA. By the same token, if loadings are reduced sufficiently and persistently, the chloride concentrations in the TCMA waterbodies will begin to decrease and will continue to decrease until a new equilibrium is reached. Each of these sources is briefly described below.
The land use map of the TCMA map, shown to the right, indicates land use in the TCMA is largely urban in the core of Minneapolis and St. Paul with a transition to rural and agricultural moving outward through the suburbs. The primary source of chloride may shift locally depending on land use.
Winter maintenance activities


Winter maintenance activities include snow and ice removal. Application of deicing and anti-icing chemicals, primarily salt, is common. Salt is applied to a variety of surfaces including roads, parking lots, driveways, and sidewalks. Runoff from salt storage facilities is another potential source of salt. The St. Anthony Falls Laboratory at the UMN developed an inventory of salt uses in the TCMA for a Minnesota Department of Transportation (MnDOT) Local Roads Research Board study (Sander et al., 2007). The inventory estimated the total amount of salt used for winter maintenance activities in the TCMA, based on purchasing records, to be 349,000 tons per year. Estimates of use by various entities are shown in the Distribution of NaCl in the TCMA chart.
Salt sales data in the United States shows a dramatic increase in the amount of salt being purchased. Along with the increased use of salt, increasing levels of chloride in lakes, wetlands, and streams should be expected.
Roads
The TCMA is estimated to have over 26,000 lane miles of roadways (Sander et al. 2007). Application rates range from 3 to 35 tons of road salt, per lane mile, per year, based on the salt purchasing records and the number or lane miles of MnDot, counties, and cities in the TCMA (Wenck, 2009)
A survey of municipal winter maintenance professionals in the TCMA, done by LimnoTech in 2013, found that typical application rates range from 100 - 600 pounds of salt applied per lane mile per event, which is consistent with previous evaluations of road salt application rates. However, rates can be much higher on hills, near intersections, and other ice problem areas. Higher speed roadways will typically have higher road salt application rates. Some events may require multiple passes of salt application and increase the application rate per event.
Commercial parking lots, driveways, and sidewalks
Commercial sources of deicing salt can vary greatly between different watersheds and includes salt applied to parking lots, driveways, and sidewalks on commercial property. The land owner or tenant may conduct winter maintenance activities, or winter maintenance may be contracted with private winter maintenance providers. Commercial sources are likely responsible for 10% and 20% of the total salt applied to paved surfaces in the TCMA (Wenck 2009). The MPCA and Fortin Consulting conducted research to validate and refine assumptions regarding commercial and private salt application rates specific to Minnesota (Fortin, 2012a). There is a range of reported application rates, which is to be expected, because rates should vary based on temperature, type of snow event, surface to where material is applied, number of passes over an area during an event, and type of material used. Application rates of salt on parking lots are estimated to range from 0.1 to 1 ton per acre per event, and typically 6.4 tons per acre per year. For sidewalks, the application rate is estimated to range from 8 to 25 pounds per 1,000 square feet per event (0.2 to 0.5 tons per acre per event). More area specific residential and commercial estimates of chloride usage can be determined on a watershed basis by digitizing all of the residential and commercial impervious surfaces and multiplying by the estimated application rates.
Review of available information and additional research included application rates from across the United States’ and Canada’s snowbelt, with an emphasis on Minnesota specific data. It was determined that an average rate of 6.4 tons per acre per event is the appropriate application rate to expect on parking lots. As a percent of the total deicing salt usage, it is estimated that anywhere between 5% and 45% is used for commercial applications (parking lots, sidewalks, residential, private roads). The amount of chloride from commercial sources is variable, and is dependent on the characteristics of the watershed, including the amount of impervious area. Additional estimates of commercial salt use are presented below.
- The Nine Mile Creek Chloride TMDL report, used data on salt purchases from Sander et al. (2007) and Novotny et al., (2008), but weighted the data based on land use. It was determined that the relative contribution for commercial and packaged deicer in the Nine Nile Creek watershed was 38% of the total amount of road salt that is applied (Barr Engineering, 2010).
- In the Shingle Creek TMDL, it was estimated that 7.5% of salt application was by commercial/private applicators. This figure was based on the estimates used in Canada. “Cheminfo (1999) estimated that commercial and industrial consumers represented approximately 5 to 10% of the deicing salt market. In quantifying total deicing salt application in Canada, Environment Canada used the midpoint of these data (7.5%) to represent commercial and industrial salt application (Environment Canada 1999).” (Wenck 2006).
- Sander et al. (2007) estimated that the bulk deicing salt applied by commercial snow and ice control companies accounted for 19% of the total salt used in the TCMA, while packaged deicer for home and commercial use was estimated to account for 5% of the total in the TCMA.
- Novotny et al. (2008) used market share amounts from the USGS annual mineral reports and the market share report published annually from the Salt Institute. TCMA amounts were estimated based on national amounts combined with the commercial bulk (19%) and packaged (5%) deicer estimates for a total of 24%.
- On a national basis, the Salt Institute estimated that 20% of bulk road salt purchases were by non-governmental entities.
- The USGS estimated 13% of ice control salt is for commercial use.
- A chloride TMDL study in New Hampshire reported a chloride application rate of 5.7 to 6.4 tons per acre per year for parking lots and drives (Sassan and Kahl, 2007). Parking lots were 47% of paved surfaces in the watershed and accounted for 36% of the chloride load. The study also estimated that 45% of salt was applied by private applicators.
Private parking lots, driveways, and sidewalks (residential)
Residential winter maintenance salt use has been estimated from purchasing records. Packaged deicer for home and commercial use is estimated to account for 5% of the total in the TCMA (Sander et al., 2007). See the Distribution of NaCl in the TCMA chart.
A Sidewalk Salt Survey was conducted to qualitatively assess the use of sidewalk salt by the general public in the TCMA. The survey was disseminated by local partners including RWMWD, MCWD, and MnDOT. The survey was administered through an on-line Survey Monkey link on the MCWD website (www.minnehahacreek.org) from November 2011 through March 2012. The survey was completed by 606 people online and 148 completed a paper survey. Approximately 47% of the respondents lived in St. Paul or Minneapolis, and other respondents lived in surrounding cities including Woodbury, Richfield, Plymouth, and Maplewood. Although the survey sampled 754 residents, the results represent a small percentage of the TCMA population and are non-random/voluntary; therefore, the survey is not representative of all residents in the TCMA. However, the data provide valuable information on the use of sidewalk salt by TCMA residents.
The majority of residents that responded to the survey used sidewalk salt (57%), particularly on sidewalks and steps. Most people selected products based on performance in colder temperatures and environmental safety. The majority of respondents did not know how much sidewalk salt to use (59%), and if they did know, they determined how much to use based on the instructions on the packaging or used as little as possible. For complete results of the survey see Appendix C.
Municipal and industrial treatment facilities
Municipal wastewater, backwash from municipal WWTPs, and industrial facilities with waste streams may contain chloride. The primary source of chloride in a municipal waste stream comes from water softeners. Many cities do not soften drinking water before it is distributed to residents. Many residents soften the water in their home with personal water softeners. The most common water softening systems use NaCl or potassium chloride (KCl). Salt that contaminates the groundwater can enter the sanitary sewer system through cracks and/or leaks in the pipes and pipe joints. Industrial facilities that discharge to the municipal wastewater collection system can be another source of chloride. Some industries have chloride in their discharge due to the products they produce or chemicals they use (Henningsgaard, 2012).
Industrial facilities may discharge directly to surface waters following treatment or may discharge to a sanitary sewer system, which transports the wastewater to a wastewater treatment plant (WWTP) for further treatment prior to discharge to surface water. A range of industrial facilities discharge directly to waters that are already impaired by chloride, these include food processing facilities, manufacturing, pipeline terminals, biofuel facilities, and groundwater treatment systems. Discharges of chloride from municipal and industrial wastewater sources are covered by individual or general permits. Chloride data for wastewater and industrial sources is currently not widely available. However, chloride monitoring is being required for many facilities as permits are re-issued. As part of the TMDL component of this project, several facilities were identified that likely discharge chloride within the impaired watershed. A table listing these facilities and their location is shown in Appendix A-3. There are likely additional facilities with the potential to contain chloride in their discharge; however, since they are not contributing to an impairment they were not evaluated at this time.
Residential water softeners


In areas with high hardness in the water supply, like the TCMA, residential water softeners that use salt are common. Hardness is a measure of the calcium and magnesium carbonate concentration in water. Most water softeners use chloride ions to replace the calcium and magnesium ions. Chloride from this salt is delivered to the environment either through discharge to a septic system or by delivery to a WWTP. Septic systems become more prevalent in the rural areas outside of the TCMA urban core. The chloride that comes from septic systems enters the shallow groundwater or local streams through subsurface flow. Chloride loading from any individual home water softener is dependent on many variables and is specific to the individual homeowner’s water chemistry, water use, hardness preferences, and softener efficiency. Estimates of the amount of salt discharged from residential water softeners in the TCMA are not available at this time. However, where the primary source of household water is hard and it is not softened by municipal water utility, residential water softeners are the primary source of chloride to WWTPs. The map to the right shows the hardness values of drinking water supply wells for the entire state of Minnesota. The Sand Creek watershed, located in Scott County of the TCMA, is an example where the primary source of chloride to surface waters is from water softening; chloride concentrations in WWTP effluent for three WWTPs located in the watershed average from 521 mg/L to 618 mg/L.
Natural background sources of chloride
Chloride occurs naturally in soil, rock, and mineral formations. Chloride is naturally present in Minnesota’s groundwater due to the natural weathering of these formations. Glacial deposits from eroded igneous rocks and clay minerals with chloride ions attached are potential sources in the TCMA. Natural background levels of chloride in surface runoff and groundwater vary depending on the geology. The natural background concentration in small streams in the TCMA has been estimated to be 18.7 mg/L (Stefan et al., 2008). A natural background concentration for lakes has not been estimated; however, the natural background load from surface runoff to lakes was assumed to be at a concentration of 18.7 mg/L as well. This background concentration characterizes runoff that is not impacted by current or historical applications of anthropogenic sources of chloride. Concentrations of chloride in precipitation are estimated to be 0.1 mg/L to 0.2 mg/L (Chapra et al., 2009).
Agriculture
Agricultural crop land may be a small source of chloride to lakes and streams. Fertilizers and biosolids from food processing and publicly owned treatment works contain chloride. The application of fertilizers and biosolids on crop land can result in chlorides being transported to lakes and streams through surface runoff, as well as infiltration into shallow groundwater and subsequent transport to lakes and streams. KCl is the most commonly used fertilizer containing chloride. While not expected to be a significant source of chloride, estimates of the amount of chlorides in land applied fertilizers and biosolids in the TCMA are not available.
An on-going evaluation of agricultural drainage water quality done by North Dakota State University – Department of Agriculture and Biosystems Engineering indicates that chloride concentrations from agricultural drainage can range from 8.6 mg/L to 37.4 mg/L. (The results of this study have not been published).
Other potential sources
Sources of chloride to TCMA lakes, wetlands, and streams other than those discussed above exist, but are considered to be small. One such source of chloride is the use of dust suppressants on gravel roads and parking areas. Chloride is a common constituent found at high concentrations in dust suppressants. Landfill leachate has also been shown to contain elevated levels of chloride (Mullaney et al., 2009). The use of aluminum chloride for treatment of lake sediments or ferric chloride for treatment of stormwater are sources of chloride and should be avoided in waters and watersheds with chloride impairments.
Chloride trends
View this section as a separate page
This section of the CMP presents evaluations of chloride water quality conditions in the TCMA considering:
- Seasonal chloride trends in surface waters
- Long-term chloride trends
- Chloride trends within lakes
- Chloride relationships to watershed characteristics
- Chloride concentrations in stormwater
- Chloride relationships between surface and groundwater
This information is intended to help inform management decisions such as where and when to focus monitoring efforts and where to prioritize implementation activities.
Seasonal chloride trends in surface waters


_in_Sand_Creek.PNG)
_in_Elm_Creek.PNG)

Chloride data were evaluated for seasonal trends by looking at monthly chloride concentrations. Seasonal trends can help determine the cause of elevated chloride concentrations. Causes can be direct runoff from winter maintenance practices using chloride, groundwater inputs (primarily from infiltrated chloride containing deicers) during low flow, and WWTP inputs.
For the majority of impaired lakes, chloride concentrations were highest January through May. The Monthly average chloride concentrations in Powderhorn Lake chart presents an example of the seasonal variability observed in Powderhorn Lake. Powderhorn Lake does not have a natural outlet and has little opportunity to flush chloride from the lake. For streams, chloride concentrations were highest December through April. Lakes tended to show less variation seasonally than streams, as would be expected due to the longer residence time and mixing that occurs in a lake.
There are some streams where chloride concentrations are influenced significantly by sources other than winter maintenance activities, such as WWTPs. These streams tended to show the highest chloride concentrations when flows were low. Low flows generally occur during winter months and dry summer months (July through September) when runoff is low. Sand Creek is an example and is shown in the Monthly chloride concentrations (average, maximum, and minimum) in Sand Creek chart. Chloride concentrations in Sand Creek were highest in late summer and winter and lowest in spring and early summer. Limited chloride data from the WWTPs discharging to Sand Creek confirm this as a significant source of chloride. Elm Creek is another stream that exhibits highest chloride concentrations in summer, as shown in the Monthly chloride concentrations (average, maximum, and minimum) in Elm Creek chart, but does not have the WWTPs contributing to the chloride concentration, indicating a different source is present that requires further investigation.
Long-term chloride trends
Long-term statistical trend analyses require a long, mostly continuous, monitoring record. Sufficient data were available in EQuIS to conduct long-term statistical trend analysis for 11 of the impaired lakes and 9 of the high risk lakes in the TCMA. Trends were determined using the Season Mann Kendall Trend Test with R Statistical Software and are presented in the Long-term chloride trends in lakes in the TCMA table. Lakes with a minimum of 10 years of data were analyzed and only samples collected from the surface were used in the analyses. Fourteen lakes showed a significant (p < 0.05) increasing trend in chloride and eight lakes did not have a significant trend. The Increasing chloride concentration in surface samples in Gervais Lake from 1983-2014 chart shows an increasing trend in chloride concentration in Gervais Lake. The other lakes in the Long-term chloride trends in lakes in the TCMA table showed similar trends.
The Metropolitan Council is currently analyzing long-term trends in chloride concentrations for some of the streams in the metro area. The results of the analyses will be available on the Metropolitan Council’s Stream Monitoring and Assessment webpage.
Long-term chloride trends in lakes in the TCMA
Link to this table
| Lake | Period | Percent change/year | Trend Description |
|---|---|---|---|
| Beaver | 1984-2014 | +2.42% | Increasing |
| Bennett | 1984-2014 | No trend | |
| Calhoun | 1991-2014 | +1.74% | Increasing |
| Carver | 2004-2014 | No trend | |
| Como | 1984-2014 | No trend | |
| Gervais | 1983-2014 | +3.72% | Increasing |
| Hiawatha | 1994-2014 | No trend | |
| Johanna | 1984-2014 | +3.37% | Increasing |
| Keller (Main Bay) | 1983-2014 | +3.85% | Increasing |
| Kholman | 1983-2014 | +3.62% | Increasing |
| Lake of the Isles | 1991-2014 | No trend | |
| Loring | 1995-2014 | No trend | |
| McCarron | 1985-2014 | +2.41% | Increasing |
| Powderhorn | 1994-2014 | No trend | |
| Silver | 1979-2014 | +2.92% | ncreasing |
| South Long Lake | 1984-2014 | +3.66% | Increasing |
| Spring | 1995-2014 | +4.34% | Increasing |
| Tanners | 2004-2014 | +3.63% | Increasing |
| Valentine | 1990-2014 | +5.56% | Increasing |
| Wabasso | 1984-2014 | +1.92% | Increasing |
| Wakefield | 1984-2014 | No trend | |
| Wirth | 1994-2014 | +2.49% | Increasing |
The Metropolitan Council 2013 Stream Water Quality Summary for the TCMA found that current chloride concentrations within the St. Croix, Minnesota, and Mississippi River basins are at levels higher than the 10-year average (2004-2013).
A multiple regression using both the year and the number of snowfall events in a winter season (precipitation equivalent > 0.01”) as the independent variables showed the strongest potential to predict average winter chloride concentrations. Waterbodies with 10 years of data (2004-2013) and a relatively strong correlation over this period include Powderhorn Lake, Wirth Lake, Bassett Creek, and Nine Mile Creek. The results of the multiple regression analyses are presented in the table below. The results show that average winter chloride concentrations are increasing between 9.7mg/L per year and 19.3 mg/L per year for these waters, though Bassett Creek did not exhibit a significant correlation to year. Average winter chloride concentrations increase between 2.9 mg/L and 7.9 mg/L for every additional snowfall event. Tests of significance for these correlations demonstrated that there is meaningful correlation, though the limited dataset of 10 years results in a fairly wide range in confidence intervals for the coefficients and intercepts.
Results of Regression Analyses for Average Winter Chloride Concentrations (2004-2013)
Link to this table
| Waterbody | Predicted winter average chloride (mg/L) | Yearly average increase (mg/L/yr) | Average increase per snowfall event (mg/L event) | R-square |
|---|---|---|---|---|
| Powderhorn Lake | 10.5 * year + 2.9 * # of events -20,898 | 10.5 | 2.9 | 0.63 |
| Wirth Lake | 9.7 * year + 4.2 * # of events -19,422 | 9.7 | 4.2 | 0.50 |
| Bassett Creek | 4.8 * # of events +74 | ---- | 4.8 | 0.61 |
| Nine Mile Creek | 19.3 * year + 7.9 * # of events -38,815 | 19.3 | 7.9 | 0.67 |

Long term trends in groundwater chloride concentrations have also been evaluated (Chloride concentration trends in Minnesota’s ambient groundwater map). Chloride concentrations in the TCMA groundwater have increased in about one-third of the wells that had sufficient data for trend analysis (MPCA The Condition of Minnesota’s Groundwater, 2013). In some wells, chloride concentrations have increased by about 100 mg/L in the last 15-20 years. Most of the wells with increasing trends were shallow wells tapping the sand and gravel aquifers; however, increasing concentrations were also found in two deep wells in the TCMA. The high concentrations of chloride found in the shallow sand and gravel aquifers in the TCMA are likely a result of winter deicing materials (MPCA, 2013).
Based on the chloride data and associated analyses, it is clear that chloride concentrations continue to increase in both the surface water and groundwater. The increasing trends in chloride concentrations indicate the need to take steps now to reduce chloride use.
Shallow groundwater will eventually either discharge to surface waters or move down to deeper aquifers that contain water that is used for Minnesota’s drinking water supplies. If continued trends of increasing chloride in shallow groundwater persist, higher concentrations in deep aquifers will eventually occur, which could result in higher water treatment costs or restrict its use for drinking water supplies (MPCA, 2013).
Upward trends in chloride concentrations were not just restricted to shallow wells that tapped the sand and gravel aquifers. Concentrations also significantly increased in two deep wells in the TCMA. One of these wells was 190 feet deep and tapped the Jordan aquifer in the vicinity of Cottage Grove. The other well was 72 feet deep and tapped a buried sand and gravel aquifer in Hennepin County. The Cl/Br ratios in both of these wells; 803 and 822, respectively; also was considerably greater than those expected in groundwater unaffected by human-caused contamination. In these two wells, chloride concentrations increased on average 1.8 mg/L each year. This translated into an increase of about 15-30 mg/L over approximately the past 15 years. Concentrations in the Jordan aquifer well increased from about 12 mg/L in 1999 to 41 mg/L in 2011, and concentrations in the buried sand and gravel aquifer wells increased from about 30 mg/L in 1996 to 46 mg/L in 2011 (MPCA, 2013).
Chloride trends within lakes
As chloride concentrations in water increase, the density of the water increases. Water that is denser will tend to collect at the bottom of a lake. As chloride concentrations increase, the differences between chloride concentrations in the bottom and top waters can become more pronounced. As these differences become greater, the normal mixing patterns of the lake can be inhibited and potentially stop all together (Novotny et al. 2008). Some lakes exhibit meromictic conditions or incomplete mixing and/or circulation, which can mean turn-over of the lake is limited, delayed, or non-existent. Mixing is an important process in a lake as it prevents reduced dissolved oxygen levels in the hypolimnion or lower level of the lake. Factors such as hydraulic residence time, fetch, groundwater inputs, colored fraction of dissolved organic carbon, and lake depth all influence the mixing conditions in a lake. Meromictic conditions are more likely to occur in lakes with higher depth to surface area ratios, as measured by the Osgood Index. High chloride concentrations in a lake may result in an increased risk of meromictic conditions. Brownie Lake and Spring Lake have been identified as being meromictic. The meromictic conditions in Brownie Lake may be due to alterations to the watershed and outlet that occurred prior to the practice of winter salt application.
A number of the monitored lakes had substantial differences in the chloride concentrations between the top and bottom of the water column. Brownie Lake exhibits this characteristic most dramatically, as shown in the Average monthly chloride concentrations in top and bottom samples in Brownie Lake chart. Peavey Lake, Powderhorn Lake, and Spring Lake also exhibit a clear pattern of higher chloride concentrations at depth as shown in the Average monthly chloride concentrations in top and bottom samples in Peavey Lake chart, Average monthly chloride concentrations in top and bottom samples in Powderhorn Lake chart, and the Average monthly chloride concentrations in top and bottom samples in Spring Lake chart respectively.
- Average monthly chloride concentrations in top and bottom samples from select lakes. Click on an image to enlarge.
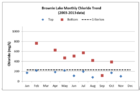
Brownie Lake 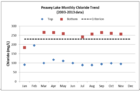
Peavey Lake 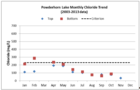
Powderhorn Lake 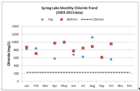
Spring Lake


Chloride relationships to watershed and waterbody characteristics
_in_TCMA_lakes_versus_Osgood_Index.PNG)


_in_Shingle_Creek_from_1996-2014.PNG)
Relationships were evaluated between the average winter chloride concentrations to watershed size, percent impervious surface, lake volume, and the lake Osgood Index. No strong relationships were identified with the exception of the Osgood Index and road density. The Osgood Index relates the mean depth of a lake to the surface area (Osgood Index = Mean Depth (m) ÷ Surface Area (km2)0.5). Lake chloride concentrations generally increase with increasing Osgood Index. The Osgood Index may be used to prioritize monitoring efforts for lakes with no or limited data.
Salt applied to impervious surfaces as a deicer is considered a primary source of chloride to lakes and streams. Therefore, one might expect chloride concentrations to be correlated to the amount of impervious area in a watershed. Winter stream chloride concentrations were positively correlated with annual winter salt application. Watersheds with less than 15 tons per square mile of chloride varied in winter stream median chloride concentration ranging from 18 to 89 mg/L (Wenck 2009).
Road density was also positively correlated with median winter chloride concentrations. The deicing salt load was highly dependent on road density. Median winter chloride concentrations appear to increase with road densities greater than 25 lane miles per square mile (Wenck 2009).
Chloride concentrations in stormwater
In comparison to chloride samples taken from lakes, wetlands, and streams, the area’s stormwater runoff contains some of the highest chloride concentrations found in the TCMA. The data indicates a high degree of seasonal variability, which is a result of winter maintenance activities and the direct connection to impervious surfaces. Storm sewer chloride data was collected in the TCMA from 1980 through 2013. Sample set sizes ranged from 19 to 288 samples per month, for a total of 1,569 samples. The data indicate that high chloride concentrations are found during the winter maintenance season and increase as the winter season progresses with the peak occurring in February
Chloride relationships between surface and groundwater
Concentrations of chloride in shallow groundwater are increasing. Shallow groundwater contributes flow to lakes, wetlands, and streams. In the TCMA, average chloride concentrations in shallow monitoring wells located within watersheds that contain one or more impaired surface waters were higher (141 mg/L) compared to wells in watersheds without an impaired lake, stream, or wetland (48 mg/L).
Several studies of streams in the Upper Midwest have found that higher chloride levels in shallow groundwater have, in part, contributed to an increase in concentration in streams during low flow conditions, when stream flow is dominated by groundwater inputs (Kelly 2008; Eyles et al. 2013; Corsi et al. 2015). This pattern of increased chloride concentrations during low flow conditions, typically during the summer months, is also evident in streams in the TCMA. Chloride concentrations exceeding the 230 mg/L standard have been observed in Bassett Creek in June and Shingle Creek in August. This issue is not isolated to the TCMA. For example, chloride levels in Miller Creek, a trout stream located in Duluth, have also consistently exceeded the 230 mg/L standard in July and August.
Eagle Creek is located in the city of Savage (Scott County) near the Highway 13/Highway 101 crossroads and is a Class 2A cold-water trout stream, meaning that it is a self-producing trout stream and is primarily fed by groundwater year round. Chloride concentrations have always been below the chronic chloride water quality standard of 230 mg/L; however, chloride concentrations have increased over time. The median chloride concentration in 2012 was 36 mg/L, which is more than twice the median concentration in 2001, 16 mg/L (Increasing chloride concentrations in Eagle Creek from 2001-2012 chart).
Shingle Creek, a tributary to the Mississippi River, is an urban stream that runs through Brooklyn Park, Brooklyn Center, and Minneapolis. The creek typically has numerous exceedances of the 230 mg/L standard each year, particularly during winter months. However, average chloride levels in the stream during summer months have also increased over time (Figure 28). The estimated increase in average summer (July through October) chloride concentration in Shingle Creek from 1996 to 2014 was 53 mg/L, based on a linear regression. The increased chloride concentrations in Eagle and Shingle Creek, and likely many other streams in the TCMA, suggest that chloride from deicing activities is infiltrating into shallow groundwater, resulting in elevated chloride concentrations in streams during summer baseflow conditions.
Similar to other studies (Kelly 2008; Eyles et al. 2013; Corsi et al. 2015), streams in the TCMA and greater Minnesota are experiencing high chloride concentrations during summer baseflow conditions. This trend is attributed to high chloride concentrations in shallow groundwater discharging to streams as baseflow.
Summary of data analysis
Based on the water quality data collected and the above data analyses, the following conclusions can be made:
- Chloride use increased in the TCMA in the latter half of the 20th century, 1950-2000.
- Levels of chloride are continuing to increase in both groundwater and surface waterbodies in the TCMA.
- The highest chloride concentrations occur during snowmelt conditions during winter months and low flow periods in streams.
- Chloride levels tend to be higher in the bottom of a lake versus the surface.
- Chloride concentrations in TCMA waterbodies are positively correlated to road density in the contributing watersheds.
- There are existing data gaps of chloride concentrations in TCMA waterbodies, as many have limited to no data and lack data that would represent critical conditions.
- Winter maintenance activities in urban areas and WWTPs in rural areas tend to be the primary sources of chloride to TCMA waters.
TMDL Summary
The Total Maximum Daily Loads (TMDLs) were developed for each of the lakes, wetlands and streams in the TCMA impaired for chloride, with the exception of Shingle Creek and Nine Mile Creek which already have existing TMDLs. A TMDL quantifies the allowable pollutant loading to a lake, wetland, or stream that will result in water quality standards being attained. The water quality target for the TMDLs was set to the chronic water quality criterion for chloride of 230 mg/L. The total allowable load, or TMDL, is allocated to the various sources contributing chloride as well as consideration of a margin of safety and reserve capacity. Margin of safety is intended to account for uncertainty in the development of the TMDL. Reserve capacity is intended to set-aside a portion of the TMDL for future growth. For the TCMA chloride TMDLs, reserve capacity was set to zero assuming that any further development and additional impervious surfaces would be expected to have the same level of best management practices (BMPs) implemented for winter maintenance activities as for the remainder of the watershed. The complete details of the TMDL development are presented in the TCMA Chloride TMDL report (see Appendix A).
A total of 39 waterbodies are listed as impaired by chloride, and TMDLs for Shingle Creek and Nine Mile Creek have already been prepared under separate projects. A total of 37 TMDLs were completed as part of this project. Summaries of the TMDLs are presented in the following tables.
Summary of TMDL and Components for Impaired Lakes and Wetlands in the TCMA
Link to this table
| Lake/Wetland | AUID | Watershed Area (ac) | TMDL and Components (all values in lbs/yr of chloride) | |||||
|---|---|---|---|---|---|---|---|---|
| Loading Capacity (TMDL | WLA | LA | Margin of Safety | |||||
| MS4 Categorical | Wastewater Sources1 | Non-Permitted Aggregate | Natural Background | |||||
| Battle Creek Lake | 82-0091-00 | 4,326 | 2,153,699 | 1,766,033 | 0 | 0 | 172,296 | 215,370 |
| Brownie Lake | 27-0038-00 | 452 | 341,418 | 279,963 | 0 | 0 | 27,313 | 34,142 |
| Carver Lake | 82-0166-00 | 2,242 | 1,071,123 | 878,321 | 0 | 0 | 85,690 | 107,112 |
| Como Lake | 62-0055-00 | 1,850 | 994,078 | 815,144 | 0 | 0 | 79,526 | 99,408 |
| Diamond Lake | 27-0022-00 | 744 | 486,017 | 398,534 | 0 | 0 | 38,881 | 48,602 |
| Kasota Ponds North | 62-0280-00 | 10 | 6,234 | 5,112 | 0 | 0 | 499 | 623 |
| Kasota Ponds West | 62-0281-00 | 6 | 5,742 | 4,708 | 0 | 0 | 459 | 574 |
| Kohlman Lake | 62-0006-00 | 7,533 | 4,839,183 | 3,106,733 | 1,050,484 | 0 | 303,096 | 378,870 |
| Little Johanna Lake | 62-0058-00 | 1,703 | 1,224,242 | 1,003,879 | 0 | 0 | 97,939 | 122,424 |
| Loring Pond (South Bay) | 27-0655-02 | 34 | 9,764 | 8,007 | 0 | 0 | 781 | 976 |
| Mallard Marsh | 62-0259-00 | 16 | 9,851 | 8,077 | 0 | 0 | 788 | 985 |
| Parkers Lake | 27-0107-00 | 1,064 | 1,431,262 | 528,161 | 787,163 | 0 | 51,528 | 64,410 |
| Peavey Lake | 27-0138-00 | 776 | 205,995 | 165,889 | 3,692 | 0 | 16,184 | 20,230 |
| Pike Lake | 62-0069-00 | 5,735 | 3,591,268 | 2,943,971 | 1,059 | 0 | 287,217 | 359,021 |
| Powderhorn Lake | 27-0014-00 | 332 | 218,588 | 179,242 | 0 | 0 | 17,487 | 21,859 |
| Silver Lake | 62-0083-00 | 655 | 370,011 | 303,409 | 0 | 0 | 29,601 | 37,001 |
| South Long Lake | 62-0067-02 | 114,785 | 26,334,624 | 21,534,261 | 4,030 | 0 | 2,106,448 | 2,633,059 |
| Spring Lake | 27-0654-00 | 39 | 15,600 | 12,792 | 0 | 0 | 1,248 | 1,560 |
| Sweeney Lake | 27-0035-01 | 2,439 | 1,456,271 | 1,194,142 | 0 | 0 | 116,502 | 145,627 |
| Tanners Lake | 82-0115-00 | 1,732 | 826,520 | 677,746 | 0 | 0 | 66,122 | 82,652 |
| Thompson Lake | 19-0048-00 | 178 | 134,340 | 110,159 | 0 | 0 | 10,747 | 13,434 |
| Valentine Lake | 62-0071-00 | 2,404 | 1,165,072 | 955,359 | 0 | 0 | 93,206 | 116,507 |
| Wirth Lake | 27-0037-00 | 426 | 1,095,000 | 897,900 | 0 | 0 | 87,600 | 109,500 |
1 WLA=0 in the wastewater sources column means that there is no wastewater discharges in that watershed
Summary of TMDL and Components for Impaired Streams in the TCMA
Link to this table
| Stream | AUID | Watershed Area (ac) | TMDL and Components (all values in lbs/yr of chloride) | |||||
|---|---|---|---|---|---|---|---|---|
| Loading Capacity (TMDL | WLA | LA | Margin of Safety | |||||
| MS4 Categorical | Wastewater Sources1 | Non-Permitted Aggregate | Natural Background | |||||
| Bass Creek | 07010206-784 | 5,434 | 1,746,399 | 1,432,047 | 0 | 0 | 139,712 | 174,640 |
| Bassett Creek | 07010206-538 | 25,209 | 9,334,219 | 6,642,961 | 1,233,048 | 0 | 648,094 | 810,117 |
| Battle Creek | 07010206-592 | 7,246 | 2,328,721 | 1,909,551 | 0 | 0 | 186,298 | 232,872 |
| Elm Creek | 07010206-508 | 66,382 | 21,332,410 | 17,386,888 | 0 | 105,688 | 1,706,593 | 2,133,241 |
| Judicial Ditch 2 | 07030005-525 | 1,587 | 510,115 | 418,294 | 0 | 0 | 40,809 | 51,011 |
| Minnehaha Creek | 07010206-539 | 109,151 | 35,997,083 | 28,679,140 | 1,004,128 | 0 | 2,806,140 | 3,507,675 |
| Raven Stream | 07020012-716 | 42,750 | 15,023,193 | 442,771 | 1,284,983 | 10,822,561 | 1,099,057 | 1,373,821 |
| Raven Stream, East Branch | 07020012-543 | 14,751 | 6,025,349 | 442,093 | 1,284,983 | 3,445,007 | 379,229 | 474,037 |
| Rush Creek, South Fork | 07010206-732 | 13,844 | 4,470,069 | 3,646,696 | 21,010 | 1,532 | 355,925 | 444,906 |
| Sand Creek (South) - includes 07020012-662 | 07020012-513 | 175,578 | 59,480,179 | 4,402,547 | 3,056,425 | 41,864,932 | 4,513,900 | 5,642,375 |
| Unnamed creek (Headwaters to Medicine Lk) | 07010206-526 | 6,447 | 2,071,959 | 1,699,006 | 0 | 0 | 165,757 | 207,196 |
| Unnamed creek (Unnamed ditch to wetland) | 07010206-718 | 793 | 254,852 | 208,979 | 0 | 0 | 20,388 | 25,485 |
| Unnamed Stream (Unnamed lk 62-0205-00 to Little Lk Johanna) | 07010206-909 | 1,627 | 522,817 | 428,710 | 0 | 0 | 41,825 | 52,282 |
1 WLA=0 in the wastewater sources column means that there is no wastewater discharges in that watershed
Protection of surface and groundwater
Protection of surface and groundwater
Protection is an opportunity to prevent waters from continued degradation which may result in impairment. Prevention or protection is often more easily accomplished than the restoration of an impaired waterbody. Protection efforts also may eliminate the need for additional permit and other regulatory requirements to reduce pollution. Successful protection efforts rely on understanding how current practices or conditions may be contributing to water quality conditions.
High risk surface waters
Preventing a waterbody from being contaminated with chloride is easier and more cost effective than restoration. Chloride is a conservative ion and will not break down over time but rather it accumulates in waters. Therefore, efforts should be made to protect waters that show an increasing trend in chloride concentration or have been shown to have chloride concentrations approaching the water quality criteria. Lakes, wetlands, or streams with at least one sample within 10% of the chronic water quality standard within the last 10 years have been identified as a high risk waterbody (one exceedance of 207 mg/L chloride). Proactive actions to reduce chloride loads to these high risk waterbodies should be pursued. Proactive actions similar to actions listed for impaired waters should be explored to protect high risk waters. These waters are considered to be approaching the water quality standard and if no actions are taken, they will likely reach impairment status in the near future. The TCMA lakes and streams identified as being at high risk for potential chloride impairment are shown in the High Risk Lakes in the TCMA table and the High Risk Streams in the TCMA table, respectively.
It should be noted that there are potentially many more high risk waters in the TCMA that have not been identified because there is limited or no monitoring data available for those waters. For this reason, similar proactive approaches to chloride management should be taken to prevent chloride contamination.
All surface waters and groundwater
In addition to the high risk waters listed above, protecting all surface waters and groundwater from further degradation due to chloride is important. By implementing salt reducing practices throughout the TCMA, both the need to restore those waters already impaired and also protect those waters not yet exceeding the standard are addressed. The practices necessary for protection of groundwater are the same as those for restoring and protecting surface waters. Through targeting and prioritization a starting point can be established. Management practices and BMPs used for impaired and high risk waters can be the same for all waterbodies and should provide the same level of protection and chloride reduction.
High risk lakes in the TCMA
Link to this table
| Lakes | AUID |
|---|---|
| Beaver Lake | 62-0016-00 |
| Bennett Lake | 62-0048-00 |
| Calhoun Lake | 27-0031-00 |
| Centerville Lake | 02-0006-00 |
| Crosby Lake | 62-0047-00 |
| Crystal Lake | 27-0034-00 |
| Fish Lake | 19-0057-00 |
| Gervais Lake | 62-0007-00 |
| Hiawatha Lake | 27-0018-00 |
| Johanna Lake | 62-0078-00 |
| Keller Lake (Main) | 62-0010-02 |
| Lake Of The Isles | 27-0040-00 |
| McCarron Lake | 62-0054-00 |
| Medicine Lake | 27-0104-00 |
| Ryan Lake | 27-0058-00 |
| Taft Lake | 27-0683-00 |
| Unnamed Lake | 62-0278-00 |
| Wabasso Lake | 62-0082-00 |
| Wakefield Lake | 62-0011-00 |
High risk streams in the TCMA
Link to this table
| Streams | AUID |
|---|---|
| Bevens Creek | 07020012-718 |
| Bluff Creek | 07020012-710 |
| Classen Lake Creek | 07010206-703 |
| Clearwater Creek | 07010206-519 |
| County Ditch 17 (Spring Brook) | 07010206-557 |
| Credit River | 07020012-517 |
| Diamond Creek | 07010206-525 |
| Dutch Lake Outlet | 07010206-678 |
| Fish Creek | 07010206-606 |
| Painter Creek | 07010206-700 |
| Rush Creek | 07010206-528 |
| Unnamed Creek | 07010206-704 |
| Unnamed Creek | 07010206-740 |
| Unnamed Creek (Pleasure Ck) | 07010206-594 |
| Unnamed Stream (Perro Ck) | 07030005-612 |
| Unnamed Stream (Sand Ck) | 07010206-744 |
| Unnamed Stream (Trib To Long Lk) (Furgala Creek) | 07030005-765 |
| Unnamed Stream In Plymouth | 07010206-738 |
| Unnamed Stream Receiving Wtr From Medicine Lk | 07010206-785 |
Related pages
- TCMA Chloride Management Plan - Background and Description
- TCMA Chloride Management Plan - TCMA Chloride Conditions
- TCMA Chloride Management Plan - Prioritizing and Implementing Restoration and Protection
- TCMA Chloride Management Plan - Monitoring, tracking, reporting, and adaptive management
- TCMA Chloride Management Plan - Research Needs
- TCMA Chloride Management Plan - Stakeholder and Public Involvement Process
- TCMA Chloride Management Plan - Appendix A – TCMA Chloride TMDL
- TCMA Chloride Management Plan - Appendix B – Winter Maintenance Assessment tool (WMAt)
- TCMA Chloride Management Plan - Appendix C – Sidewalk Survey Results
- TCMA Chloride Management Plan - Appendix D – Educational Resources
- TCMA Chloride Management Plan - References