Technical basis for pretreatment sizing for basins and filter strips
ENSURE YOUR UNITS ARE CONSISTENT AND CORRECT
|
ENSURE YOUR UNITS ARE CONSISTENT AND CORRECT
|
Initial research was conducted to determine whether an approach for sizing pretreatment practices was consistently applied across the country. Stormwater programs for every state were reviewed to determine the approaches being used, as well as a consensus in the approach. The results of this review indicated that a consistent approach to stormwater pretreatment across the country was not used, and some states do not require pretreatment of stormwater runoff at all. Because of the lack of consensus and research-backed sizing criteria for pretreatment, stormwater practitioners in Minnesota determined that guidelines were needed to define specific sizing criteria to provide consistent, effective results.
Given the lack of a consistent approach in stormwater pretreatment sizing, analysis was conducted to determine the general guidelines for pretreatment sizing in Minnesota based on the settling velocity of particles in stormwater. Many sizes of suspended solids enter a treatment practice–from clays below 2 μm (2 micrometers or 2000 mm) to silts between 2 μm and 80 μm to sands between 80 μm and 4 mm and beyond. A four order of magnitude difference between the smallest clay particles and largest sand sizes particles entering the practice is noted with a greater order of magnitude difference in settling velocity. A pretreatment practice is designed to settle the largest of these (primarily inorganic) particles in a location where they will be relatively simple to clean out and dispose of. As a result of this pretreatment, required maintenance will be reduced on the primary treatment practice (also called a structural stormwater BMP) because a large portion of the suspended solids will settle in the pretreatment practice, which will prolong the life span and maintain the design pollutant removal efficiency of the primary treatment.
The rationale for pretreatment is, therefore, to reduce maintenance costs and efforts. A pretreatment practice should serve the following three functions.
- Settle the larger particles (typically sand, which is greater than 80 μm) into an easily cleaned location to capture roughly one-half of the suspended solids.
- Keep the sediment from scouring out of the device during high flows, which is typically done by providing sufficient depth of water or using a device to calm high flows that come into the basin.
- Retain floatable trash and large organic particles (e.g., leaves, grass clippings, and sticks) in the pretreatment practice, which is typically done through a submerged outlet so that floatables are retained and can be cleaned out at a later time.
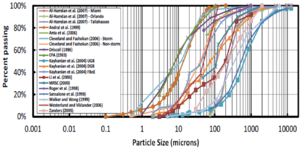
The pretreatment sizing methodology described on this page relies on the settling function of the pretreatment practice (i.e., item No. 1 above) to perform a preliminary sizing of basins and filter strips. Properly designed and sized pretreatment practices will often remove 50 percent of the suspended solids in a typical storm before the water enters the primary treatment practice. However, the amount of sediment removed depends upon the storm intensity. Low-intensity storms will primarily move clay and silt, which do not settle well in a pretreatment device, and pretreatment is expected to remove less than 50 percent. High-intensity storms will move most of the particles lodged on impervious surfaces and will result in a higher removal of suspended solids; greater than 50 percent of the suspended solids will settle. Examples of various solids size distributions are illustrated in the adjacent figure. The x-axis covers four orders of magnitude in particle size, and the median particle diameter (at 50 percent finer than) varies from 50 to 700 μm. Therefore, design of a pretreatment facility to remove 50 percent of suspended solids is difficult, unless the average annual particle size distribution is known. Herein, the design sizing goal will be to remove a given percent of a given particle size of sand and silt, which are the primary components of soil.
Contents
Basins
Basins are stormwater best management practices (BMPs) having an engineered pool that promotes settling of solids (e.g., pond forebay, sump, hydrodynamic separator, and catch basin). These pretreatment facilities are typically small (relative to the primary treatment practice) but can be sized to settle gravel and sands, and possibly silts, at low flow conditions. For preliminary sizing purposes, the small size results in a basin that is close to well-mixed, where the concentration of suspended solids is constant with depth to the bottom of the basin and the particles are settling out because of zero velocity at the wall.
Development of sizing criteria
The following assumptions will be made while developing the sizing criteria.
- A design storm of 1-inch of precipitation.
- Permeable surfaces in the catchment do not contribute runoff for the 1-inch storm.
- The design storm distribution over time is Natural Resources Conservation Service (NRCS) Type II with an intensity of 0.5 inches per hour (in/hr) during the most intense portion of the storm.
- The bottom of the basin does not have sediment scouring.
- The water column is well-mixed so that the suspended solids concentration is constant over the basin.
- The watershed time of concentration will be approximated using the simplified 1965 US Federal Aviation Administration (FAA) time of concentration equation, which is meant to be paired with the Rational Method.
Assumption Nos. 1 through 3 are common for rainfall-runoff computations in Minnesota and greatly simplify the design. Assumption No. 4 is correct if the basin is properly cleaned. Assumption No. 5 is applicable with the small size of the pretreatment basin, relative to the discharge and the size of the primary practice and would result in a conservative sizing criteria. This sizing criteria is to be used for preliminary sizing of a pretreatment basin. For a more refined design, a dynamic design criteria similar to SHSAM (Sizing Hydrodynamic Separators And Manholes) is recommended. Assumption No. 6 is a fair assumption with the velocities and depth of the flow over a filter strip and would result in a conservative sizing criteria.
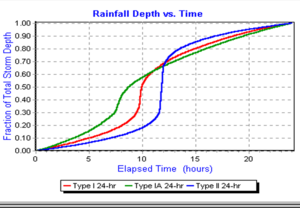
The NRCS Type II distribution of the 24-hour, 1-inch storm was selected be used in these pretreatment sizing calculations. The most intense hour of this design storm occurs around hour 12, when 50% of the storm total falls in one hour [NRCS 2015]. This design intensity, 0.5 inches per hour for that single hour is used in the following design calculations. The design flow into the basin results from the Rational Method by multiplying the directly connected impervious area of the catchment with this intensity, or
Eq. 1 \( Q = cAI \)
where Q is water discharge into the filter strip, A is the directly connected impervious area of the catchment (square feet), I is the peak intensity during the design storm (0.5 in/hr or 1.16x10⁻⁵ ft/s), and c is the runoff coefficient equal to 0.7 for smaller storms on impermeable surfaces.
The discharge is also equal to the volume of water in the basin divided by the residence time of the water in the basin, or
Eq. 2 \( Q = A_Sh / t_r \)
where As is the surface area of the water in the pretreatment basin, h is the depth of the water in the basin, and tr is the residence time of the water in the basin.
The residence time of water (tr) can be approximated by assuming that settling occurs in a well-mixed basin (Assumption No. 5) from the relation [Gulliver, 2007]
Eq. 3 \( 1 - FR = 1 / (1 + v_S t_r / h) \)
where FR is the fraction of a given settling velocity to be removed and vs is the settling velocity of a given size particle. Equation 3 can be rearranged to give the residence time
Eq. 4 \( t_r = (h / v_S) * (FR / (1 - FR)) \)
Substituting to solve for AS gives
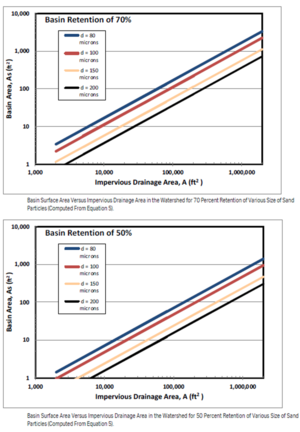
Eq. 5 \( A_S = (cAI / v_s) * (FR / (1 - FR)) \)
Note that Equation 5 does not depend upon the basin depth. The basin depth should be sufficient so that scour does not occur. Avoiding scour is not considered in these sizing calculations but should be considered in the sump design. To prevent scour, the depth (D) is typically recommended to be equal to the lesser of
Eq. 6 \( D ≤ sqrt (A_S) or 6 feet \)
For biofiltration, or bioinfiltration, basins that may experience higher flows, a recommended minimum depth to avoid scour is equal to the lesser of
Eq. 7 \( D ≤ sqrt (A_S) or 1.5 feet \)
The fraction of a given settling velocity to be removed by the pretreatment basin will need to be chosen by the designer. The settling velocity of a given size (typical sand shaped) particle has been developed by Ferguson and Church [2004], as
Eq. 8 \( V_S = (gRd^2) / (18 u + (0.75Rd^3)^0.5) \)
| Settling velocity according to Equation 8 of various equivalent spherical diameter sand and silt particles at 20°C. | ||
| Silt and sand Diameter (um) | vs (m/s) | Header text (ft/s) |
|---|---|---|
| 10 | 0.000089 | 0.00029 |
| 30 | 0.00078 | 0.0026 |
| 80 | 0.0051 | 0.017 |
| 100 | 0.0075 | 0.025 |
| 150 | 0.015 | 0.049 |
| 200 | 0.023 | 0.075 |
| 500 | 0.071 | 0.23 |
| 1000 | 0.13 | 0.43 |
where g is the acceleration of gravity, R is the specific gravity of the particle relative to that of water, d is the equivalent spherical diameter of the particle and u is the viscosity of water. Equation 8 combines Stoke's Law at small particle diameters with the turbulent drag coefficient at larger particle diameters and a transition from a dependence upon d2 to one upon √d as the particle size increases. If we assume that the pretreatment basin is being designed to settle silica-based, inorganic particles (i.e., silt and sand) at 20oC, the settling velocities of the particles at various equivalent spherical diameters are given in the adjacent table. Sample results of these computations are given in the adjacent figure.
Basin sizing examples
Many types of basins can be used as pretreatment practices for various sizes and circumstances of bioretention/biofiltration facilities, including forebays, sumps, proprietary devices, and basins used as pretreatment for bioretention and biofiltration facilities. The examples used herein will use a forebay, sump, and bioretention pretreatment basin. Various-sized retention criteria can be used, which is the user’s choice. Note that these sizing calculations are preliminary. If justified by the cost, it is recommended that these calculations be used as preliminary sizing methodology, to be followed by a more refined dynamic design criteria similar to SHSAM, which uses watershed routing of storms.
Example A - forebay pretreatment basin
One of the inlets into a 2-acre pond is draining a directly connected impervious area of 30 acres in a watershed with a 2-percent average slope and a watershed length to the outlet of 2,000 ft. The pretreatment basin for the 2-acre pond will be designed to retain 70 percent of the 80 μm fine-sand particles. Using settling velocities from the above table, the settling velocity (vS) for 80 μm fine-sand particles is 0.017 feet per second (fps). For this case, the values to be input in Equation 5 are
- FR = 0.7
- A = 30 acres
- I = 0.5 in/hr
- vs = 0.017 ft/s
- S = 0.02 ft/ft
- L = 2,000 ft
The rainfall intensity is related to the time of concentration and determining the peak intensity for the storm is essential for sizing pretreatment practices. Using the following equation from the FAA [Chow, et al. 1988], we can estimate the time of concentration (tc in minutes)
Eq. 9 \( t_c = 1.8 (1.1 - c) L^{0.5} / (100S)^{1/3} \)
where c is the Rational Method runoff coefficient of 0.7, S is the average watershed slope (ft/ft), and L is the watershed length (ft) to the outlet. The time of concentration is equal to tc = 26 minutes. This concentration time is within the most intense hour of a NRCS Type II storm [Merkel and Moody, 2015]. Thus, the intensity of the storm, I, is 0.5 inches per hour.
The design discharge is computed from Equation 1
\( Q = 0.7 * 0.5 in/hr * 30 ac = 10.5 ft^3/s \)
Substituting Equation 1 into Equation 5, the equation for the area of the pretreatment basin becomes
Eq. 10 \( A_S = (Q * FR) / (v_S (1 - FR)) = (10.5 ft^3/s * 0.7) / (0.017 ft/s * (1 - 0.7)) = 1442 ft^2 \)
Finally, in Equation 6, the forebay depth would be roughly the lesser of (√1,441 = 38 ft) or 6 ft, so the preliminary water depth would be roughly 6 ft. With a large impervious area draining into one outlet into a pond, the designer may want to specify a forebay because of the large pretreatment area that is required.
Example B - Sump pretreatment basin
An inlet to a 3,000 ft2 pond will be draining a parking lot with a directly connected impervious area of 3 acres in a watershed with a 1 percent average slope and a watershed length to the outlet of 500 ft. The pretreatment basin for the pond will be designed to retain 50 percent of the 150 μm sand particles during the design storm. For this example, the values to put into Equation 6 are
- FR = 0.5
- A = 3 acres
- I = 0.5 in/hr
- vS = 0.049 ft/s
- S = 0.01 ft/ft
- L = 500 ft
As in the previous example, the peak rainfall intensity should be over a time of concentration, tc, calculated using Equation 9. The time concentration here is equal to 16 minutes. This time of concentration occurs within the most intense hour of an NRCS Type II storm, which accounts for approximately 50 percent of the storm total. Thus, the intensity of the storm is 0.5 in/hr.
The design discharge is computed from Equation 1
\( Q = 0.7 * 0.5 in/h * 3 ac = 1.1 ft^3/s \)
and using an intensity of 0.5 in/hr, AS becomes
\( A_S = (1.1 ft^3/s * 0.5)/(0.049 ft/s * (1-0.5)) = 22 ft^2 \)
The sump would have a diameter of 5.3 ft but scaling up to a standard manhole size of 6 ft is recommended as a good practice. Using Equation 6, the water depth in the sump would be the lesser of (√21) = 5 ft or 6 ft, so the preliminary water depth in the sump would be roughly 5 ft.
Example C - rain garden pretreatment basin
A directly connected impervious area of 10,000 ft2 with a mean slope of 3 percent and a watershed length to the outlet of 300 ft, drains into a bioretention practice. The area is of sufficient size to install a well-sized pretreatment basin, so the designer chose to settle 70 percent of the 80 μm fine-sand particles in the filter strip during the design storm. For this case, the values to be input for Equation 5 are
- FR = 0.7
- A = 10,000 ft2
- I = 0.5 in/hr
- v_S = 0.017 ft/s
- S = 0.03 ft/ft
- L = 300 ft
As in the previous examples, the peak rainfall intensity should be over a time of concentration, tc, calculated using Equation 9. The time concentration here is equal to 9 minutes. This time of concentration occurs within the most intense hour of an NRCS Type II storm, which accounts for approximately 50 percent of the storm total. The design discharge is computed from Equation 1
\( Q = 0.7 * 0.5 in/hr * 100,000 ft^2 * 1 ac/43560 ft^2 = 0.08 ft^3/s \)
and using Equation 12, AS becomes
\( A_S = (0.08 ft^3/s * 0.7) / (0.017 fr/s * (1-0.7)) = 11 ft^2 \)
Using Equation 7 for bioretention facilities, the pretreatment basin depth would be roughly the lesser of (√11) = 3.3 ft or 1.5 ft, so the preliminary depth would be roughly 1.5 ft.
Filter strips
Filter strips are primarily designed to enhance settling; physical filtering of particles in a filter strip is minimal. The filter strip is located at the bottom of a shallow, widely spread, open channel flow to allow for particle settling through the media, which is often grass or rocks. The grass or rocks allow space for the settled particles to collect until cleanout is required.
Development of sizing criteria
| Settling velocity according to Equation 8 of various equivalent spherical diameter sand and silt particles at 20°C. | ||
| Silt and sand Diameter (um) | vs (m/s) | Header text (ft/s) |
|---|---|---|
| 10 | 0.000089 | 0.00029 |
| 30 | 0.00078 | 0.0026 |
| 80 | 0.0051 | 0.017 |
| 100 | 0.0075 | 0.025 |
| 150 | 0.015 | 0.049 |
| 200 | 0.023 | 0.075 |
| 500 | 0.071 | 0.23 |
| 1000 | 0.13 | 0.43 |
The following assumptions have been made while developing the sizing criteria.
- A design storm of 1-inch precipitation.
- The design storm distribution over time is Natural Resources Conservation Service (NRCS) Type II with an intensity of 0.5 inches per hour (in/hr) during the most intense portion of the storm.
- Permeable surfaces in the catchment do not contribute runoff for the 1-inch storm.
- There is no scour on the filter strip surface.
- The infiltration rate through the filter strip surface is minimal and relative to the flow over the filter strip.
- The water column is well-mixed, such that the concentration of suspended solids is constant, with a loss of solids as the water moves down the filter strip in a plug-flow fashion.
Assumption Nos. 1 through 3 are common for rainfall-runoff computations in Minnesota and greatly simplify the design. Assumption No. 4 is correct if the filter strip does not need maintenance. Assumption No. 5 is made because of the short residence time of the water on the filter strip. Assumption No. 6 is a fair assumption with the velocities and depth of the flow over a filter strip and would result in a conservative sizing criteria.
The highest discharge for the design storm will be during the peak 0.5 in/hr intensity, based upon Assumption Nos. 1 through 3. The flow into the filter strip results by multiplying the directly connected impervious area of the catchment with this intensity, or
Eq. 11 \( Q = cAI \)
where Q is water discharge into the filter strip, c is a Rational Method coefficient equal to 0.7 for small storms, A is the directly connected impervious area of the catchment, and I is the peak intensity during the design storm (i.e., 0.5 in/hr).
The discharge is also equal to the volume of water on the filter strip divided by the residence time of the water on the filter strip, or
Eq 12 \( Q = (LWh) / t_r \)
where L is the length of the filter strip, W is the width of the filter strip, h is the depth of water on the filter strip, and tr is the residence time of the water on the filter strip. Combining Equations 11 and 12 results in a relation for filter strip surface area (LW).
Eq 13 \( LW = (cAI * t_r) / h \)
Rearranging for tr gives the resident time of water on the filter strip.
Eq 14 \( t_r = (hLW) / (cAI) \)
The residence time of water on the filter strip (tr) can also be approximated by assuming a well-mixed water column (Assumption No. 5) with settling and plug flow down the filter strip from the relation [Gulliver, 2007]
Eq 15 \( FR = 1 - exp(-(v_St_r) / h) \)
where FR is the fraction of a given settling velocity to be removed and vS is the settling velocity of a given size particle. Equation 15 can be rearranged to give the residence time
Eq 16 \( t_r = - (h/v_S)ln(1 - FR) \)
Substituting Equation 16 into Equation 13 results in
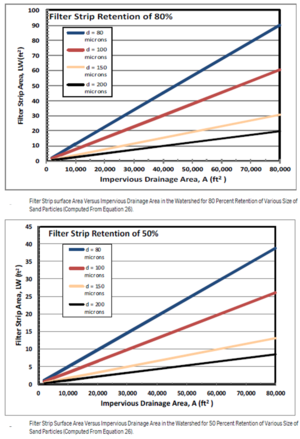
Eq 17 \( LW = - ((cAI)/v_S) Ln(1 - FR) \)
The natural log of a fraction will result in a negative number, so the area will be a positive value. Note that Equation 17 does not depend upon the flow depth. If the depth is large, the velocity is correspondingly low so the particles are allowed to settle. It is also noteworthy that the surface area of the filter strip (LW) is important, and not just the length of the filter strip. This provides flexibility to designers, as a short filter strip, within reason, can provide adequate pretreatment with a sufficient width to meet the overall surface area requirement. The roughness of the filter strip is unimportant for settling. However, the roughness should have sufficient porosity to hold and avoid sediment scour.
The fraction of a given settling velocity to be removed by the filter strip will need to be chosen by the designer. However, for a limited area of filter strip, Equation 17 can be rearranged to result in the fraction retained for a given filter strip area
Eq 18 \( FR = 1 - exp(-(v_SLW)/(cAI)) = 1 - exp(-(v_SLW)/Q) \)
The settling velocity of a given size (typically sand-shaped) particle was developed by Ferguson and Church [2004], as
Eq 19 \( v_S = (gRd^2) / (18''u'' + (0.75Rd^3)^{0.5}) \)
where g is the acceleration of gravity, R is the specific gravity of the particle relative to that of water, d is the equivalent spherical diameter of the particle, and u is the viscosity of water. Equation 19 combines Stoke's Law at small particle diameters with the turbulent drag coefficient at larger particle diameters and a transition in between. The transition is from a dependence upon d2 to one upon √d as the particle size increases.
Assuming the filter strip is being designed to settle silica-based, inorganic particles (i.e., silt and sand) at 20oC, the settling velocity of the particles at various equivalent spherical diameters are presented in the above table specifying settling velocities.
The designer must first choose the fraction of a given silt or sand size that they want to remove through settling into the filter strip. The settling velocity is then chosen from the table or using Equation 19. The design storm intensity has been chosen herein at 0.5 in/hr, and the directly connected impervious area is given by site characteristics. The surface area of the filter strip (LW), can then be computed. If the space is limited for a filter strip, the fraction of the targeted particle size removed can be computed. Sample results of these computations are given in the adjacent figures.
Filter strip sizing examples
The following section demonstrates the impact that available space has on the sizing of the pretreatment device. The length of the filter strip greatly determines the amount of pretreatment it can provide downstream BMPs. In Example D, an aggressive filter strip is highlighted, which settles 80 percent of the fine particulates that enter the BMP. Example E will demonstrate a filter strip which is fit into a limited space.
Example D. Aggressive filter strip settling
A directly connected impervious area of 10,000 ft2 with a mean slope of 3 percent, and a watershed length to the outlet of 300 ft drains into a bioretention practice. The area is a sufficient size to install a well-sized filter strip, so the designer chose to settle 80 percent of the 80 um fine-sand particles in the filter strip during the design storm. For this case, the values to be used are
- FR = 0.8
- A = 10,000 ft2
- I = 0.5 in/hr
- vS = 0.017 ft/s
- c = 0.7
- S = 0.03 ft/ft
- L = 300 ft
As in the previous examples, the peak rainfall intensity should be over a time of concentration, tc, calculated using Equation 9. The time concentration here is equal to 9 minutes and occurs within the most intense hour of an NRCS Type II storm, which accounts for approximately 50 percent of the storm total. Equation 17 then provides the values of LW
\( LW = - ((0.7 * 10000 ft^2 * 0.5 in/hr) / 0.017 ft/s) * ln(1-0.8) = 7.6 ft^2 \)
Assuming a 3-ft wide inlet, the filter strip would need to be a minimum of 2.5 ft (L = LW/W = 7.6 ft2/3 ft = 2.5 ft) in length by 2.5-ft. To settle 80 percent of the fine sand particles entering this bioretention practice, the filter strip is recommended to be 3 ft wide by 2.5 ft long.
Example E: Limited Space Filter Strip Settling
A directly-connected impervious area of 10,000 ft2 with a mean slope of 3 percent and a watershed length to the outlet of 300 ft drains into a bioretention practice. The space for a filter strip is limited to a width of 2 ft and length of 2 ft. The designer decided to compute the percent of the 100 um fine-sand particles that will settle into the filter strip during the design storm. For this case,
- A=10,000 ft2
- I = 0.5 in/hr
- vs = 0.025 ft/s
- LW = = 2 ft * 2 ft = 4 ft2
- c=0.7
- S=0.03 ft/ft
- L=300 ft
As in the previous examples, the peak rainfall intensity should be over a time of concentration, tc, calculated using Equation 9. The time concentration here is equal to 9 minutes and occurs within the most intense hour of an NRCS Type II storm, which accounts for approximately 50 percent of the storm total.
The value of FR for a 100 um fine-sand particle is
\( FR = 1 - exp( -(0.025ft/s * 4 ft^2)/(0.7 * 10,000 ft^2 * (1ac/43560ft^2/ac) * 0.5 in/hr) = 0.71 \)
The filter strip would retain 71 percent of the 100um sand particles during the design storm. This retention for the design storm will still be worth considering because for smaller storms, the retention will be greater. For example, at a 0.25 inch/hour intensity and the other conditions given above, the retention would be 93 percent of the 100 um fine-sand particles. The disadvantage of this limited space filter strip is that more silt and sand will settle downstream in the bioretention practice, requiring more frequent maintenance to maintain the water quality benefits of the BMP.
Filter strip recommendations
If the site has adequate space, installing a filter strip that would retain 80 percent of the 80 um fine-sand particles during the design storm is recommended. This method will keep the bioretention or bioinfiltration practice from filling up with fine and coarse sand particles too quickly. Both the aggressive treatment and limited space methods are acceptable if the designer is aware of the limitations of the limited space method (i.e., increased frequency of maintenance on the downstream bioretention/bioinfiltration practice). It should be noted that, even though a filter strip will retain more particles per surface area than a basin, filter strips typically require a greater level of effort to clean the pretreatment practice. In deciding between a grass filter strip or a rock filter strip, the cost of pulling and washing rocks versus lowering the level of a grass filter strip to clean out a basin should be compared before a decision is made.
Literature review of pretreatment sizing practices
We conducted a limited review of pretreatment sizing methods used by other entities.
- New Jersey. Pretreatment is required on all subsurface infiltration basins and must remove 80% of the total suspended solids (TSS) in the runoff from the Water Quality Design Storm. A concern with this approach is the variability in particle size distributions. As the adjacent figure demonstrates, the particle size corresponding with 80 percent of particles ranges from about 2 to nearly 200 microns.
- Massachusetts. Design specifications are provided for a range of devices and structural practices. When used for pretreatment, these devices and practices are assumed to remove 25 percent of TSS.
- Environment Global Stormwater Solutions. Pretreatment is based on three minutes of detention (treatment) time. Sizing therefore focuses on achieving this detention time.
- City of Inver Grove Heights. A flow chart is used to determine the level of pretreatment required. If stormwater runs over an approved filter strip or swale (based on design specifications), no pretreatment is required. Otherwise, pretreatment should remove 85 percent of TSS.
- Vermont. If stormwater is routed to forebay for required pre-treatment, forebay volumetrically sized for 10% of the computed water quality volume. Proprietary devices should be designed to remove 50 percent of TSS. Design specification are provided that are expected to meet these criteria.
- Delaware. Different pretreatment criteria are provided for different post-construction best management practices, ranging from no pretreatment for permeable pavement to 50 percent TSS removal for some infiltration practices.
- New York state. Sizing is expressed in terms of the percentage of the water quality volume that must be pretreated. For example, forebays must treat 10 percent of the Water Quality Volume and infiltration practices must receive pretreatment for 25 percent of the water quality volume.
References
- Chow, V.T., D.R. Maidment, and L.W. Mays, 1988. Applied Hydrology, McGraw-Hill, New York, NY.
- Erickson, A.J. 2012. Advanced Stormwater Treatment: Dissolved Pollutants.
- Ferguson, R.I. and Church, M., 2004. “A Simple Universal Equation For Grain Settling Velocity,” Journal Of Sedimentary Research. Vol 74, No. 6. pg 933-937.
- Gulliver, J.S. 2007. Introduction to Chemical Transport in the Environment. Cambridge University Press, Cambridge, England.
- Merkel, W., and H.F. Moody. 2015. NOAA Atlas 14 Rainfall for Midwest and Southeast States, prepared by the Natural Resources Conservation Service, Washington, D.C.
Related pages
- Pretreatment selection tool
- Overview and methods of pretreatment
- Overviews for different types of pretreatment practices
- Information for specific types of pretreatment practices
- Design, construction, operation and maintenance specifications for pretreatment vegetated filter strips
- Pretreatment - Hydrodynamic separation devices
- Pretreatment - Screening and straining devices, including forebays
- Pretreatment - Above ground and below grade storage and settling devices
- Pretreatment - Filtration devices and practices
- Pretreatment - Other pretreatment water quality devices and practices
- To see the above pages as a single page, link here
Pretreatment sizing for basins and filters strips
Guidance for managing sediment and wastes collected by pretreatment practices
Tables
- Pretreatment tables - link to tabled information for pretreatment practices
- Hydrodynamic separator tables
- Screening and straining devices tables
- Above ground and below grade storage and settling tables
- Filtration tables
- Other water quality devices tables
Other information and links
This page was last edited on 20 February 2023, at 19:47.

