Awareness of the potential for pollution of Minnesota’s water is an important beginning, but action must follow. A performance-based approach to action means that a management plan is put together focused on achieving or maintaining a certain goal. The methods used to achieve the goal are not entirely prescriptive. This allows the stormwater manager the flexibility to be innovative.
There are several principles consistent with integrated stormwater management and the treatment train approach that this Manual uses to promote proper runoff management. They are:
- Think watershed by evaluating where the water from your land comes from and where it will go when it leaves.
- Preventing the potential for a pollutant to be washed-off is always the first step in a treatment train approach to runoff management.
- Unless there is a good reason not to, such as a source of toxic material in the watershed, try to soak in as much water as possible - the treatment train starts here.
- Don’t forget that winter is a season in Minnesota and that all of that snow will eventually melt and need to be managed.
- A vegetative cover is always better than bare soil, and native vegetation is always better than decorative grass.
- The less active management a BMP requires to properly operate, the better.
- Simple is okay. Performance based means the outcome is important, not necessarily the complexity of the BMP(s).
- Thoughtful design and sound construction can reduce the level of maintenance required for effective operation and performance of BMPs.
- Proper maintenance will prolong the life and sustain an optimum level of pollution removal from a BMP.
- Each site in Minnesota requires its own unique characterization to best address its stormwater management needs and coordination with all affected parties is essential to success.
- Management designs should consider all impacts, including secondary environmental factors, health and human safety, maintenance, and financial burden.
Managing stormwater in Minnesota
Minnesota is a large and varied state. Physical elements such as climate, occurrence of water, ecology, geology, soils and topography, and cultural features such as land use vary dramatically from one end of the state to the other. Stormwater managers in Minnesota know that conditions in the state can complicate solutions that might be simple elsewhere in the country. The extreme weather conditions (cold and hot) and physiographic variability under which we operate makes it impossible to generalize a single accepted approach for the entire state under all conditions. Flexibility in approaching problems site by site is stressed in this Manual. The following section describes some of the statewide variability that can be addressed with variable techniques in the Manual. To access additional graphics see Minnesota maps.
Climate
The climate of Minnesota is characteristic of a transition zone from the moist and temperate eastern U.S. to the dry and droughty western U.S. Minnesota’s large size also means that much variation can occur within the state in any given year. Add to that extremes in temperature, and the difficulty in trying to describe Minnesota’s climate can be appreciated. Although the temperature discussion is interesting, this Manual has been developed to address water, so other than the fact that we experience very cold winters, temperature will not be discussed.
The major factors to focus on for good statewide stormwater management are rainfall and snowfall (snowmelt). A complete picture of Minnesota stormwater runoff cannot be painted without a discussion of both. Issue Paper B in the Manual Sub-Committee series examined some questions associated with the frequency of precipitation in Minnesota. The discussion was oriented around which design events to use as a basis for unified sizing of stormwater facilities across the state.
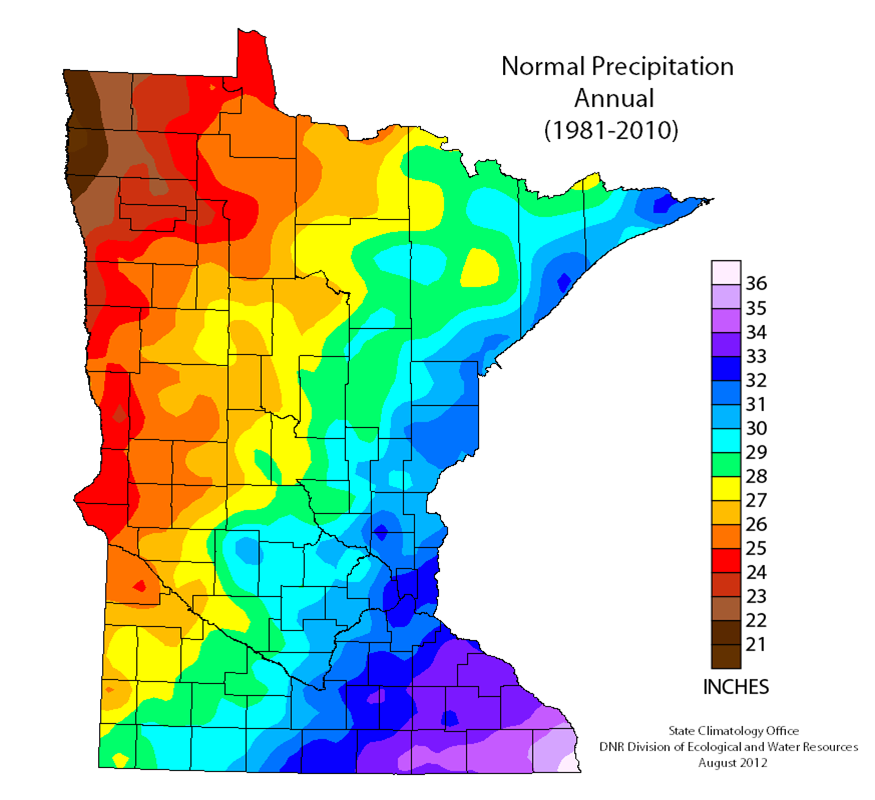
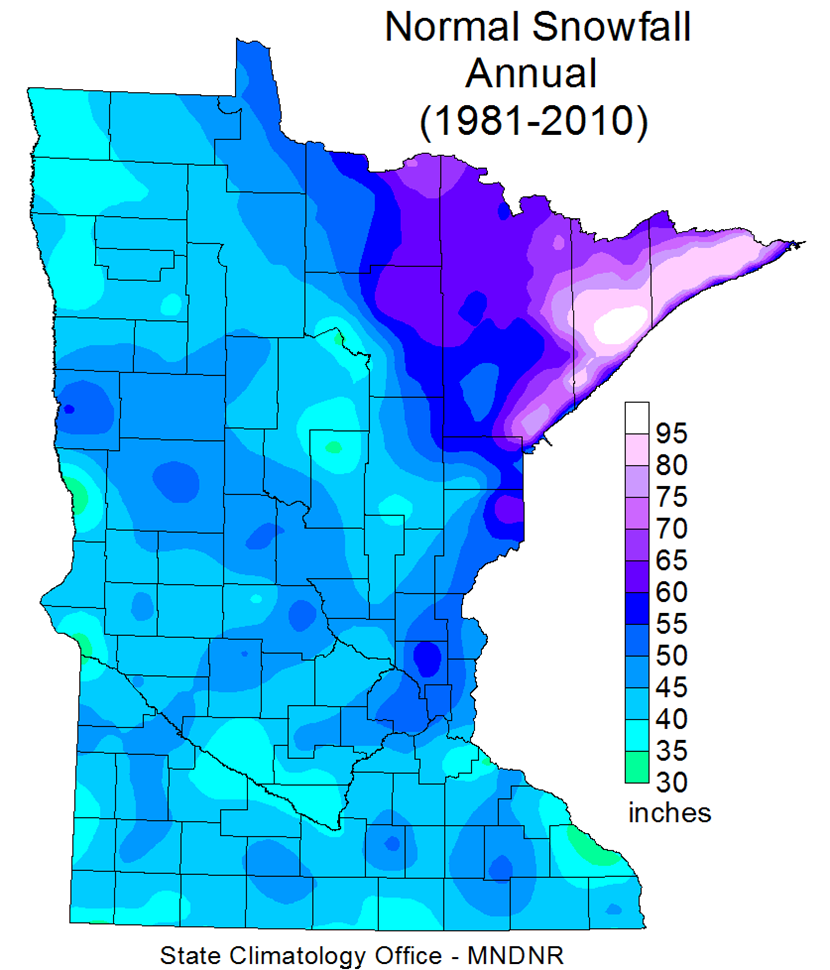
Normal average annual Minnesota precipitation (rain plus snow) varies from less than 20 inches in the northwest to about 35 inches in the southeast. Normal average annual snowfall varies from about 40 to 64 inches and follows the same geographic distribution as overall precipitation.
Rainfall
Information: Precipitation frequency information (Atlas 14) has been updated by the National Oceanographic and Atmospheric Administration (NOAA).
Atlas 14 precipitation frequency information can be found on NOAA's precipitation frequency data server.
The real impact of the precipitation that falls in the state is felt when it runs off either as rainfall or snowmelt. Issue paper B contains a substantial amount of discussion on the proper statistical representation of “design events” based on the relationship of precipitation to runoff. The discussion was intended to set the stage for selection of the unified sizing criteria. Much of the discussion with the Manual Sub-Committee concerned the use of the US Weather Bureau’s 1961 Technical Publication 40, commonly known as “TP 40”. Even though this publication is generally considered out of date because it does not reflect recent climate changes, there is no acceptable substitute at this time (see File:Issue paper B - precipitation frequency analysis and use.pdf). Until such time as an acceptable replacement exists, graphics from TP-40 should be used in Minnesota. These include graphs showing the 1-year through 100-year, 24-hour rainfall events. This data is summarized in the following table.
| Event frequency | Minnesota range (inches) | MSP International airport |
|---|---|---|
| 1-year | 1.9-2.6 | 2.47 |
| 2-year | 2.3 - 3.1 | 2.83 |
| 5-year | 2.9-3.8 | 3.54 |
| 10-year | 3.4 - 4.6 | 4.24 |
| 25-year | 4.2 - 5.8 | 5.37 |
| 50-year | 4.9 - 6.8 | 6.37 |
| 100-year | 5.7 - 7.9 | 7.50 |
Snowmelt
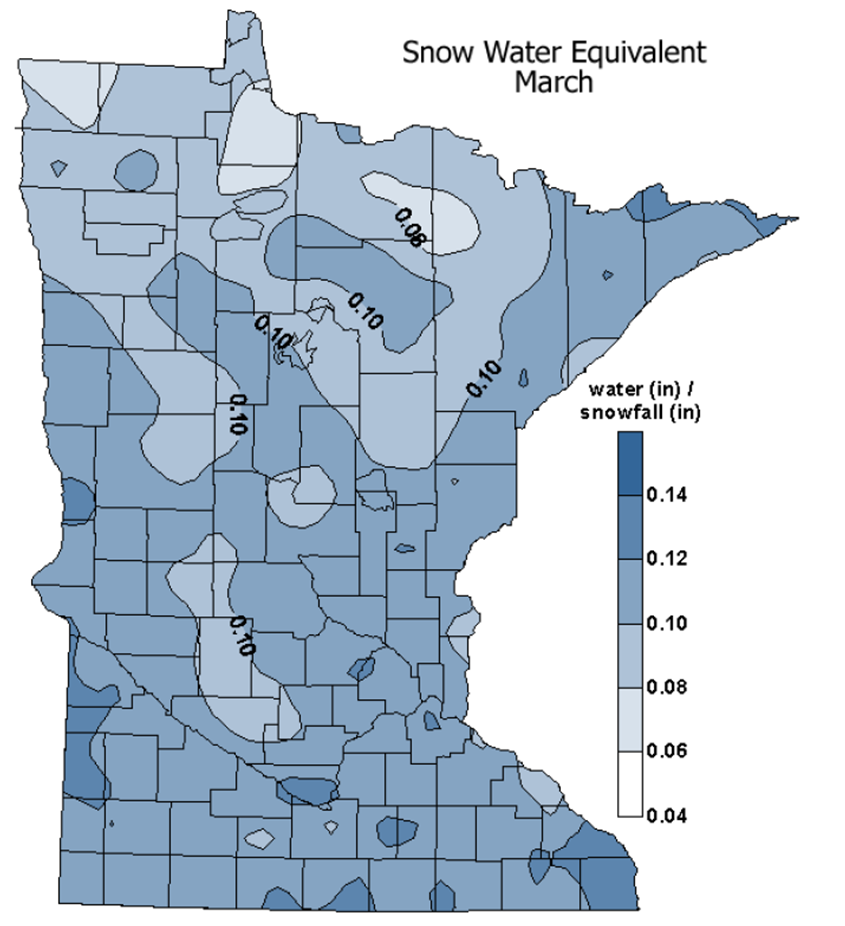
The determination of snowmelt volumes is more complicated that rainfall because it depends on two factors – snowfall depth and the amount of moisture (or the equivalent water moisture) in the snow. In addition, some of the melted water infiltrates the soil. The overall snowmelt volume is given by the following equation
\(S_v = (S_d S_w) - I_v\)
where
Sv is the snowmelt volume (inches);
Sd is the average snow pack depth at the time of the snowmelt period (inches);
Sw is the typical snow pack water equivalent at time of melt; and
Iv is the estimated infiltration volume likely during a 10 day melt period
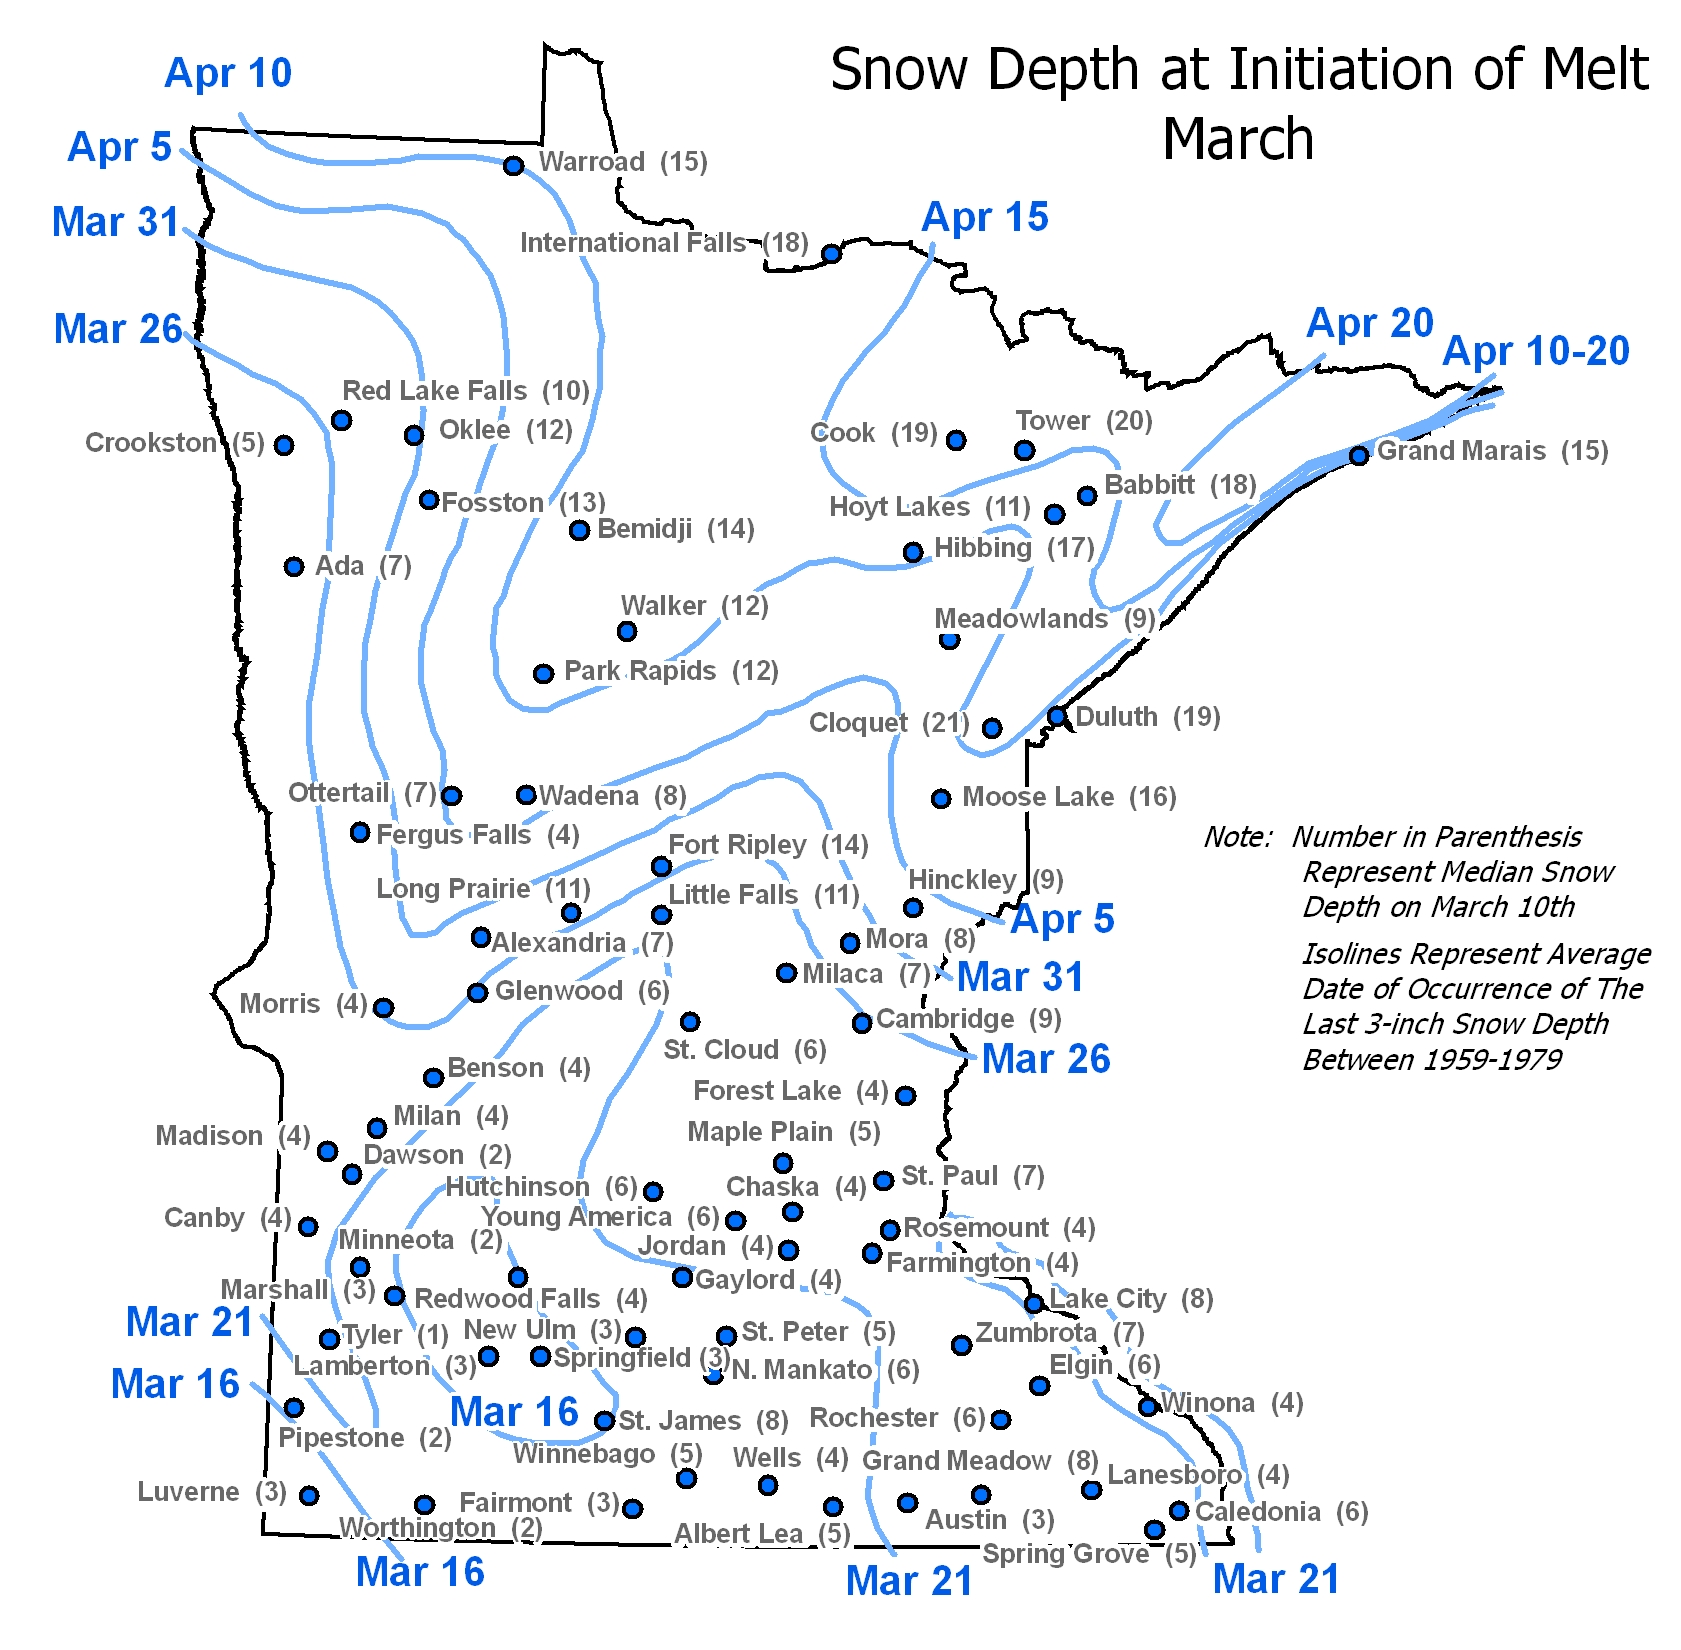
Statewide maps can be established estimating the snow depth at the initiation of snowmelt, the snow water equivalent at the time of snowmelt, and snowmelt infiltration based on the soil moisture content.
Details regarding Minnesota climate in general can be obtained from the Minnesota Climatology Working Group.
Of course not all of the meltwater runs off. Research indicates that some of the meltwater enters the ground as infiltration. This can be represented graphically, but graphics need local adjustment based on knowledge of ground conditions. These graphics should be considered an approximation of the amount of melt that will soak into the ground and hence be removed from the total runoff volume.
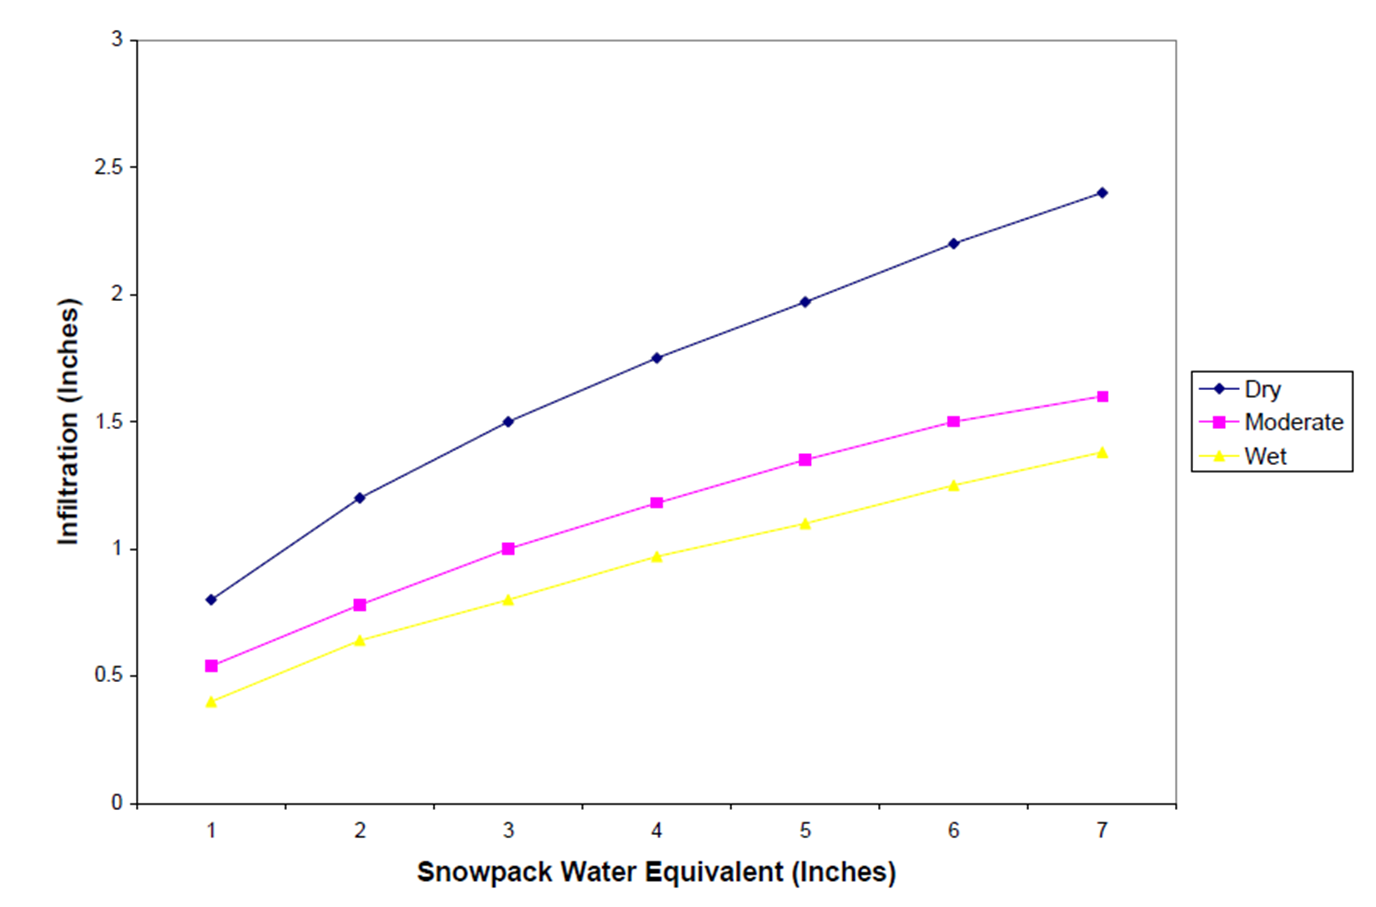
Information: Using the figures on this webpage, an example calculation of the amount of snowmelt available for runoff can be made. Total runoff is the product of the snowpack depth times the water equivalent. For example, St. Paul would be 7 inches (0.58 feet) times approximately 0.11 inches of equivalent water equals about 0.77 inches of water that will be available for runoff during a total melt of the snowpack. For Tower, the snow on the ground at melt is closer to 20 inches, but the snow water equivalent is only 0.09 inches, so the amount available for runoff is about 1.8 inches.
Physical features
Many of the physical features that influence the behavior of stormwater are not mapped at a level of sufficient enough detail for the state. This section will generally describe the features of importance and refer the user to sources of better information.
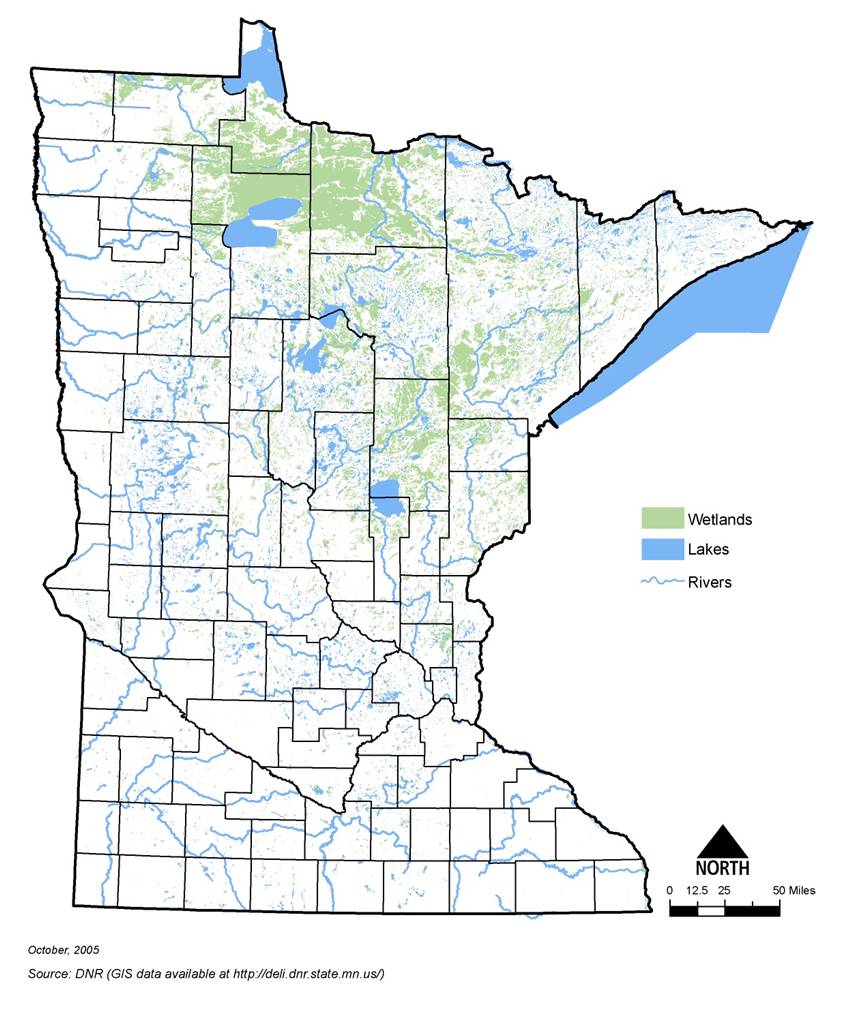
Minnesota waters
Due to the richness and variety of Minnesota’s water resources, several classes of waters have been identified for special protections through legislation or programs designed to protect these unique resources.
- Special Waters: Special Waters are designated in the Minnesota Construction Stormwater General Permit, and include the following categories of receiving waters:
- Impaired waters: Waters are assessed as impaired when an applicable water quality standard is not being attained. Waters that are impaired require completion of a total maximum daily load (TMDL). For more information on TMDLs, link here. Also see Guidance for using the Stormwater Special and impaired waters search tool.
- Outstanding Resource Value Waters (ORVW): ORVWs are designated in Minnesota Rules Chapter 7050 and include the following categories:
- Wild, scenic, and recreational river segments [13]
- Lake Superior
- Portions of the Mississippi River from Lake Itasca to the southerly boundary of Morrison County
- Other waters of the state with high water quality, wilderness characteristics, unique scientific or ecological significance, exceptional recreational value, or other special qualities which warrant stringent protection from pollution [14]
- Other sensitive receiving waters: In addition to the Special Waters and ORVWs, there are several other classes of sensitive receiving waters, as defined by a variety of federal, state and local entities, that receive special protections and merit additional management attention. These other sensitive receiving waters can be broken down into five general classes:
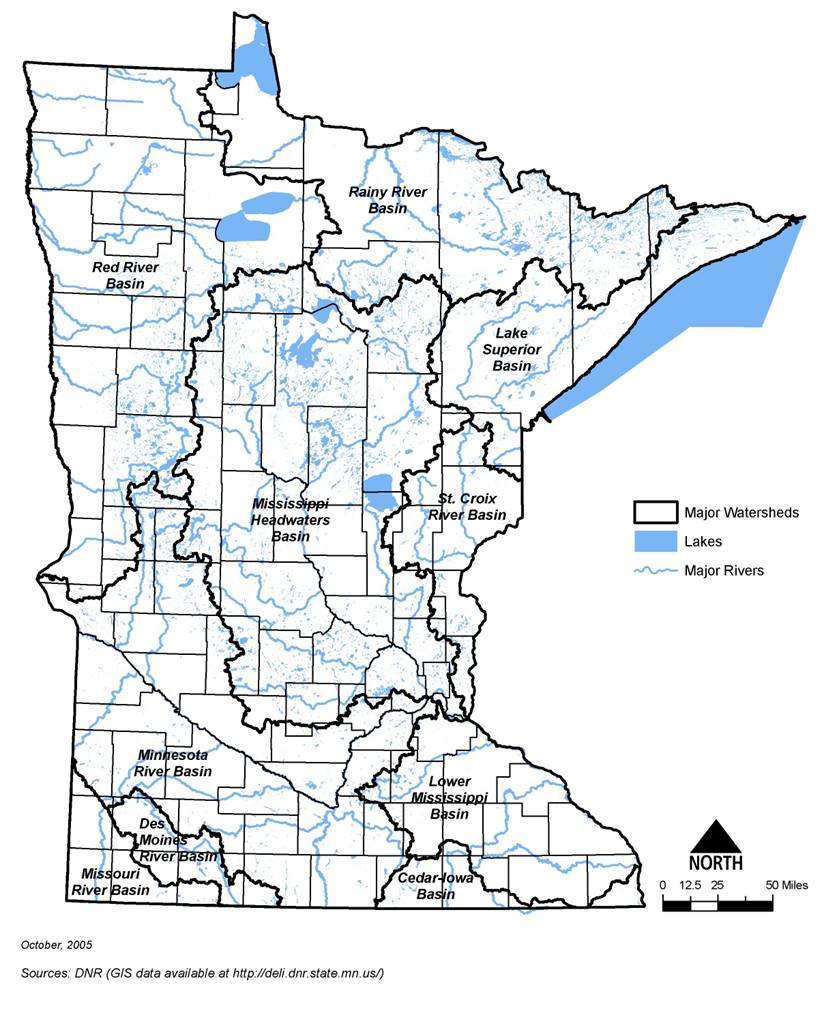
Watersheds and ecoregions
Watershed-based water management began in earnest in the state in the mid-1950s and has had several additional mandates put in place since then. Watershed districts, watershed management and watershed-based planning are all common terms within the state. There are eight major watershed basins across the state. Details on local watersheds are available from local sources, the [www.dnr.state.mn.us/watersheds/map.html Minnesota Department of Natural Resources] or the Minnesota Association of Watershed District’s “Where is my Watershed?” website.
The reality associated with so many watershed units occurring in the state is that a complex planning and regulatory framework exists for water management. Many of the sub-watersheds contained within the major watershed units have watershed management organizations that typically have some level of authority through a Watershed District or Watershed Management Organization. Information on the location and operations of these organizations can be obtained from the Board of Water and Soil Resources.
Another primary watershed mapping unit for Minnesota waters is based on MPCA’s ecoregion concept. These are geographic areas reflective of similar ecological character assembled to define causative factors for water behavior. There are seven ecoregions mapped for the state:
- Northern Minnesota Wetlands
- Red River Valley
- Northern Lakes and Forests
- Northern Glaciated Plains
- North Central Hardwood Forests
- Western Corn Belt Plains
- Driftless Area
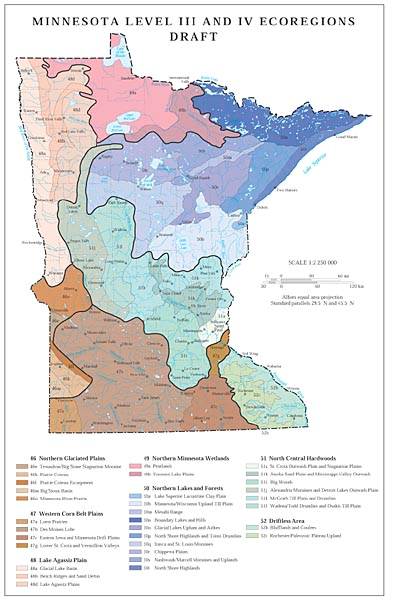
Although not universally true, waters within each ecoregion should generally be similar in character, when all other factors (like rainfall, land use, and land cover) are similar. MPCA uses these as basic planning units for setting water quality standards and evaluating water quality variation. Keeping in mind the watershed and ecoregion within which water is being managed is an important part in structuring an effective management approach for stormwater.
The variable ecology across the state can be presented in many different ways. One example is the concept of ecoregion sections developed by the DNR. The DNR's division of ecoregions is based largely on surficial geology and geologic landforms. As with any statewide map, data should be verified with local data when used as a consideration in stormwater design.
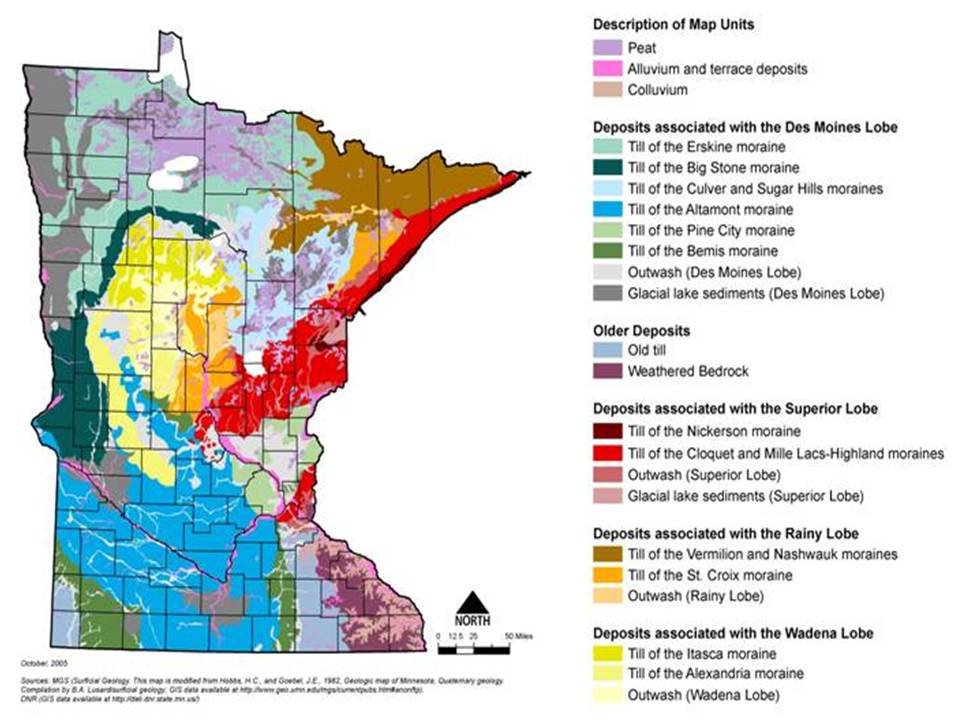
Geology
The geologic variability across Minnesota is reflective of billions of years of igneous and sedimentary history, plus geologically “recent” glaciation which is responsible for much of Minnesota’s vast natural beauty and abundance of water related resources. In most cases, the debris left behind by the glaciers provides a thick cover between the land surface and the buried surface of the underlying bedrock. In other cases, this glacial material either by-passed a location or has been eroded away, exposing bedrock to material (and possibly pollution) that comes from the land surface. Manual users are referred to the Minnesota Geological Survey (MGS) for details on the geology of the state.
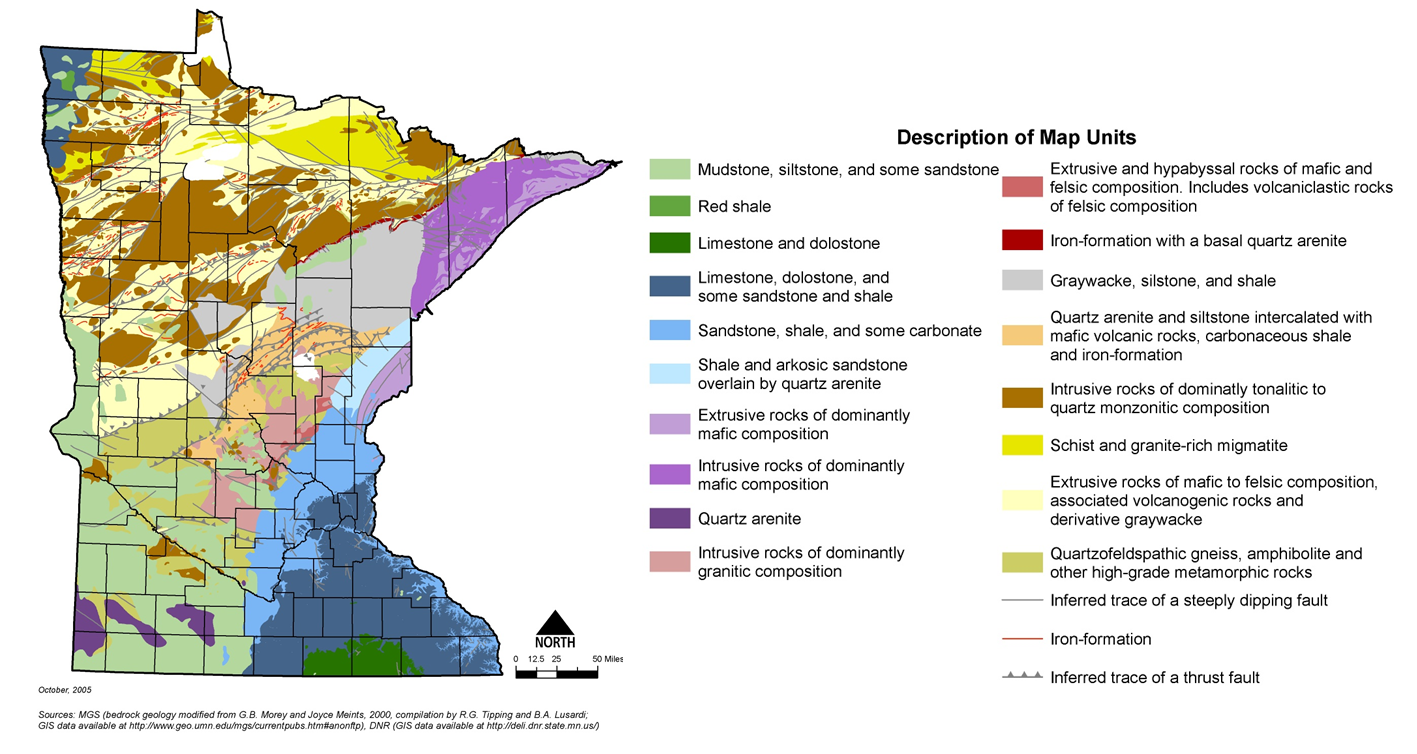
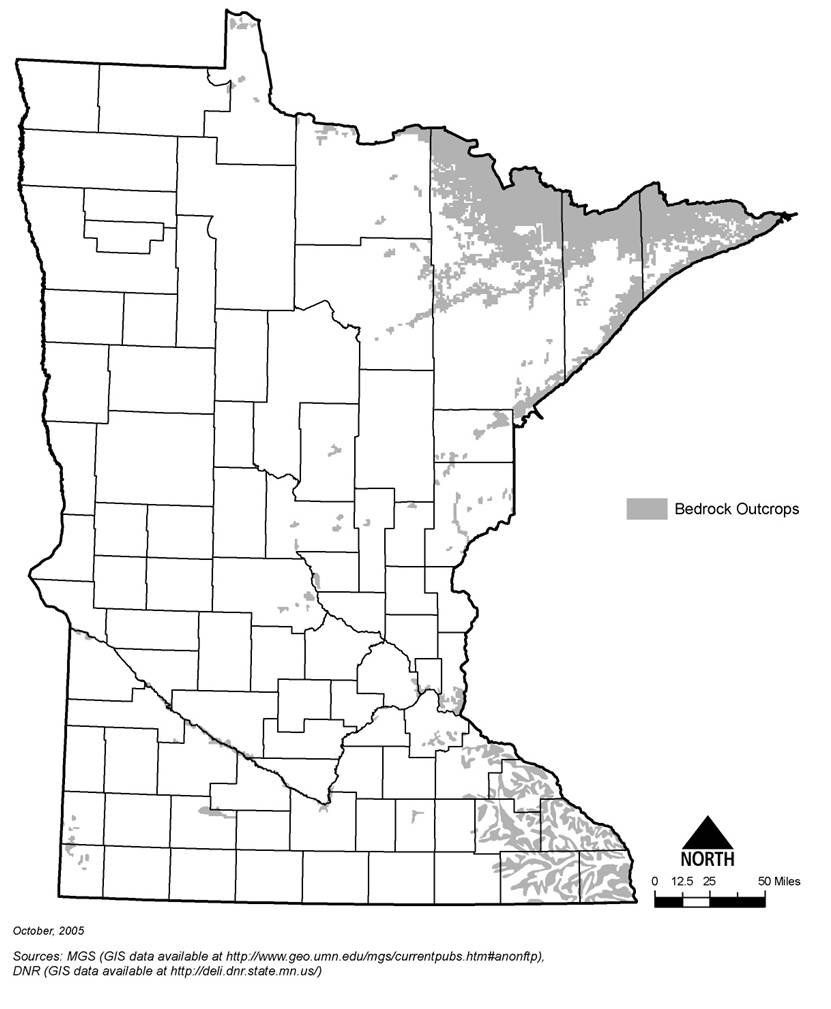
Shallow bedrock
In many portions of the state, bedrock occurs at or near the surface. The “red rocks” of the southwest, igneous intrusions along the St. Croix River and North Shore, and scattered sedimentary outcrops all around the state present some challenges in stormwater management because of their proximity to the surface. Among those difficulties are a lack of soil depth for use of infiltration techniques, structural impairment to best management practice (BMP) installation and steep slopes. The stormwater management implications of shallow bedrock affect infiltration, ponding depths, and the use of underground practices. Details can be obtained from the Minnesota Geological Survey (MGS) or a reliable local source, such as the county or a local well driller.
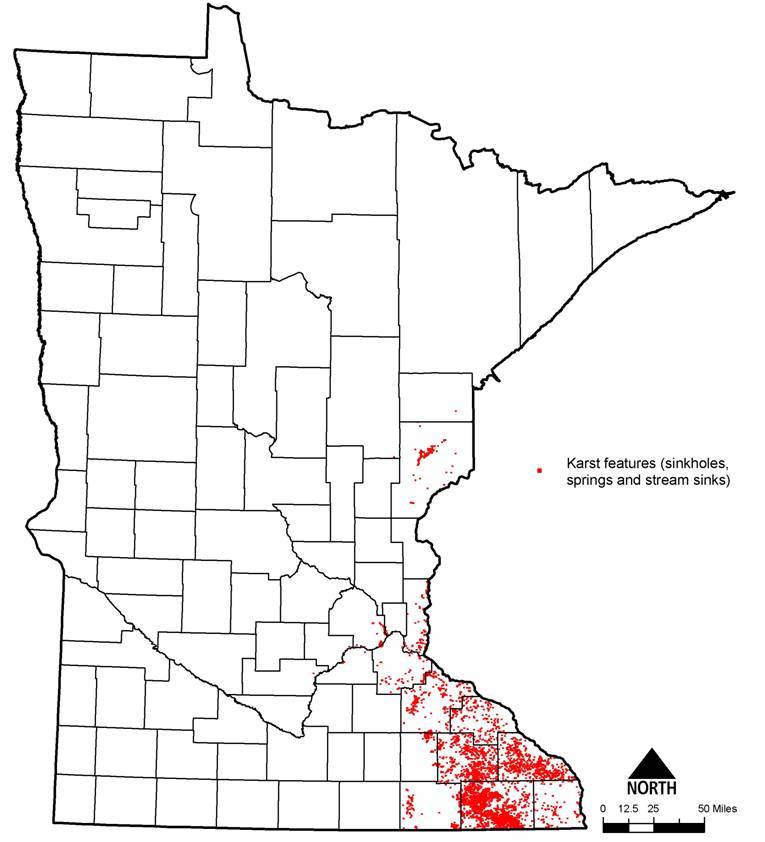
Karst
Carbonate and possibly other forms of bedrock can erode or dissolve in a manner that opens up pathways for movement of water into and through the rock. Such karst features, if sufficiently close to the land surface or to a ground water flow pathway, can present an opportunity for surface contaminants to enter the ground water system with very little or no treatment. This has important implications with respect to geotechnical testing, infiltration, pre-treatment and ponding of runoff.
Karst regions are predominantly found in the southeastern portion of the state. Caution must be used in interpreting the geographic depiction of “Karst lands”. Local data should be used when available rather than using a generalized statewide map.
In karst settings where active karstic conditions (within 50 feet of the surface) are known to exist, additional constraints and considerations need to be evaluated prior to implementing most structural BMPs. Of particular concern in karst settings is the formation of sinkholes as a result of hydraulic head build up and/or dissolution of rock present underneath or adjacent to BMPs. Concerns also exist for ground water flow interruption, interflow and recharge particularly as it relates to stormwater facility, location, and size and the relationship of ground water to surface water. Where karst conditions exist, there are no prescriptive rules of thumb or universally accepted management approaches because of the variability intrinsic to karst terrain. An adaptation of a familiar old saying is very appropriate: the only thing predictable about the behavior of water in a karst system is its unpredictability.
In general when underlying karst is known or even suspected to be present at the site, stormwater runoff should not be concentrated and discharged into known sinkholes, but should rather be dispersed, or soaked into the ground after adequate pre-treatment, or conveyed to a collection and transmission system away from the area. In other cases, it may be impossible to remove water from an area with sinkholes or away from karst geology, so common sense clean-up of the water and discharge into the karstic area is a reasonable management approach, especially if some filtering soil is available between the land surface and the karst formation.
Soils
One of the first steps in the selection of BMPs is an assessment of the type of soils present on a site and the inherent ability of those soils to soak-up water. Soils are extremely variable throughout the state, but fortunately good information on local soil conditions is usually available. Details on surficial soils (generally to a depth of about six feet) are contained in county soil surveys, which are available from the U.S. Department of Agriculture’s Natural Resource Conservation Service (NRCS). Soil surveys for much of the state have been digitized to make electronic use practical. Note, however, that these surveys are not accurate enough to determine site specific characteristics suitable for many BMP applications, so a detailed site analysis is recommended. The primary reason for this is that soils can vary substantially with depth, and the county soil surveys depict only surficial mapped units.
Limited infiltration capacity
Soils with low infiltration capacity are found throughout the state. On a local scale the absence of good soils that can absorb runoff (i.e., infiltrate) can be a major detriment to good stormwater management. Stormwater management limitations in areas with “tight” soils generally preclude large-scale infiltration and ground water recharge (infiltration that passes into the ground water system). These soils will typically be categorized under Hydrologic Soil Group (HSG) D and have other characteristics. The infiltration rates noted in this table are conservative estimates of long-term, sustainable infiltration rates that have been documented in Minnesota. They are based on in-situ measurement within existing infiltration practices in Minnesota, rather than national numbers or rates based on laboratory columns.
Use of HSG C or D soils for BMPs that rely on infiltration is generally not recommended unless a pre-development condition is trying to be simulated. That is, these soils can certainly be used in a system that relies only on a small amount of infiltration similar to the small amount that inherently exists on site. If a manager wants to match pre-development volume for all soils, it is apparent that D soils will continue to yield low infiltration.
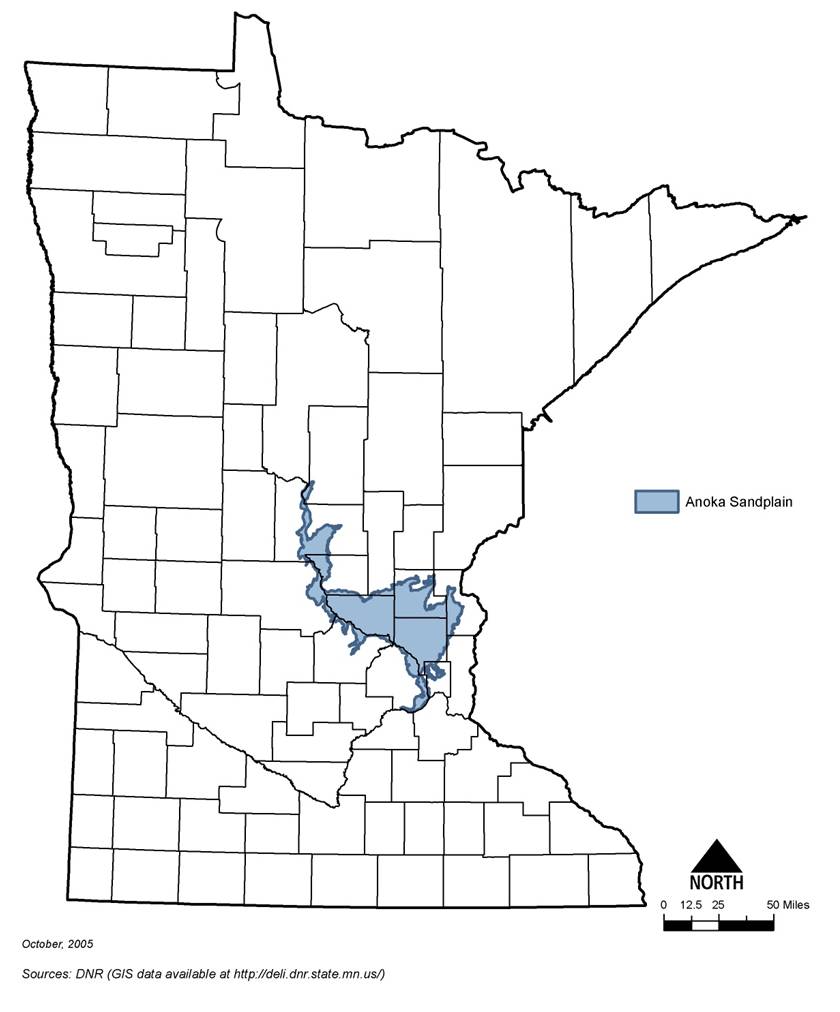
Rapidly infiltrating soils
On the opposite side of the infiltration spectrum are those soils that rapidly infiltrate water from the surface. Soils with large percentages of sand and separate from the water table transmit water very quickly and might work extremely well for infiltration practices provided precautions are taken to protect the ground water from the introduction of polluting materials. The level of treatment in sandy soils is quite variable. Although the sands can act similar to a sand filter for particulate material, soluble pollutants generally move through the soil quite rapidly and unattenuated. An example of a large-scale sandy soil condition is the Anoka Sand Plain. Similar large expanses of sandy soils exist elsewhere in Minnesota and should be recognized when planning a BMP strategy.
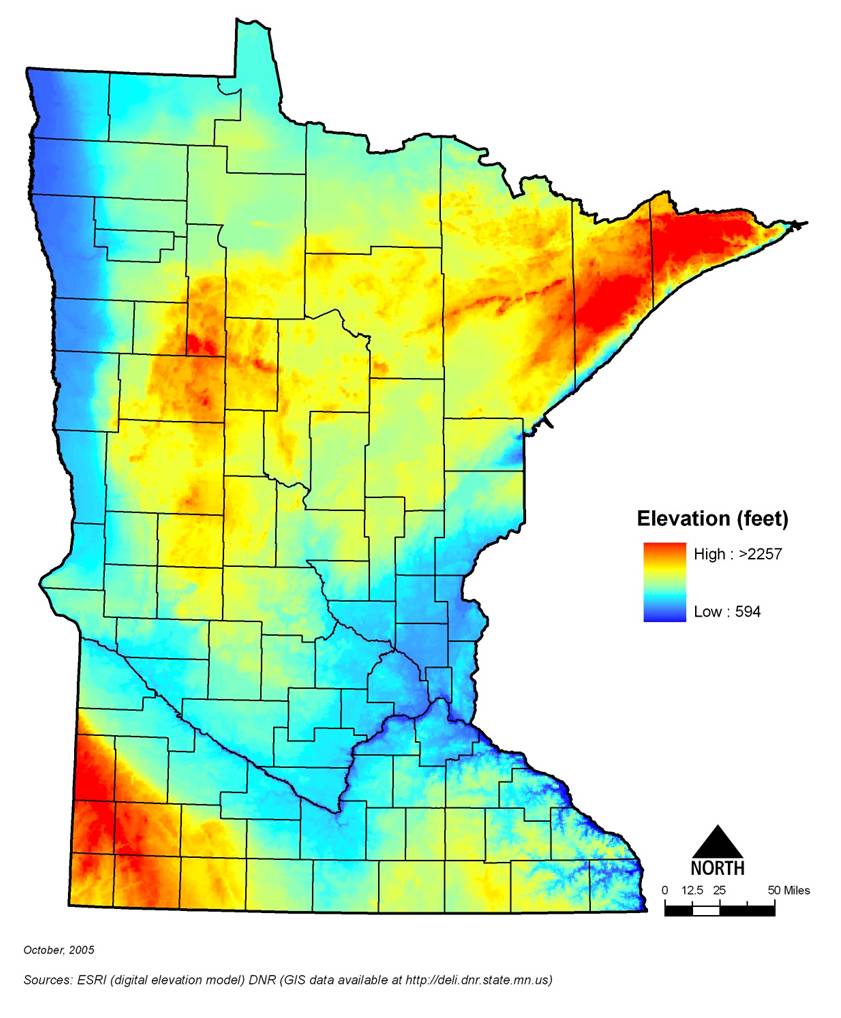
Topography
The elevation and topographical changes evident in Minnesota also present variable challenges to local stormwater managers. For example, the steep slopes along the North Shore and along many major river banks requires a far different approach than those practices where a deep soil cover exists on a flat plain or slowly rolling hills. Local attention is required when information on slope, topography and physiographic character is part of the stormwater management deliberation.
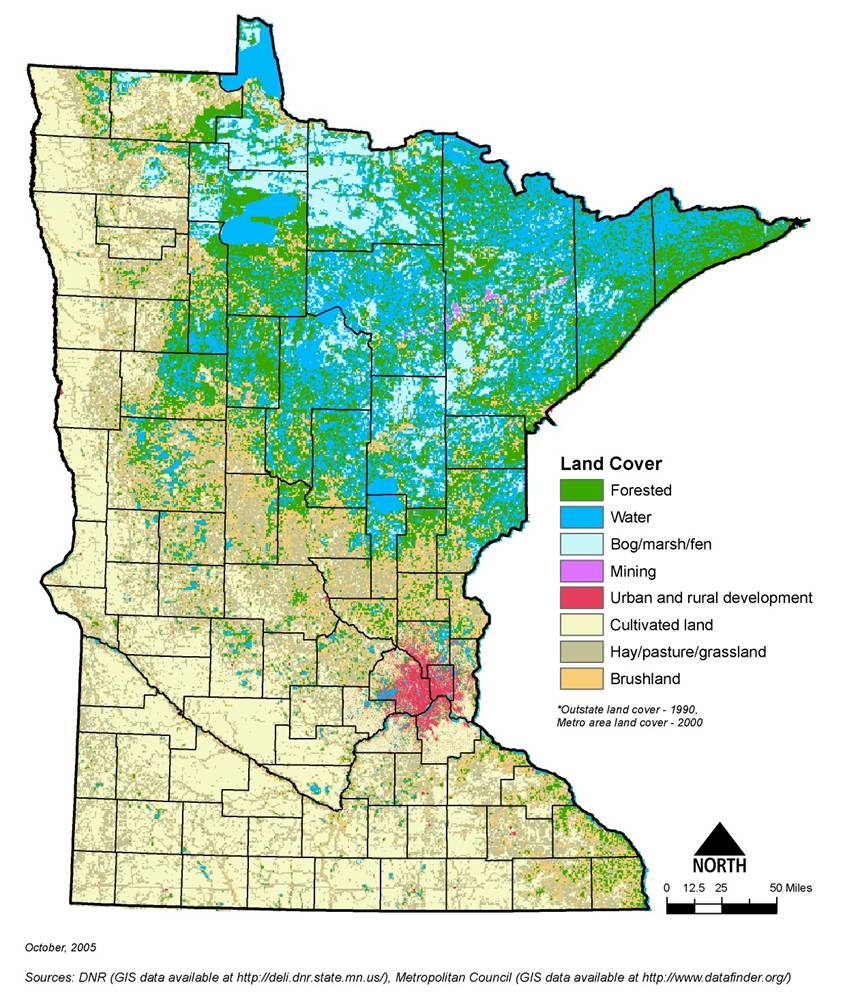
Cultural features
Most of the cultural variation in the state relates to differences in land use that have resulted as the state developed over the past 100+ years. Although the major focus of this Manual is on urbanized land uses, many urbanizing type activities, such as road building, transcend a single land use and apply throughout the state. Also in many cases urbanization occurs on land that was previously altered by agricultural, silvicultural, or pre-development activity.